
Key Insights
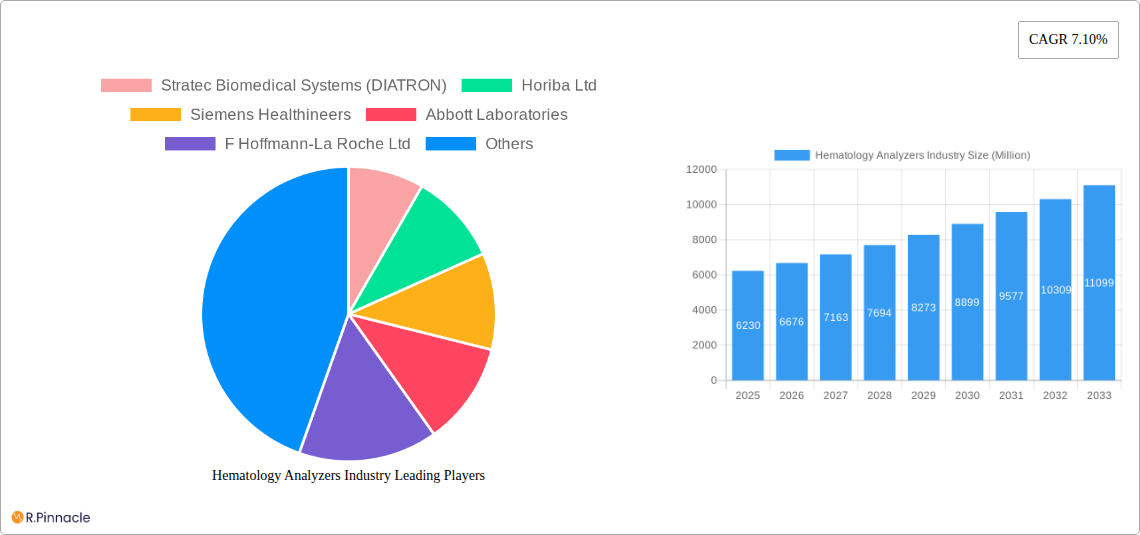
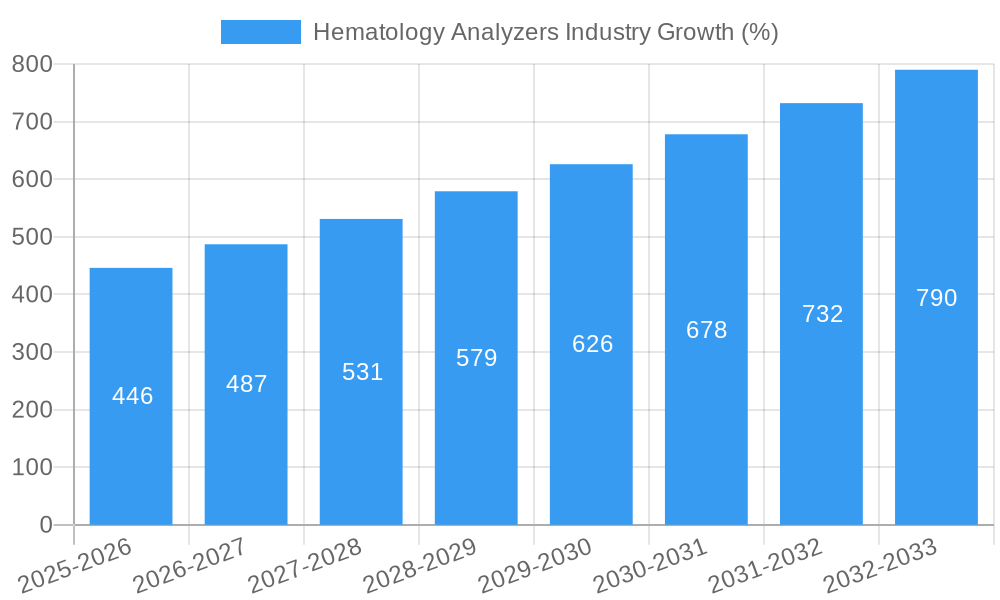
The global hematology analyzers market, valued at $6.23 billion in 2025, is projected to experience robust growth, driven by a compound annual growth rate (CAGR) of 7.10% from 2025 to 2033. This expansion is fueled by several key factors. The increasing prevalence of blood-related disorders like leukemia, anemia, and various blood cancers necessitates advanced diagnostic tools, bolstering demand for sophisticated hematology analyzers. Technological advancements, including the introduction of automated, high-throughput analyzers with improved accuracy and efficiency, are further propelling market growth. The rising geriatric population, more susceptible to hematological diseases, also contributes significantly to market expansion. Furthermore, the continuous expansion of healthcare infrastructure, particularly in developing economies, is creating new market opportunities for manufacturers of hematology analyzers. Growth is also driven by a rising demand for point-of-care testing and improved diagnostic capabilities for faster and more accurate results leading to better patient outcomes and reduced healthcare costs.
However, the market faces certain challenges. High initial investment costs associated with purchasing and maintaining advanced hematology analyzers can limit accessibility, particularly in resource-constrained settings. Stringent regulatory requirements for medical devices also pose a hurdle for manufacturers. Nevertheless, the overall market outlook remains positive, driven by the aforementioned factors. The market segmentation reveals significant contributions from hospitals and clinical laboratories as key end-users, with a steady demand for both instruments and associated reagents and services. Leading players like Siemens Healthineers, Abbott Laboratories, and Roche are driving innovation and shaping the competitive landscape through continuous product development and strategic partnerships. The regional breakdown indicates strong growth potential across North America, Europe, and the Asia-Pacific region, reflecting increasing healthcare expenditure and technological adoption in these markets.
Hematology Analyzers Industry: A Comprehensive Market Report (2019-2033)
This in-depth report provides a comprehensive analysis of the global hematology analyzers market, offering valuable insights for industry professionals, investors, and stakeholders. The report covers the period 2019-2033, with a focus on 2025 (base and estimated year) and forecasts extending to 2033. The market is segmented by product type (Instruments, Reagents, Services), end-user (Hospitals, Clinical Laboratories, Research Institutes, Other End Users), and leading geographic regions. The total market value is projected to reach xx Million by 2033.
Hematology Analyzers Industry Market Structure & Innovation Trends
This section analyzes the competitive landscape, innovation drivers, and regulatory influences shaping the hematology analyzers market. The market exhibits moderate concentration, with key players holding significant shares. For example, Sysmex Corporation and Siemens Healthineers collectively hold an estimated xx% market share (2024 data). Innovation is driven by the need for faster, more accurate, and cost-effective diagnostic solutions, fueled by technological advancements in automation, AI, and miniaturization.
- Market Concentration: Moderately concentrated, with top 5 players holding approximately xx% market share in 2024.
- Innovation Drivers: Advancements in automation, AI-powered diagnostics, point-of-care testing, and miniaturization.
- Regulatory Landscape: Stringent regulatory approvals (e.g., FDA, CE marking) influence market entry and product development.
- Product Substitutes: Limited direct substitutes; however, alternative diagnostic methods pose indirect competition.
- M&A Activity: Moderate M&A activity observed, with deal values ranging from xx Million to xx Million in recent years (2019-2024). These activities have primarily focused on expanding product portfolios and geographical reach. Specific examples of M&A transactions are not publicly available for detailed reporting.
- End-User Demographics: Growth is predominantly driven by the increasing prevalence of chronic diseases and the expanding healthcare infrastructure in developing economies.
Hematology Analyzers Industry Market Dynamics & Trends
The hematology analyzers market is experiencing robust growth, driven by several factors. The rising prevalence of chronic diseases like blood cancers and hematological disorders is a significant driver. Technological advancements, such as the integration of artificial intelligence (AI) for improved diagnostic accuracy and automation for increased efficiency, are further boosting market expansion. Furthermore, increasing demand for point-of-care testing and the expanding healthcare infrastructure in emerging economies are contributing to market growth.
The compound annual growth rate (CAGR) for the period 2025-2033 is projected to be xx%, driven by factors such as increasing demand for advanced hematology analyzers with improved accuracy and automation capabilities. Market penetration is highest in developed regions, but significant growth potential exists in developing economies. Competitive dynamics are characterized by both intense rivalry among established players and the emergence of new entrants with innovative technologies.
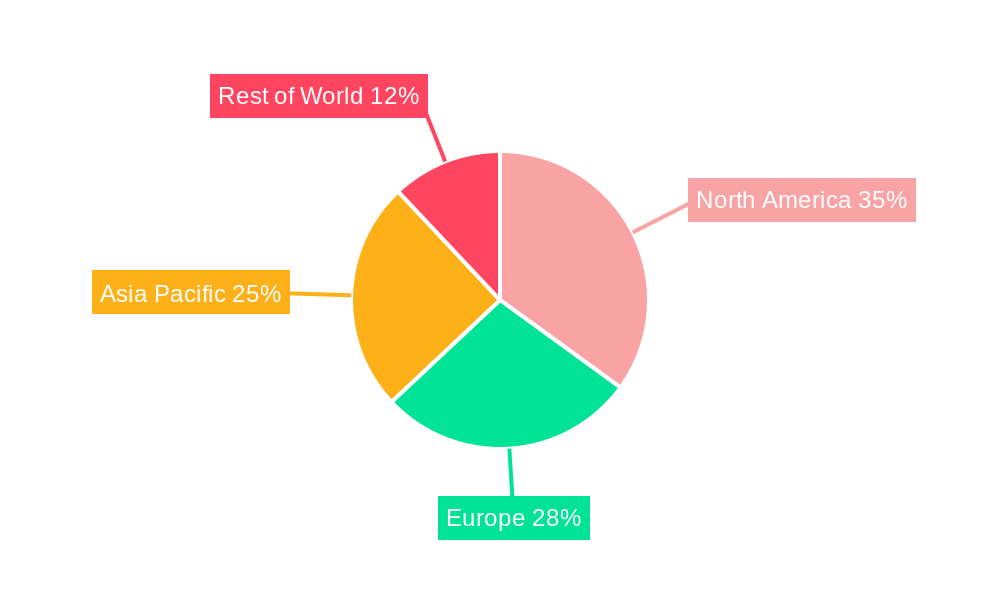
Dominant Regions & Segments in Hematology Analyzers Industry
North America currently holds the largest market share, driven by advanced healthcare infrastructure, high adoption rates of sophisticated technologies, and the increasing prevalence of chronic diseases. However, the Asia-Pacific region is expected to witness the fastest growth during the forecast period due to rising healthcare expenditure, increasing awareness of hematological disorders, and rapid urbanization.
Key Drivers:
- North America: High healthcare expenditure, advanced medical infrastructure, and high prevalence of chronic diseases.
- Europe: Well-established healthcare systems, stringent regulatory frameworks, and increasing geriatric population.
- Asia-Pacific: Rapidly expanding healthcare infrastructure, rising disposable incomes, and increasing prevalence of chronic diseases.
- Rest of the World: Growth driven by improving healthcare accessibility and increasing awareness of hematological disorders.
Segment Dominance:
- Product Type: Instruments segment dominates due to high initial investment and recurring revenue from reagents.
- End-User: Hospitals represent the largest end-user segment, driven by their extensive testing capabilities.
The services segment is experiencing increasing growth, fueled by the rising need for instrument maintenance, calibration, and technical support. Reagents are crucial for analyzer functionality and represent a substantial recurring revenue stream for manufacturers.
Hematology Analyzers Industry Product Innovations
Recent innovations in hematology analyzers focus on improving accuracy, speed, and efficiency through automation and advanced technologies like AI and machine learning. These advancements enable faster turnaround times, reduced manual intervention, and improved diagnostic accuracy. The integration of point-of-care testing capabilities is also gaining traction, allowing for faster diagnosis and treatment in various settings. These innovations cater to the market need for faster, more efficient, and cost-effective diagnostic solutions.
Report Scope & Segmentation Analysis
This report segments the hematology analyzers market based on product type (Instruments, Reagents, Services), end-user (Hospitals, Clinical Laboratories, Research Institutes, Other End Users), and geography. Each segment's market size, growth projections, and competitive dynamics are thoroughly analyzed. The instrument segment is expected to maintain its dominance, while the reagents and services segments are projected to experience robust growth driven by increasing analyzer usage. The hospital segment will remain the largest end-user segment.
Key Drivers of Hematology Analyzers Industry Growth
Several factors contribute to the growth of the hematology analyzers market. Technological advancements in automation, AI, and miniaturization lead to improved efficiency, accuracy, and cost-effectiveness. The rising prevalence of chronic diseases requiring frequent blood tests fuels market demand. Furthermore, favorable government regulations and increasing healthcare expenditure are positively impacting market growth.
Challenges in the Hematology Analyzers Industry Sector
The industry faces challenges such as stringent regulatory approvals, which can increase time to market and development costs. Supply chain disruptions can impact the availability of crucial components. Furthermore, intense competition from established players and new entrants creates pressure on pricing and profitability. These factors can impact overall market growth.
Emerging Opportunities in Hematology Analyzers Industry
Emerging opportunities include the integration of AI for improved diagnostic accuracy and the development of point-of-care testing devices for faster diagnosis in diverse settings. Expanding into underserved markets in developing economies presents a significant growth opportunity. Furthermore, innovations in reagent technology and personalized medicine offer promising avenues for future growth.
Leading Players in the Hematology Analyzers Industry Market
- Stratec Biomedical Systems (DIATRON)
- Horiba Ltd
- Siemens Healthineers
- Abbott Laboratories
- F Hoffmann-La Roche Ltd
- Ortho Clinical Diagnostics
- Boule Diagnostics AB
- Bio-Rad Laboratories
- Beckman Coulter Inc (Danaher Corporation)
- Sysmex Corporation
- Accurex Biomedical Pvt Ltd
- Nihon Kohden Corporation
Key Developments in Hematology Analyzers Industry
- May 2022: Nihon Kohden India established a new hematology analyzer reagent factory, expanding its manufacturing capabilities and potentially impacting market supply.
- March 2022: Mindray launched the BC-700 Series hematology analyzer, introducing a new product line with CBC and ESR testing capabilities, enhancing competition and potentially impacting market share.
Future Outlook for Hematology Analyzers Industry Market
The hematology analyzers market is poised for continued growth, driven by technological advancements, increasing prevalence of chronic diseases, and expansion into emerging markets. Strategic partnerships, product innovation, and expansion into point-of-care testing will be key factors influencing future market success. The market presents attractive opportunities for companies that can leverage technological advancements and meet the growing demand for accurate and efficient diagnostic solutions.
Hematology Analyzers Industry Segmentation
-
1. Product Type
-
1.1. Instruments
- 1.1.1. 3 Part Hematology Analyzer
- 1.1.2. 5 Part Hematology Analyzer
- 1.1.3. Point-of-care Testing Hematology Analyzers
- 1.1.4. Others
- 1.2. Reagents
- 1.3. Services
-
1.1. Instruments
-
2. End User
- 2.1. Hospitals
- 2.2. Clinical Laboratories
- 2.3. Research Institutes
- 2.4. Other End Users
Hematology Analyzers Industry Segmentation By Geography
-
1. North America
- 1.1. United States
- 1.2. Canada
- 1.3. Mexico
-
2. Europe
- 2.1. Germany
- 2.2. United Kingdom
- 2.3. France
- 2.4. Italy
- 2.5. Spain
- 2.6. Rest of Europe
-
3. Asia Pacific
- 3.1. China
- 3.2. Japan
- 3.3. India
- 3.4. Australia
- 3.5. South Korea
- 3.6. Rest of Asia Pacific
-
4. Middle East and Africa
- 4.1. GCC
- 4.2. South Africa
- 4.3. Rest of Middle East and Africa
-
5. South America
- 5.1. Brazil
- 5.2. Argentina
- 5.3. Rest of South America
Hematology Analyzers Industry REPORT HIGHLIGHTS
| Aspects | Details |
|---|---|
| Study Period | 2019-2033 |
| Base Year | 2024 |
| Estimated Year | 2025 |
| Forecast Period | 2025-2033 |
| Historical Period | 2019-2024 |
| Growth Rate | CAGR of 7.10% from 2019-2033 |
| Segmentation |
|
Table of Contents
- 1. Introduction
- 1.1. Research Scope
- 1.2. Market Segmentation
- 1.3. Research Methodology
- 1.4. Definitions and Assumptions
- 2. Executive Summary
- 2.1. Introduction
- 3. Market Dynamics
- 3.1. Introduction
- 3.2. Market Drivers
- 3.2.1. Rising Burden of Blood Disorders; Increasing Technological Advancements and Rising Adoption Rates of Automated Hematology Instruments
- 3.3. Market Restrains
- 3.3.1. High Cost of Hematology Analyzers; Time-consuming and Stringent Rregulatory Policies
- 3.4. Market Trends
- 3.4.1. 3 Part Hematology Analyzer is the Segment by Instruments Expected to Hold Significant Market Share Over the Forecast Period
- 4. Market Factor Analysis
- 4.1. Porters Five Forces
- 4.2. Supply/Value Chain
- 4.3. PESTEL analysis
- 4.4. Market Entropy
- 4.5. Patent/Trademark Analysis
- 5. Global Hematology Analyzers Industry Analysis, Insights and Forecast, 2019-2031
- 5.1. Market Analysis, Insights and Forecast - by Product Type
- 5.1.1. Instruments
- 5.1.1.1. 3 Part Hematology Analyzer
- 5.1.1.2. 5 Part Hematology Analyzer
- 5.1.1.3. Point-of-care Testing Hematology Analyzers
- 5.1.1.4. Others
- 5.1.2. Reagents
- 5.1.3. Services
- 5.1.1. Instruments
- 5.2. Market Analysis, Insights and Forecast - by End User
- 5.2.1. Hospitals
- 5.2.2. Clinical Laboratories
- 5.2.3. Research Institutes
- 5.2.4. Other End Users
- 5.3. Market Analysis, Insights and Forecast - by Region
- 5.3.1. North America
- 5.3.2. Europe
- 5.3.3. Asia Pacific
- 5.3.4. Middle East and Africa
- 5.3.5. South America
- 5.1. Market Analysis, Insights and Forecast - by Product Type
- 6. North America Hematology Analyzers Industry Analysis, Insights and Forecast, 2019-2031
- 6.1. Market Analysis, Insights and Forecast - by Product Type
- 6.1.1. Instruments
- 6.1.1.1. 3 Part Hematology Analyzer
- 6.1.1.2. 5 Part Hematology Analyzer
- 6.1.1.3. Point-of-care Testing Hematology Analyzers
- 6.1.1.4. Others
- 6.1.2. Reagents
- 6.1.3. Services
- 6.1.1. Instruments
- 6.2. Market Analysis, Insights and Forecast - by End User
- 6.2.1. Hospitals
- 6.2.2. Clinical Laboratories
- 6.2.3. Research Institutes
- 6.2.4. Other End Users
- 6.1. Market Analysis, Insights and Forecast - by Product Type
- 7. Europe Hematology Analyzers Industry Analysis, Insights and Forecast, 2019-2031
- 7.1. Market Analysis, Insights and Forecast - by Product Type
- 7.1.1. Instruments
- 7.1.1.1. 3 Part Hematology Analyzer
- 7.1.1.2. 5 Part Hematology Analyzer
- 7.1.1.3. Point-of-care Testing Hematology Analyzers
- 7.1.1.4. Others
- 7.1.2. Reagents
- 7.1.3. Services
- 7.1.1. Instruments
- 7.2. Market Analysis, Insights and Forecast - by End User
- 7.2.1. Hospitals
- 7.2.2. Clinical Laboratories
- 7.2.3. Research Institutes
- 7.2.4. Other End Users
- 7.1. Market Analysis, Insights and Forecast - by Product Type
- 8. Asia Pacific Hematology Analyzers Industry Analysis, Insights and Forecast, 2019-2031
- 8.1. Market Analysis, Insights and Forecast - by Product Type
- 8.1.1. Instruments
- 8.1.1.1. 3 Part Hematology Analyzer
- 8.1.1.2. 5 Part Hematology Analyzer
- 8.1.1.3. Point-of-care Testing Hematology Analyzers
- 8.1.1.4. Others
- 8.1.2. Reagents
- 8.1.3. Services
- 8.1.1. Instruments
- 8.2. Market Analysis, Insights and Forecast - by End User
- 8.2.1. Hospitals
- 8.2.2. Clinical Laboratories
- 8.2.3. Research Institutes
- 8.2.4. Other End Users
- 8.1. Market Analysis, Insights and Forecast - by Product Type
- 9. Middle East and Africa Hematology Analyzers Industry Analysis, Insights and Forecast, 2019-2031
- 9.1. Market Analysis, Insights and Forecast - by Product Type
- 9.1.1. Instruments
- 9.1.1.1. 3 Part Hematology Analyzer
- 9.1.1.2. 5 Part Hematology Analyzer
- 9.1.1.3. Point-of-care Testing Hematology Analyzers
- 9.1.1.4. Others
- 9.1.2. Reagents
- 9.1.3. Services
- 9.1.1. Instruments
- 9.2. Market Analysis, Insights and Forecast - by End User
- 9.2.1. Hospitals
- 9.2.2. Clinical Laboratories
- 9.2.3. Research Institutes
- 9.2.4. Other End Users
- 9.1. Market Analysis, Insights and Forecast - by Product Type
- 10. South America Hematology Analyzers Industry Analysis, Insights and Forecast, 2019-2031
- 10.1. Market Analysis, Insights and Forecast - by Product Type
- 10.1.1. Instruments
- 10.1.1.1. 3 Part Hematology Analyzer
- 10.1.1.2. 5 Part Hematology Analyzer
- 10.1.1.3. Point-of-care Testing Hematology Analyzers
- 10.1.1.4. Others
- 10.1.2. Reagents
- 10.1.3. Services
- 10.1.1. Instruments
- 10.2. Market Analysis, Insights and Forecast - by End User
- 10.2.1. Hospitals
- 10.2.2. Clinical Laboratories
- 10.2.3. Research Institutes
- 10.2.4. Other End Users
- 10.1. Market Analysis, Insights and Forecast - by Product Type
- 11. North America Hematology Analyzers Industry Analysis, Insights and Forecast, 2019-2031
- 11.1. Market Analysis, Insights and Forecast - By Country/Sub-region
- 11.1.1 United States
- 11.1.2 Canada
- 11.1.3 Mexico
- 12. South America Hematology Analyzers Industry Analysis, Insights and Forecast, 2019-2031
- 12.1. Market Analysis, Insights and Forecast - By Country/Sub-region
- 12.1.1 Brazil
- 12.1.2 Mexico
- 12.1.3 Rest of South America
- 13. Europe Hematology Analyzers Industry Analysis, Insights and Forecast, 2019-2031
- 13.1. Market Analysis, Insights and Forecast - By Country/Sub-region
- 13.1.1 United Kingdom
- 13.1.2 Germany
- 13.1.3 France
- 13.1.4 Italy
- 13.1.5 Spain
- 13.1.6 Russia
- 13.1.7 Rest of Europe
- 14. Asia Pacific Hematology Analyzers Industry Analysis, Insights and Forecast, 2019-2031
- 14.1. Market Analysis, Insights and Forecast - By Country/Sub-region
- 14.1.1 China
- 14.1.2 Japan
- 14.1.3 India
- 14.1.4 South Korea
- 14.1.5 Taiwan
- 14.1.6 Australia
- 14.1.7 Rest of Asia-Pacific
- 15. MEA Hematology Analyzers Industry Analysis, Insights and Forecast, 2019-2031
- 15.1. Market Analysis, Insights and Forecast - By Country/Sub-region
- 15.1.1 Middle East
- 15.1.2 Africa
- 16. Competitive Analysis
- 16.1. Global Market Share Analysis 2024
- 16.2. Company Profiles
- 16.2.1 Stratec Biomedical Systems (DIATRON)
- 16.2.1.1. Overview
- 16.2.1.2. Products
- 16.2.1.3. SWOT Analysis
- 16.2.1.4. Recent Developments
- 16.2.1.5. Financials (Based on Availability)
- 16.2.2 Horiba Ltd
- 16.2.2.1. Overview
- 16.2.2.2. Products
- 16.2.2.3. SWOT Analysis
- 16.2.2.4. Recent Developments
- 16.2.2.5. Financials (Based on Availability)
- 16.2.3 Siemens Healthineers
- 16.2.3.1. Overview
- 16.2.3.2. Products
- 16.2.3.3. SWOT Analysis
- 16.2.3.4. Recent Developments
- 16.2.3.5. Financials (Based on Availability)
- 16.2.4 Abbott Laboratories
- 16.2.4.1. Overview
- 16.2.4.2. Products
- 16.2.4.3. SWOT Analysis
- 16.2.4.4. Recent Developments
- 16.2.4.5. Financials (Based on Availability)
- 16.2.5 F Hoffmann-La Roche Ltd
- 16.2.5.1. Overview
- 16.2.5.2. Products
- 16.2.5.3. SWOT Analysis
- 16.2.5.4. Recent Developments
- 16.2.5.5. Financials (Based on Availability)
- 16.2.6 Ortho Clinical Diagnostics
- 16.2.6.1. Overview
- 16.2.6.2. Products
- 16.2.6.3. SWOT Analysis
- 16.2.6.4. Recent Developments
- 16.2.6.5. Financials (Based on Availability)
- 16.2.7 Boule Diagnostics AB
- 16.2.7.1. Overview
- 16.2.7.2. Products
- 16.2.7.3. SWOT Analysis
- 16.2.7.4. Recent Developments
- 16.2.7.5. Financials (Based on Availability)
- 16.2.8 Bio-Rad Laboratories
- 16.2.8.1. Overview
- 16.2.8.2. Products
- 16.2.8.3. SWOT Analysis
- 16.2.8.4. Recent Developments
- 16.2.8.5. Financials (Based on Availability)
- 16.2.9 Beckman Coulter Inc (Danaher Corporation)
- 16.2.9.1. Overview
- 16.2.9.2. Products
- 16.2.9.3. SWOT Analysis
- 16.2.9.4. Recent Developments
- 16.2.9.5. Financials (Based on Availability)
- 16.2.10 Sysmex Corporation
- 16.2.10.1. Overview
- 16.2.10.2. Products
- 16.2.10.3. SWOT Analysis
- 16.2.10.4. Recent Developments
- 16.2.10.5. Financials (Based on Availability)
- 16.2.11 Accurex Biomedical Pvt Ltd
- 16.2.11.1. Overview
- 16.2.11.2. Products
- 16.2.11.3. SWOT Analysis
- 16.2.11.4. Recent Developments
- 16.2.11.5. Financials (Based on Availability)
- 16.2.12 Nihon Kohden Corporation
- 16.2.12.1. Overview
- 16.2.12.2. Products
- 16.2.12.3. SWOT Analysis
- 16.2.12.4. Recent Developments
- 16.2.12.5. Financials (Based on Availability)
- 16.2.1 Stratec Biomedical Systems (DIATRON)
List of Figures
- Figure 1: Global Hematology Analyzers Industry Revenue Breakdown (Million, %) by Region 2024 & 2032
- Figure 2: Global Hematology Analyzers Industry Volume Breakdown (K Unit, %) by Region 2024 & 2032
- Figure 3: North America Hematology Analyzers Industry Revenue (Million), by Country 2024 & 2032
- Figure 4: North America Hematology Analyzers Industry Volume (K Unit), by Country 2024 & 2032
- Figure 5: North America Hematology Analyzers Industry Revenue Share (%), by Country 2024 & 2032
- Figure 6: North America Hematology Analyzers Industry Volume Share (%), by Country 2024 & 2032
- Figure 7: South America Hematology Analyzers Industry Revenue (Million), by Country 2024 & 2032
- Figure 8: South America Hematology Analyzers Industry Volume (K Unit), by Country 2024 & 2032
- Figure 9: South America Hematology Analyzers Industry Revenue Share (%), by Country 2024 & 2032
- Figure 10: South America Hematology Analyzers Industry Volume Share (%), by Country 2024 & 2032
- Figure 11: Europe Hematology Analyzers Industry Revenue (Million), by Country 2024 & 2032
- Figure 12: Europe Hematology Analyzers Industry Volume (K Unit), by Country 2024 & 2032
- Figure 13: Europe Hematology Analyzers Industry Revenue Share (%), by Country 2024 & 2032
- Figure 14: Europe Hematology Analyzers Industry Volume Share (%), by Country 2024 & 2032
- Figure 15: Asia Pacific Hematology Analyzers Industry Revenue (Million), by Country 2024 & 2032
- Figure 16: Asia Pacific Hematology Analyzers Industry Volume (K Unit), by Country 2024 & 2032
- Figure 17: Asia Pacific Hematology Analyzers Industry Revenue Share (%), by Country 2024 & 2032
- Figure 18: Asia Pacific Hematology Analyzers Industry Volume Share (%), by Country 2024 & 2032
- Figure 19: MEA Hematology Analyzers Industry Revenue (Million), by Country 2024 & 2032
- Figure 20: MEA Hematology Analyzers Industry Volume (K Unit), by Country 2024 & 2032
- Figure 21: MEA Hematology Analyzers Industry Revenue Share (%), by Country 2024 & 2032
- Figure 22: MEA Hematology Analyzers Industry Volume Share (%), by Country 2024 & 2032
- Figure 23: North America Hematology Analyzers Industry Revenue (Million), by Product Type 2024 & 2032
- Figure 24: North America Hematology Analyzers Industry Volume (K Unit), by Product Type 2024 & 2032
- Figure 25: North America Hematology Analyzers Industry Revenue Share (%), by Product Type 2024 & 2032
- Figure 26: North America Hematology Analyzers Industry Volume Share (%), by Product Type 2024 & 2032
- Figure 27: North America Hematology Analyzers Industry Revenue (Million), by End User 2024 & 2032
- Figure 28: North America Hematology Analyzers Industry Volume (K Unit), by End User 2024 & 2032
- Figure 29: North America Hematology Analyzers Industry Revenue Share (%), by End User 2024 & 2032
- Figure 30: North America Hematology Analyzers Industry Volume Share (%), by End User 2024 & 2032
- Figure 31: North America Hematology Analyzers Industry Revenue (Million), by Country 2024 & 2032
- Figure 32: North America Hematology Analyzers Industry Volume (K Unit), by Country 2024 & 2032
- Figure 33: North America Hematology Analyzers Industry Revenue Share (%), by Country 2024 & 2032
- Figure 34: North America Hematology Analyzers Industry Volume Share (%), by Country 2024 & 2032
- Figure 35: Europe Hematology Analyzers Industry Revenue (Million), by Product Type 2024 & 2032
- Figure 36: Europe Hematology Analyzers Industry Volume (K Unit), by Product Type 2024 & 2032
- Figure 37: Europe Hematology Analyzers Industry Revenue Share (%), by Product Type 2024 & 2032
- Figure 38: Europe Hematology Analyzers Industry Volume Share (%), by Product Type 2024 & 2032
- Figure 39: Europe Hematology Analyzers Industry Revenue (Million), by End User 2024 & 2032
- Figure 40: Europe Hematology Analyzers Industry Volume (K Unit), by End User 2024 & 2032
- Figure 41: Europe Hematology Analyzers Industry Revenue Share (%), by End User 2024 & 2032
- Figure 42: Europe Hematology Analyzers Industry Volume Share (%), by End User 2024 & 2032
- Figure 43: Europe Hematology Analyzers Industry Revenue (Million), by Country 2024 & 2032
- Figure 44: Europe Hematology Analyzers Industry Volume (K Unit), by Country 2024 & 2032
- Figure 45: Europe Hematology Analyzers Industry Revenue Share (%), by Country 2024 & 2032
- Figure 46: Europe Hematology Analyzers Industry Volume Share (%), by Country 2024 & 2032
- Figure 47: Asia Pacific Hematology Analyzers Industry Revenue (Million), by Product Type 2024 & 2032
- Figure 48: Asia Pacific Hematology Analyzers Industry Volume (K Unit), by Product Type 2024 & 2032
- Figure 49: Asia Pacific Hematology Analyzers Industry Revenue Share (%), by Product Type 2024 & 2032
- Figure 50: Asia Pacific Hematology Analyzers Industry Volume Share (%), by Product Type 2024 & 2032
- Figure 51: Asia Pacific Hematology Analyzers Industry Revenue (Million), by End User 2024 & 2032
- Figure 52: Asia Pacific Hematology Analyzers Industry Volume (K Unit), by End User 2024 & 2032
- Figure 53: Asia Pacific Hematology Analyzers Industry Revenue Share (%), by End User 2024 & 2032
- Figure 54: Asia Pacific Hematology Analyzers Industry Volume Share (%), by End User 2024 & 2032
- Figure 55: Asia Pacific Hematology Analyzers Industry Revenue (Million), by Country 2024 & 2032
- Figure 56: Asia Pacific Hematology Analyzers Industry Volume (K Unit), by Country 2024 & 2032
- Figure 57: Asia Pacific Hematology Analyzers Industry Revenue Share (%), by Country 2024 & 2032
- Figure 58: Asia Pacific Hematology Analyzers Industry Volume Share (%), by Country 2024 & 2032
- Figure 59: Middle East and Africa Hematology Analyzers Industry Revenue (Million), by Product Type 2024 & 2032
- Figure 60: Middle East and Africa Hematology Analyzers Industry Volume (K Unit), by Product Type 2024 & 2032
- Figure 61: Middle East and Africa Hematology Analyzers Industry Revenue Share (%), by Product Type 2024 & 2032
- Figure 62: Middle East and Africa Hematology Analyzers Industry Volume Share (%), by Product Type 2024 & 2032
- Figure 63: Middle East and Africa Hematology Analyzers Industry Revenue (Million), by End User 2024 & 2032
- Figure 64: Middle East and Africa Hematology Analyzers Industry Volume (K Unit), by End User 2024 & 2032
- Figure 65: Middle East and Africa Hematology Analyzers Industry Revenue Share (%), by End User 2024 & 2032
- Figure 66: Middle East and Africa Hematology Analyzers Industry Volume Share (%), by End User 2024 & 2032
- Figure 67: Middle East and Africa Hematology Analyzers Industry Revenue (Million), by Country 2024 & 2032
- Figure 68: Middle East and Africa Hematology Analyzers Industry Volume (K Unit), by Country 2024 & 2032
- Figure 69: Middle East and Africa Hematology Analyzers Industry Revenue Share (%), by Country 2024 & 2032
- Figure 70: Middle East and Africa Hematology Analyzers Industry Volume Share (%), by Country 2024 & 2032
- Figure 71: South America Hematology Analyzers Industry Revenue (Million), by Product Type 2024 & 2032
- Figure 72: South America Hematology Analyzers Industry Volume (K Unit), by Product Type 2024 & 2032
- Figure 73: South America Hematology Analyzers Industry Revenue Share (%), by Product Type 2024 & 2032
- Figure 74: South America Hematology Analyzers Industry Volume Share (%), by Product Type 2024 & 2032
- Figure 75: South America Hematology Analyzers Industry Revenue (Million), by End User 2024 & 2032
- Figure 76: South America Hematology Analyzers Industry Volume (K Unit), by End User 2024 & 2032
- Figure 77: South America Hematology Analyzers Industry Revenue Share (%), by End User 2024 & 2032
- Figure 78: South America Hematology Analyzers Industry Volume Share (%), by End User 2024 & 2032
- Figure 79: South America Hematology Analyzers Industry Revenue (Million), by Country 2024 & 2032
- Figure 80: South America Hematology Analyzers Industry Volume (K Unit), by Country 2024 & 2032
- Figure 81: South America Hematology Analyzers Industry Revenue Share (%), by Country 2024 & 2032
- Figure 82: South America Hematology Analyzers Industry Volume Share (%), by Country 2024 & 2032
List of Tables
- Table 1: Global Hematology Analyzers Industry Revenue Million Forecast, by Region 2019 & 2032
- Table 2: Global Hematology Analyzers Industry Volume K Unit Forecast, by Region 2019 & 2032
- Table 3: Global Hematology Analyzers Industry Revenue Million Forecast, by Product Type 2019 & 2032
- Table 4: Global Hematology Analyzers Industry Volume K Unit Forecast, by Product Type 2019 & 2032
- Table 5: Global Hematology Analyzers Industry Revenue Million Forecast, by End User 2019 & 2032
- Table 6: Global Hematology Analyzers Industry Volume K Unit Forecast, by End User 2019 & 2032
- Table 7: Global Hematology Analyzers Industry Revenue Million Forecast, by Region 2019 & 2032
- Table 8: Global Hematology Analyzers Industry Volume K Unit Forecast, by Region 2019 & 2032
- Table 9: Global Hematology Analyzers Industry Revenue Million Forecast, by Country 2019 & 2032
- Table 10: Global Hematology Analyzers Industry Volume K Unit Forecast, by Country 2019 & 2032
- Table 11: United States Hematology Analyzers Industry Revenue (Million) Forecast, by Application 2019 & 2032
- Table 12: United States Hematology Analyzers Industry Volume (K Unit) Forecast, by Application 2019 & 2032
- Table 13: Canada Hematology Analyzers Industry Revenue (Million) Forecast, by Application 2019 & 2032
- Table 14: Canada Hematology Analyzers Industry Volume (K Unit) Forecast, by Application 2019 & 2032
- Table 15: Mexico Hematology Analyzers Industry Revenue (Million) Forecast, by Application 2019 & 2032
- Table 16: Mexico Hematology Analyzers Industry Volume (K Unit) Forecast, by Application 2019 & 2032
- Table 17: Global Hematology Analyzers Industry Revenue Million Forecast, by Country 2019 & 2032
- Table 18: Global Hematology Analyzers Industry Volume K Unit Forecast, by Country 2019 & 2032
- Table 19: Brazil Hematology Analyzers Industry Revenue (Million) Forecast, by Application 2019 & 2032
- Table 20: Brazil Hematology Analyzers Industry Volume (K Unit) Forecast, by Application 2019 & 2032
- Table 21: Mexico Hematology Analyzers Industry Revenue (Million) Forecast, by Application 2019 & 2032
- Table 22: Mexico Hematology Analyzers Industry Volume (K Unit) Forecast, by Application 2019 & 2032
- Table 23: Rest of South America Hematology Analyzers Industry Revenue (Million) Forecast, by Application 2019 & 2032
- Table 24: Rest of South America Hematology Analyzers Industry Volume (K Unit) Forecast, by Application 2019 & 2032
- Table 25: Global Hematology Analyzers Industry Revenue Million Forecast, by Country 2019 & 2032
- Table 26: Global Hematology Analyzers Industry Volume K Unit Forecast, by Country 2019 & 2032
- Table 27: United Kingdom Hematology Analyzers Industry Revenue (Million) Forecast, by Application 2019 & 2032
- Table 28: United Kingdom Hematology Analyzers Industry Volume (K Unit) Forecast, by Application 2019 & 2032
- Table 29: Germany Hematology Analyzers Industry Revenue (Million) Forecast, by Application 2019 & 2032
- Table 30: Germany Hematology Analyzers Industry Volume (K Unit) Forecast, by Application 2019 & 2032
- Table 31: France Hematology Analyzers Industry Revenue (Million) Forecast, by Application 2019 & 2032
- Table 32: France Hematology Analyzers Industry Volume (K Unit) Forecast, by Application 2019 & 2032
- Table 33: Italy Hematology Analyzers Industry Revenue (Million) Forecast, by Application 2019 & 2032
- Table 34: Italy Hematology Analyzers Industry Volume (K Unit) Forecast, by Application 2019 & 2032
- Table 35: Spain Hematology Analyzers Industry Revenue (Million) Forecast, by Application 2019 & 2032
- Table 36: Spain Hematology Analyzers Industry Volume (K Unit) Forecast, by Application 2019 & 2032
- Table 37: Russia Hematology Analyzers Industry Revenue (Million) Forecast, by Application 2019 & 2032
- Table 38: Russia Hematology Analyzers Industry Volume (K Unit) Forecast, by Application 2019 & 2032
- Table 39: Rest of Europe Hematology Analyzers Industry Revenue (Million) Forecast, by Application 2019 & 2032
- Table 40: Rest of Europe Hematology Analyzers Industry Volume (K Unit) Forecast, by Application 2019 & 2032
- Table 41: Global Hematology Analyzers Industry Revenue Million Forecast, by Country 2019 & 2032
- Table 42: Global Hematology Analyzers Industry Volume K Unit Forecast, by Country 2019 & 2032
- Table 43: China Hematology Analyzers Industry Revenue (Million) Forecast, by Application 2019 & 2032
- Table 44: China Hematology Analyzers Industry Volume (K Unit) Forecast, by Application 2019 & 2032
- Table 45: Japan Hematology Analyzers Industry Revenue (Million) Forecast, by Application 2019 & 2032
- Table 46: Japan Hematology Analyzers Industry Volume (K Unit) Forecast, by Application 2019 & 2032
- Table 47: India Hematology Analyzers Industry Revenue (Million) Forecast, by Application 2019 & 2032
- Table 48: India Hematology Analyzers Industry Volume (K Unit) Forecast, by Application 2019 & 2032
- Table 49: South Korea Hematology Analyzers Industry Revenue (Million) Forecast, by Application 2019 & 2032
- Table 50: South Korea Hematology Analyzers Industry Volume (K Unit) Forecast, by Application 2019 & 2032
- Table 51: Taiwan Hematology Analyzers Industry Revenue (Million) Forecast, by Application 2019 & 2032
- Table 52: Taiwan Hematology Analyzers Industry Volume (K Unit) Forecast, by Application 2019 & 2032
- Table 53: Australia Hematology Analyzers Industry Revenue (Million) Forecast, by Application 2019 & 2032
- Table 54: Australia Hematology Analyzers Industry Volume (K Unit) Forecast, by Application 2019 & 2032
- Table 55: Rest of Asia-Pacific Hematology Analyzers Industry Revenue (Million) Forecast, by Application 2019 & 2032
- Table 56: Rest of Asia-Pacific Hematology Analyzers Industry Volume (K Unit) Forecast, by Application 2019 & 2032
- Table 57: Global Hematology Analyzers Industry Revenue Million Forecast, by Country 2019 & 2032
- Table 58: Global Hematology Analyzers Industry Volume K Unit Forecast, by Country 2019 & 2032
- Table 59: Middle East Hematology Analyzers Industry Revenue (Million) Forecast, by Application 2019 & 2032
- Table 60: Middle East Hematology Analyzers Industry Volume (K Unit) Forecast, by Application 2019 & 2032
- Table 61: Africa Hematology Analyzers Industry Revenue (Million) Forecast, by Application 2019 & 2032
- Table 62: Africa Hematology Analyzers Industry Volume (K Unit) Forecast, by Application 2019 & 2032
- Table 63: Global Hematology Analyzers Industry Revenue Million Forecast, by Product Type 2019 & 2032
- Table 64: Global Hematology Analyzers Industry Volume K Unit Forecast, by Product Type 2019 & 2032
- Table 65: Global Hematology Analyzers Industry Revenue Million Forecast, by End User 2019 & 2032
- Table 66: Global Hematology Analyzers Industry Volume K Unit Forecast, by End User 2019 & 2032
- Table 67: Global Hematology Analyzers Industry Revenue Million Forecast, by Country 2019 & 2032
- Table 68: Global Hematology Analyzers Industry Volume K Unit Forecast, by Country 2019 & 2032
- Table 69: United States Hematology Analyzers Industry Revenue (Million) Forecast, by Application 2019 & 2032
- Table 70: United States Hematology Analyzers Industry Volume (K Unit) Forecast, by Application 2019 & 2032
- Table 71: Canada Hematology Analyzers Industry Revenue (Million) Forecast, by Application 2019 & 2032
- Table 72: Canada Hematology Analyzers Industry Volume (K Unit) Forecast, by Application 2019 & 2032
- Table 73: Mexico Hematology Analyzers Industry Revenue (Million) Forecast, by Application 2019 & 2032
- Table 74: Mexico Hematology Analyzers Industry Volume (K Unit) Forecast, by Application 2019 & 2032
- Table 75: Global Hematology Analyzers Industry Revenue Million Forecast, by Product Type 2019 & 2032
- Table 76: Global Hematology Analyzers Industry Volume K Unit Forecast, by Product Type 2019 & 2032
- Table 77: Global Hematology Analyzers Industry Revenue Million Forecast, by End User 2019 & 2032
- Table 78: Global Hematology Analyzers Industry Volume K Unit Forecast, by End User 2019 & 2032
- Table 79: Global Hematology Analyzers Industry Revenue Million Forecast, by Country 2019 & 2032
- Table 80: Global Hematology Analyzers Industry Volume K Unit Forecast, by Country 2019 & 2032
- Table 81: Germany Hematology Analyzers Industry Revenue (Million) Forecast, by Application 2019 & 2032
- Table 82: Germany Hematology Analyzers Industry Volume (K Unit) Forecast, by Application 2019 & 2032
- Table 83: United Kingdom Hematology Analyzers Industry Revenue (Million) Forecast, by Application 2019 & 2032
- Table 84: United Kingdom Hematology Analyzers Industry Volume (K Unit) Forecast, by Application 2019 & 2032
- Table 85: France Hematology Analyzers Industry Revenue (Million) Forecast, by Application 2019 & 2032
- Table 86: France Hematology Analyzers Industry Volume (K Unit) Forecast, by Application 2019 & 2032
- Table 87: Italy Hematology Analyzers Industry Revenue (Million) Forecast, by Application 2019 & 2032
- Table 88: Italy Hematology Analyzers Industry Volume (K Unit) Forecast, by Application 2019 & 2032
- Table 89: Spain Hematology Analyzers Industry Revenue (Million) Forecast, by Application 2019 & 2032
- Table 90: Spain Hematology Analyzers Industry Volume (K Unit) Forecast, by Application 2019 & 2032
- Table 91: Rest of Europe Hematology Analyzers Industry Revenue (Million) Forecast, by Application 2019 & 2032
- Table 92: Rest of Europe Hematology Analyzers Industry Volume (K Unit) Forecast, by Application 2019 & 2032
- Table 93: Global Hematology Analyzers Industry Revenue Million Forecast, by Product Type 2019 & 2032
- Table 94: Global Hematology Analyzers Industry Volume K Unit Forecast, by Product Type 2019 & 2032
- Table 95: Global Hematology Analyzers Industry Revenue Million Forecast, by End User 2019 & 2032
- Table 96: Global Hematology Analyzers Industry Volume K Unit Forecast, by End User 2019 & 2032
- Table 97: Global Hematology Analyzers Industry Revenue Million Forecast, by Country 2019 & 2032
- Table 98: Global Hematology Analyzers Industry Volume K Unit Forecast, by Country 2019 & 2032
- Table 99: China Hematology Analyzers Industry Revenue (Million) Forecast, by Application 2019 & 2032
- Table 100: China Hematology Analyzers Industry Volume (K Unit) Forecast, by Application 2019 & 2032
- Table 101: Japan Hematology Analyzers Industry Revenue (Million) Forecast, by Application 2019 & 2032
- Table 102: Japan Hematology Analyzers Industry Volume (K Unit) Forecast, by Application 2019 & 2032
- Table 103: India Hematology Analyzers Industry Revenue (Million) Forecast, by Application 2019 & 2032
- Table 104: India Hematology Analyzers Industry Volume (K Unit) Forecast, by Application 2019 & 2032
- Table 105: Australia Hematology Analyzers Industry Revenue (Million) Forecast, by Application 2019 & 2032
- Table 106: Australia Hematology Analyzers Industry Volume (K Unit) Forecast, by Application 2019 & 2032
- Table 107: South Korea Hematology Analyzers Industry Revenue (Million) Forecast, by Application 2019 & 2032
- Table 108: South Korea Hematology Analyzers Industry Volume (K Unit) Forecast, by Application 2019 & 2032
- Table 109: Rest of Asia Pacific Hematology Analyzers Industry Revenue (Million) Forecast, by Application 2019 & 2032
- Table 110: Rest of Asia Pacific Hematology Analyzers Industry Volume (K Unit) Forecast, by Application 2019 & 2032
- Table 111: Global Hematology Analyzers Industry Revenue Million Forecast, by Product Type 2019 & 2032
- Table 112: Global Hematology Analyzers Industry Volume K Unit Forecast, by Product Type 2019 & 2032
- Table 113: Global Hematology Analyzers Industry Revenue Million Forecast, by End User 2019 & 2032
- Table 114: Global Hematology Analyzers Industry Volume K Unit Forecast, by End User 2019 & 2032
- Table 115: Global Hematology Analyzers Industry Revenue Million Forecast, by Country 2019 & 2032
- Table 116: Global Hematology Analyzers Industry Volume K Unit Forecast, by Country 2019 & 2032
- Table 117: GCC Hematology Analyzers Industry Revenue (Million) Forecast, by Application 2019 & 2032
- Table 118: GCC Hematology Analyzers Industry Volume (K Unit) Forecast, by Application 2019 & 2032
- Table 119: South Africa Hematology Analyzers Industry Revenue (Million) Forecast, by Application 2019 & 2032
- Table 120: South Africa Hematology Analyzers Industry Volume (K Unit) Forecast, by Application 2019 & 2032
- Table 121: Rest of Middle East and Africa Hematology Analyzers Industry Revenue (Million) Forecast, by Application 2019 & 2032
- Table 122: Rest of Middle East and Africa Hematology Analyzers Industry Volume (K Unit) Forecast, by Application 2019 & 2032
- Table 123: Global Hematology Analyzers Industry Revenue Million Forecast, by Product Type 2019 & 2032
- Table 124: Global Hematology Analyzers Industry Volume K Unit Forecast, by Product Type 2019 & 2032
- Table 125: Global Hematology Analyzers Industry Revenue Million Forecast, by End User 2019 & 2032
- Table 126: Global Hematology Analyzers Industry Volume K Unit Forecast, by End User 2019 & 2032
- Table 127: Global Hematology Analyzers Industry Revenue Million Forecast, by Country 2019 & 2032
- Table 128: Global Hematology Analyzers Industry Volume K Unit Forecast, by Country 2019 & 2032
- Table 129: Brazil Hematology Analyzers Industry Revenue (Million) Forecast, by Application 2019 & 2032
- Table 130: Brazil Hematology Analyzers Industry Volume (K Unit) Forecast, by Application 2019 & 2032
- Table 131: Argentina Hematology Analyzers Industry Revenue (Million) Forecast, by Application 2019 & 2032
- Table 132: Argentina Hematology Analyzers Industry Volume (K Unit) Forecast, by Application 2019 & 2032
- Table 133: Rest of South America Hematology Analyzers Industry Revenue (Million) Forecast, by Application 2019 & 2032
- Table 134: Rest of South America Hematology Analyzers Industry Volume (K Unit) Forecast, by Application 2019 & 2032
Frequently Asked Questions
1. What is the projected Compound Annual Growth Rate (CAGR) of the Hematology Analyzers Industry?
The projected CAGR is approximately 7.10%.
2. Which companies are prominent players in the Hematology Analyzers Industry?
Key companies in the market include Stratec Biomedical Systems (DIATRON), Horiba Ltd, Siemens Healthineers, Abbott Laboratories, F Hoffmann-La Roche Ltd, Ortho Clinical Diagnostics, Boule Diagnostics AB, Bio-Rad Laboratories, Beckman Coulter Inc (Danaher Corporation), Sysmex Corporation, Accurex Biomedical Pvt Ltd , Nihon Kohden Corporation.
3. What are the main segments of the Hematology Analyzers Industry?
The market segments include Product Type, End User.
4. Can you provide details about the market size?
The market size is estimated to be USD 6.23 Million as of 2022.
5. What are some drivers contributing to market growth?
Rising Burden of Blood Disorders; Increasing Technological Advancements and Rising Adoption Rates of Automated Hematology Instruments.
6. What are the notable trends driving market growth?
3 Part Hematology Analyzer is the Segment by Instruments Expected to Hold Significant Market Share Over the Forecast Period.
7. Are there any restraints impacting market growth?
High Cost of Hematology Analyzers; Time-consuming and Stringent Rregulatory Policies.
8. Can you provide examples of recent developments in the market?
In May 2022, Nihon Kohden India established a new hematology analyzer reagent factory.
9. What pricing options are available for accessing the report?
Pricing options include single-user, multi-user, and enterprise licenses priced at USD 4750, USD 5250, and USD 8750 respectively.
10. Is the market size provided in terms of value or volume?
The market size is provided in terms of value, measured in Million and volume, measured in K Unit.
11. Are there any specific market keywords associated with the report?
Yes, the market keyword associated with the report is "Hematology Analyzers Industry," which aids in identifying and referencing the specific market segment covered.
12. How do I determine which pricing option suits my needs best?
The pricing options vary based on user requirements and access needs. Individual users may opt for single-user licenses, while businesses requiring broader access may choose multi-user or enterprise licenses for cost-effective access to the report.
13. Are there any additional resources or data provided in the Hematology Analyzers Industry report?
While the report offers comprehensive insights, it's advisable to review the specific contents or supplementary materials provided to ascertain if additional resources or data are available.
14. How can I stay updated on further developments or reports in the Hematology Analyzers Industry?
To stay informed about further developments, trends, and reports in the Hematology Analyzers Industry, consider subscribing to industry newsletters, following relevant companies and organizations, or regularly checking reputable industry news sources and publications.
Methodology
Step 1 - Identification of Relevant Samples Size from Population Database


Step 2 - Approaches for Defining Global Market Size (Value, Volume* & Price*)

Note*: In applicable scenarios
Step 3 - Data Sources
Primary Research
- Web Analytics
- Survey Reports
- Research Institute
- Latest Research Reports
- Opinion Leaders
Secondary Research
- Annual Reports
- White Paper
- Latest Press Release
- Industry Association
- Paid Database
- Investor Presentations

Step 4 - Data Triangulation
Involves using different sources of information in order to increase the validity of a study
These sources are likely to be stakeholders in a program - participants, other researchers, program staff, other community members, and so on.
Then we put all data in single framework & apply various statistical tools to find out the dynamic on the market.
During the analysis stage, feedback from the stakeholder groups would be compared to determine areas of agreement as well as areas of divergence


