
Key Insights
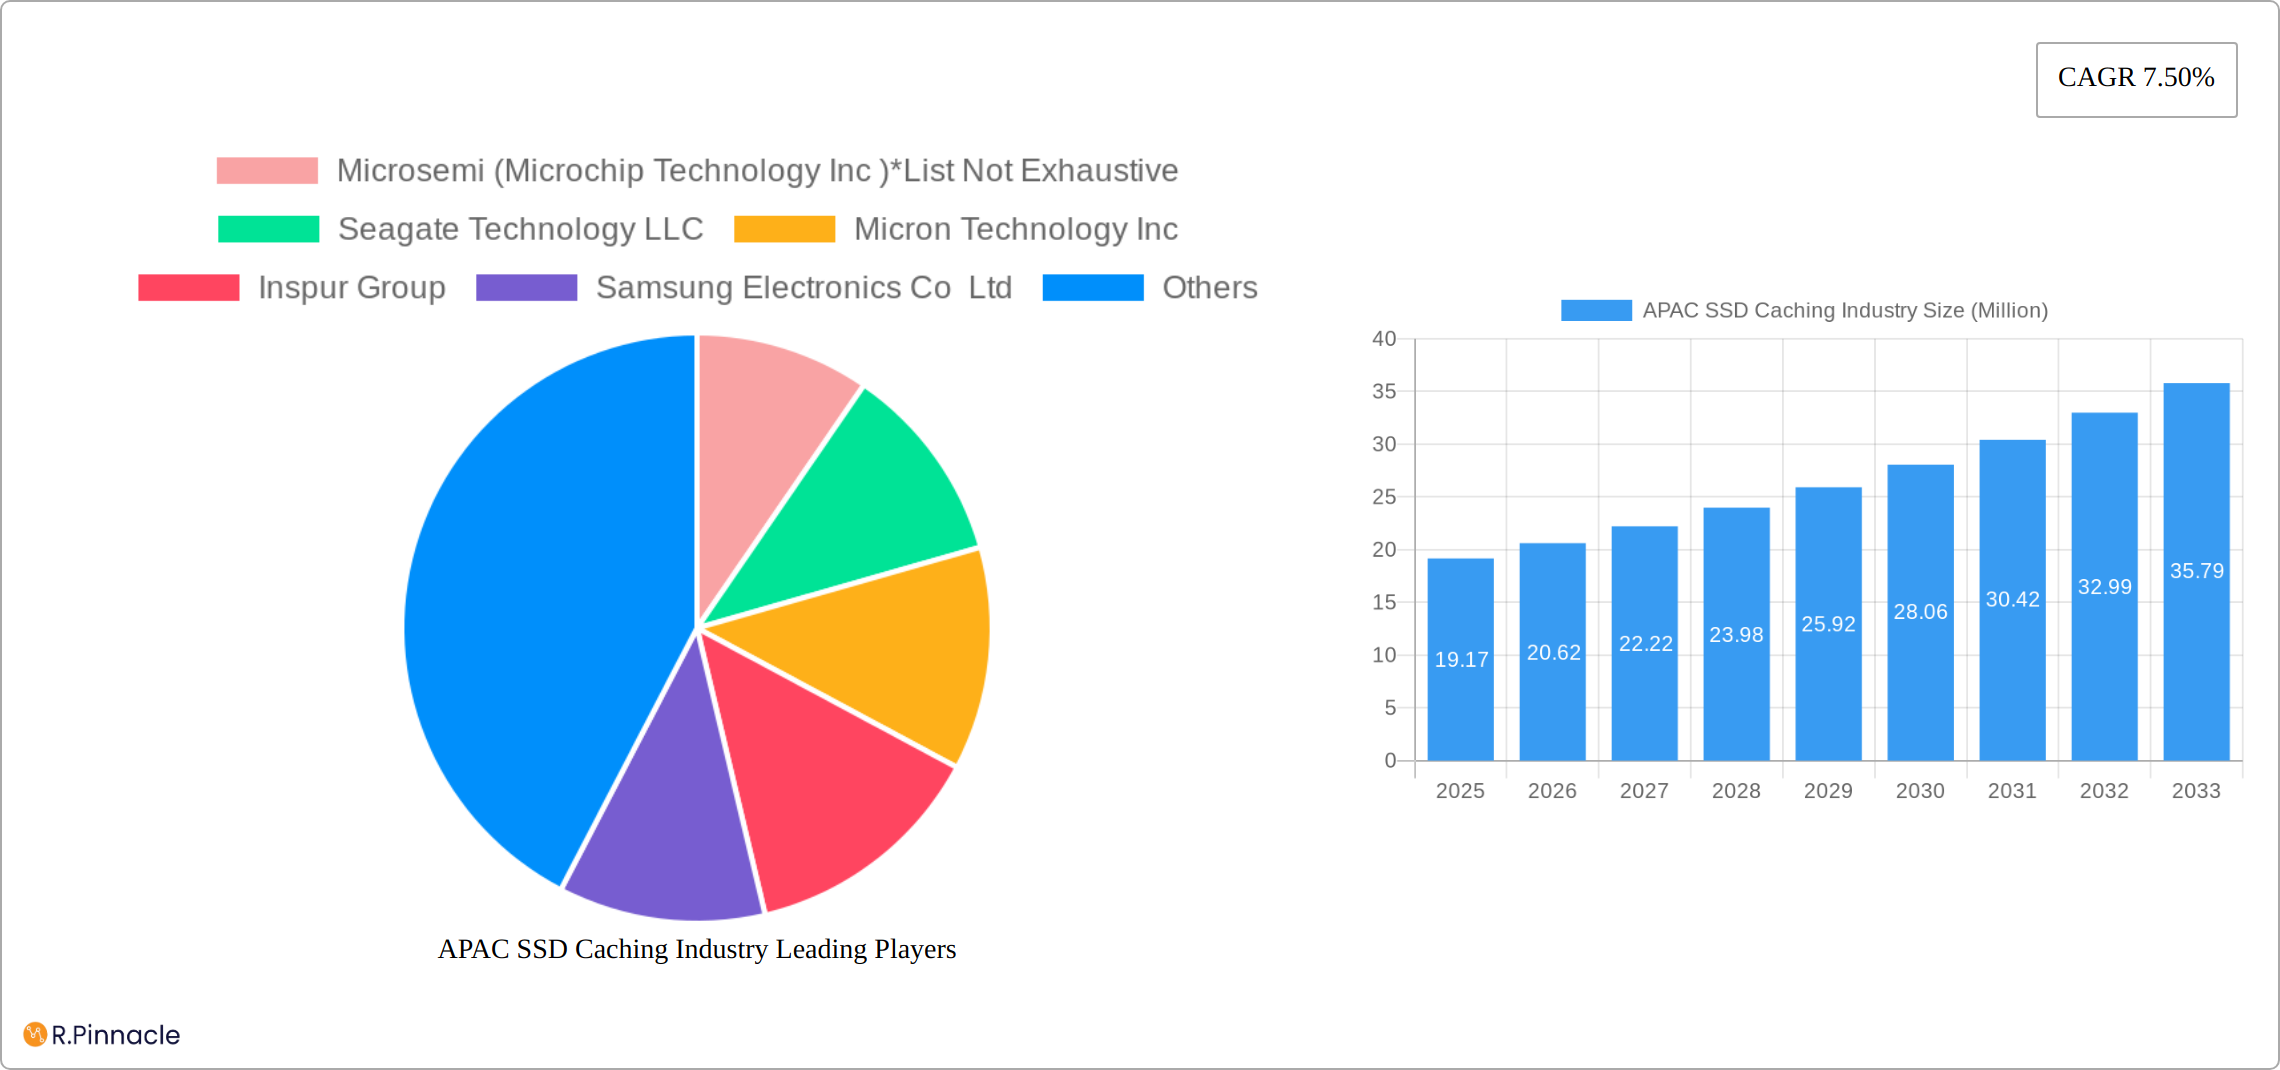
The Asia-Pacific (APAC) SSD caching market is experiencing robust growth, projected to reach \$19.17 million in 2025 and maintain a Compound Annual Growth Rate (CAGR) of 7.50% from 2025 to 2033. This expansion is driven by several key factors. The increasing adoption of cloud computing and big data analytics within enterprises necessitates faster data access speeds, making SSD caching a crucial technology for performance enhancement. Furthermore, the proliferation of data-intensive applications in sectors like finance, healthcare, and e-commerce fuels demand for high-speed storage solutions. The rising affordability of SSDs and advancements in NAND flash technology contribute to wider market penetration. Within APAC, China, Japan, South Korea, and India represent the largest markets, driven by substantial investments in IT infrastructure and the expanding digital economy. While challenges such as the initial high cost of implementation and potential data security concerns exist, these are being mitigated by technological advancements and increased awareness of the benefits of SSD caching. The competitive landscape includes major players like Seagate, Micron, Samsung, Western Digital, and others, fostering innovation and driving down costs. The market segmentation by application (enterprise and personal storage) reveals a stronger emphasis on enterprise adoption due to the higher storage needs and performance demands.
The forecast period of 2025-2033 anticipates continued growth, propelled by government initiatives promoting digital transformation across the region and the rising adoption of 5G networks which will further increase data throughput requirements. The market segmentation by country reflects the varying levels of technological adoption and economic development. China's significant investment in data centers and infrastructure positions it as a key driver of growth, while India's growing IT sector will boost demand. Japan and South Korea, already technologically advanced, will continue to see steady growth, supported by strong technological infrastructure and R&D investments. The overall growth trajectory suggests a promising future for the APAC SSD caching market, with substantial opportunities for both established players and new entrants.
APAC SSD Caching Industry Report: 2019-2033
This comprehensive report provides an in-depth analysis of the Asia-Pacific (APAC) Solid State Drive (SSD) caching industry, offering invaluable insights for industry professionals, investors, and strategic decision-makers. Covering the period from 2019 to 2033, with a focus on 2025, this report meticulously examines market dynamics, key players, and future growth prospects. The report leverages extensive data and analysis to present a clear, actionable picture of this rapidly evolving market.
APAC SSD Caching Industry Market Structure & Innovation Trends
The APAC SSD caching market exhibits a moderately concentrated structure, with key players like Samsung Electronics Co Ltd, Western Digital Corporation, and Kioxia (Toshiba Memory Corporation) holding significant market share. However, the market also features several smaller, agile players driving innovation. Market share estimates for 2025 place Samsung at approximately xx%, Western Digital at xx%, and Kioxia at xx%, with the remaining share distributed among other players. The total market size in 2025 is estimated at $xx Million. Innovation is fueled by advancements in NVMe technology, increasing demand for high-speed data storage, and the growing adoption of cloud computing. Regulatory frameworks, particularly data privacy regulations, are influencing market growth. Product substitutes, such as high-capacity HDDs with advanced caching mechanisms, pose a competitive challenge. M&A activity in the sector has seen xx Million in deals over the past five years, indicating ongoing consolidation and strategic expansion.
- Market Concentration: Moderately concentrated, with top three players holding xx% combined market share in 2025.
- Innovation Drivers: NVMe technology advancements, cloud computing adoption, and demand for high-speed storage.
- Regulatory Landscape: Data privacy regulations are increasingly influencing market dynamics.
- M&A Activity: Total deal value of approximately $xx Million over the past five years.

APAC SSD Caching Industry Market Dynamics & Trends
The APAC SSD caching market is experiencing robust growth, driven by factors such as the expanding adoption of enterprise and personal cloud storage, the proliferation of data-intensive applications (like AI and machine learning), and the increasing need for faster data access speeds. The market is projected to experience a Compound Annual Growth Rate (CAGR) of xx% from 2025 to 2033, reaching an estimated $xx Million by 2033. Technological disruptions, such as the emergence of next-generation NVMe interfaces and advancements in 3D NAND flash memory technology, are reshaping the competitive landscape. Consumer preferences are shifting towards higher storage capacities and improved performance, leading to increased demand for high-end SSD caching solutions. Market penetration in enterprise storage segments is higher compared to personal storage, but the latter segment is exhibiting faster growth.
Dominant Regions & Segments in APAC SSD Caching Industry
China currently dominates the APAC SSD caching market, driven by its massive IT infrastructure investments and thriving data center industry. This is further amplified by significant government support for technological advancements. Japan and South Korea also hold substantial market shares, due to their well-established electronics manufacturing sectors and high technology adoption rates. India is experiencing rapid growth due to increasing digitalization and investments in data infrastructure.
China:
- High IT infrastructure investments
- Strong government support for technological development
- Large and growing data center market
Japan:
- Established electronics manufacturing sector
- High technology adoption rate
South Korea:
- Advanced semiconductor industry
- Strong focus on innovation
India:
- Rapid digitalization
- Increasing investments in data infrastructure
The Enterprise Storage segment holds a larger market share compared to the Personal Storage segment, largely due to the higher storage capacity and performance requirements of enterprise applications. However, the Personal Storage segment is experiencing faster growth driven by increasing consumer demand for high-performance laptops, desktops, and gaming PCs.
APAC SSD Caching Industry Product Innovations
Recent innovations focus on increasing storage capacity, improving performance, and lowering latency. The adoption of NVMe technology is a major driver, enabling significantly faster read/write speeds compared to traditional SATA interfaces. New products are incorporating features like intelligent caching algorithms and advanced data compression techniques to optimize storage utilization and enhance overall system efficiency. These innovations are designed to cater to the growing needs of various applications, including high-performance computing, data analytics, and cloud storage.
Report Scope & Segmentation Analysis
This report segments the APAC SSD caching market by application (Enterprise Storage and Personal Storage) and by country (China, Japan, India, South Korea, and Rest of Asia Pacific). Growth projections vary across segments, with the Enterprise Storage segment showing steady growth and the Personal Storage segment demonstrating a higher CAGR. Market sizes are estimated for each segment in 2025, providing a detailed overview of the industry structure and its potential for expansion. Competitive dynamics also differ among segments, reflecting various levels of market concentration and technological innovation.
Key Drivers of APAC SSD Caching Industry Growth
The APAC SSD caching market's growth is driven by several key factors: the rapid expansion of data centers and cloud computing infrastructure, the increasing demand for high-performance computing and big data analytics, the proliferation of mobile and connected devices, and the growing adoption of NVMe technology. Government initiatives and investments in digital infrastructure across the region also contribute significantly.
Challenges in the APAP SSD Caching Industry Sector
Challenges include the high initial cost of SSD caching solutions, the volatility of raw material prices (NAND flash memory), the potential for supply chain disruptions, and intense competition from established players and new entrants. Regulatory compliance related to data security and privacy also poses a significant challenge.
Emerging Opportunities in APAC SSD Caching Industry
Emerging opportunities include the expansion of 5G networks, the growing adoption of edge computing, and the increasing demand for high-speed data storage in various sectors like healthcare, finance, and manufacturing. New markets in Southeast Asia also present significant growth potential.
Leading Players in the APAC SSD Caching Industry Market
- Microsemi (Microchip Technology Inc)
- Seagate Technology LLC
- Micron Technology Inc
- Inspur Group
- Samsung Electronics Co Ltd
- Transcend Information Inc
- Kioxia (Toshiba Memory Corporation)
- ADATA Technology Co Ltd
- Western Digital Corporation
- SK Hynix Inc
- NetApp Inc
- Intel Corporation
- QNAP Systems Inc
Key Developments in APAC SSD Caching Industry Industry
July 2023: Lenovo launched the updated ThinkSystem DM5000H, significantly expanding storage capacity (up to 23.5 PB in a cluster) and featuring NVMe SSD caching for enhanced read performance. This development enhances enterprise storage capabilities and drives adoption of high-performance SSD caching solutions.
January 2023: QNAP Systems, Inc. introduced the TS-1655, a high-capacity 2.5GbE NAS with a hybrid HDD/SSD storage architecture. This product demonstrates the market's focus on cost-effective, high-capacity solutions with enhanced performance through SSD caching.
Future Outlook for APAC SSD Caching Industry Market
The APAC SSD caching market is poised for sustained growth, fueled by the ongoing digital transformation across the region and increasing demand for high-performance, scalable storage solutions. Strategic opportunities lie in developing innovative solutions tailored to specific industry needs, expanding into emerging markets, and leveraging advancements in NVMe and other technologies to enhance product offerings. The market is expected to maintain a strong CAGR, driven by the factors outlined above, leading to significant market expansion in the coming years.
APAC SSD Caching Industry Segmentation
-
1. Application
- 1.1. Enterprise Storage
- 1.2. Personal Storage
APAC SSD Caching Industry Segmentation By Geography
-
1. North America
- 1.1. United States
- 1.2. Canada
- 1.3. Mexico
-
2. South America
- 2.1. Brazil
- 2.2. Argentina
- 2.3. Rest of South America
-
3. Europe
- 3.1. United Kingdom
- 3.2. Germany
- 3.3. France
- 3.4. Italy
- 3.5. Spain
- 3.6. Russia
- 3.7. Benelux
- 3.8. Nordics
- 3.9. Rest of Europe
-
4. Middle East & Africa
- 4.1. Turkey
- 4.2. Israel
- 4.3. GCC
- 4.4. North Africa
- 4.5. South Africa
- 4.6. Rest of Middle East & Africa
-
5. Asia Pacific
- 5.1. China
- 5.2. India
- 5.3. Japan
- 5.4. South Korea
- 5.5. ASEAN
- 5.6. Oceania
- 5.7. Rest of Asia Pacific

APAC SSD Caching Industry REPORT HIGHLIGHTS
| Aspects | Details |
|---|---|
| Study Period | 2019-2033 |
| Base Year | 2024 |
| Estimated Year | 2025 |
| Forecast Period | 2025-2033 |
| Historical Period | 2019-2024 |
| Growth Rate | CAGR of 7.50% from 2019-2033 |
| Segmentation |
|
Table of Contents
- 1. Introduction
- 1.1. Research Scope
- 1.2. Market Segmentation
- 1.3. Research Methodology
- 1.4. Definitions and Assumptions
- 2. Executive Summary
- 2.1. Introduction
- 3. Market Dynamics
- 3.1. Introduction
- 3.2. Market Drivers
- 3.2.1. Improvements Offered by SSDs Over Conventional HDDs
- 3.3. Market Restrains
- 3.3.1. Slow Pace in Development of Applications Despite Heavy investments in R&D; Commplexities in Hardware Designing
- 3.4. Market Trends
- 3.4.1. Enterprise Storage Application Segment is Expected to Hold Significant Market Share
- 4. Market Factor Analysis
- 4.1. Porters Five Forces
- 4.2. Supply/Value Chain
- 4.3. PESTEL analysis
- 4.4. Market Entropy
- 4.5. Patent/Trademark Analysis
- 5. Global APAC SSD Caching Industry Analysis, Insights and Forecast, 2019-2031
- 5.1. Market Analysis, Insights and Forecast - by Application
- 5.1.1. Enterprise Storage
- 5.1.2. Personal Storage
- 5.2. Market Analysis, Insights and Forecast - by Region
- 5.2.1. North America
- 5.2.2. South America
- 5.2.3. Europe
- 5.2.4. Middle East & Africa
- 5.2.5. Asia Pacific
- 5.1. Market Analysis, Insights and Forecast - by Application
- 6. North America APAC SSD Caching Industry Analysis, Insights and Forecast, 2019-2031
- 6.1. Market Analysis, Insights and Forecast - by Application
- 6.1.1. Enterprise Storage
- 6.1.2. Personal Storage
- 6.1. Market Analysis, Insights and Forecast - by Application
- 7. South America APAC SSD Caching Industry Analysis, Insights and Forecast, 2019-2031
- 7.1. Market Analysis, Insights and Forecast - by Application
- 7.1.1. Enterprise Storage
- 7.1.2. Personal Storage
- 7.1. Market Analysis, Insights and Forecast - by Application
- 8. Europe APAC SSD Caching Industry Analysis, Insights and Forecast, 2019-2031
- 8.1. Market Analysis, Insights and Forecast - by Application
- 8.1.1. Enterprise Storage
- 8.1.2. Personal Storage
- 8.1. Market Analysis, Insights and Forecast - by Application
- 9. Middle East & Africa APAC SSD Caching Industry Analysis, Insights and Forecast, 2019-2031
- 9.1. Market Analysis, Insights and Forecast - by Application
- 9.1.1. Enterprise Storage
- 9.1.2. Personal Storage
- 9.1. Market Analysis, Insights and Forecast - by Application
- 10. Asia Pacific APAC SSD Caching Industry Analysis, Insights and Forecast, 2019-2031
- 10.1. Market Analysis, Insights and Forecast - by Application
- 10.1.1. Enterprise Storage
- 10.1.2. Personal Storage
- 10.1. Market Analysis, Insights and Forecast - by Application
- 11. North America APAC SSD Caching Industry Analysis, Insights and Forecast, 2019-2031
- 11.1. Market Analysis, Insights and Forecast - By Country/Sub-region
- 11.1.1 United States
- 11.1.2 Canada
- 12. Europe APAC SSD Caching Industry Analysis, Insights and Forecast, 2019-2031
- 12.1. Market Analysis, Insights and Forecast - By Country/Sub-region
- 12.1.1 Germany
- 12.1.2 United Kingdom
- 12.1.3 France
- 12.1.4 Rest of Europe
- 13. Asia Pacific APAC SSD Caching Industry Analysis, Insights and Forecast, 2019-2031
- 13.1. Market Analysis, Insights and Forecast - By Country/Sub-region
- 13.1.1 China
- 13.1.2 Taiwan
- 13.1.3 South Korea
- 13.1.4 Rest of Asia Pacific
- 14. Rest of the World APAC SSD Caching Industry Analysis, Insights and Forecast, 2019-2031
- 14.1. Market Analysis, Insights and Forecast - By Country/Sub-region
- 14.1.1.
- 15. Competitive Analysis
- 15.1. Global Market Share Analysis 2024
- 15.2. Company Profiles
- 15.2.1 Microsemi (Microchip Technology Inc )*List Not Exhaustive
- 15.2.1.1. Overview
- 15.2.1.2. Products
- 15.2.1.3. SWOT Analysis
- 15.2.1.4. Recent Developments
- 15.2.1.5. Financials (Based on Availability)
- 15.2.2 Seagate Technology LLC
- 15.2.2.1. Overview
- 15.2.2.2. Products
- 15.2.2.3. SWOT Analysis
- 15.2.2.4. Recent Developments
- 15.2.2.5. Financials (Based on Availability)
- 15.2.3 Micron Technology Inc
- 15.2.3.1. Overview
- 15.2.3.2. Products
- 15.2.3.3. SWOT Analysis
- 15.2.3.4. Recent Developments
- 15.2.3.5. Financials (Based on Availability)
- 15.2.4 Inspur Group
- 15.2.4.1. Overview
- 15.2.4.2. Products
- 15.2.4.3. SWOT Analysis
- 15.2.4.4. Recent Developments
- 15.2.4.5. Financials (Based on Availability)
- 15.2.5 Samsung Electronics Co Ltd
- 15.2.5.1. Overview
- 15.2.5.2. Products
- 15.2.5.3. SWOT Analysis
- 15.2.5.4. Recent Developments
- 15.2.5.5. Financials (Based on Availability)
- 15.2.6 Transcend Information Inc
- 15.2.6.1. Overview
- 15.2.6.2. Products
- 15.2.6.3. SWOT Analysis
- 15.2.6.4. Recent Developments
- 15.2.6.5. Financials (Based on Availability)
- 15.2.7 Kioxia (Toshiba Memory Corporation)
- 15.2.7.1. Overview
- 15.2.7.2. Products
- 15.2.7.3. SWOT Analysis
- 15.2.7.4. Recent Developments
- 15.2.7.5. Financials (Based on Availability)
- 15.2.8 ADATA Technology Co Ltd
- 15.2.8.1. Overview
- 15.2.8.2. Products
- 15.2.8.3. SWOT Analysis
- 15.2.8.4. Recent Developments
- 15.2.8.5. Financials (Based on Availability)
- 15.2.9 Western Digital Corporation
- 15.2.9.1. Overview
- 15.2.9.2. Products
- 15.2.9.3. SWOT Analysis
- 15.2.9.4. Recent Developments
- 15.2.9.5. Financials (Based on Availability)
- 15.2.10 SK Hynix Inc
- 15.2.10.1. Overview
- 15.2.10.2. Products
- 15.2.10.3. SWOT Analysis
- 15.2.10.4. Recent Developments
- 15.2.10.5. Financials (Based on Availability)
- 15.2.11 NetApp Inc
- 15.2.11.1. Overview
- 15.2.11.2. Products
- 15.2.11.3. SWOT Analysis
- 15.2.11.4. Recent Developments
- 15.2.11.5. Financials (Based on Availability)
- 15.2.12 Intel Corporation
- 15.2.12.1. Overview
- 15.2.12.2. Products
- 15.2.12.3. SWOT Analysis
- 15.2.12.4. Recent Developments
- 15.2.12.5. Financials (Based on Availability)
- 15.2.13 QNAP Systems Inc
- 15.2.13.1. Overview
- 15.2.13.2. Products
- 15.2.13.3. SWOT Analysis
- 15.2.13.4. Recent Developments
- 15.2.13.5. Financials (Based on Availability)
- 15.2.1 Microsemi (Microchip Technology Inc )*List Not Exhaustive
List of Figures
- Figure 1: Global APAC SSD Caching Industry Revenue Breakdown (Million, %) by Region 2024 & 2032
- Figure 2: North America APAC SSD Caching Industry Revenue (Million), by Country 2024 & 2032
- Figure 3: North America APAC SSD Caching Industry Revenue Share (%), by Country 2024 & 2032
- Figure 4: Europe APAC SSD Caching Industry Revenue (Million), by Country 2024 & 2032
- Figure 5: Europe APAC SSD Caching Industry Revenue Share (%), by Country 2024 & 2032
- Figure 6: Asia Pacific APAC SSD Caching Industry Revenue (Million), by Country 2024 & 2032
- Figure 7: Asia Pacific APAC SSD Caching Industry Revenue Share (%), by Country 2024 & 2032
- Figure 8: Rest of the World APAC SSD Caching Industry Revenue (Million), by Country 2024 & 2032
- Figure 9: Rest of the World APAC SSD Caching Industry Revenue Share (%), by Country 2024 & 2032
- Figure 10: North America APAC SSD Caching Industry Revenue (Million), by Application 2024 & 2032
- Figure 11: North America APAC SSD Caching Industry Revenue Share (%), by Application 2024 & 2032
- Figure 12: North America APAC SSD Caching Industry Revenue (Million), by Country 2024 & 2032
- Figure 13: North America APAC SSD Caching Industry Revenue Share (%), by Country 2024 & 2032
- Figure 14: South America APAC SSD Caching Industry Revenue (Million), by Application 2024 & 2032
- Figure 15: South America APAC SSD Caching Industry Revenue Share (%), by Application 2024 & 2032
- Figure 16: South America APAC SSD Caching Industry Revenue (Million), by Country 2024 & 2032
- Figure 17: South America APAC SSD Caching Industry Revenue Share (%), by Country 2024 & 2032
- Figure 18: Europe APAC SSD Caching Industry Revenue (Million), by Application 2024 & 2032
- Figure 19: Europe APAC SSD Caching Industry Revenue Share (%), by Application 2024 & 2032
- Figure 20: Europe APAC SSD Caching Industry Revenue (Million), by Country 2024 & 2032
- Figure 21: Europe APAC SSD Caching Industry Revenue Share (%), by Country 2024 & 2032
- Figure 22: Middle East & Africa APAC SSD Caching Industry Revenue (Million), by Application 2024 & 2032
- Figure 23: Middle East & Africa APAC SSD Caching Industry Revenue Share (%), by Application 2024 & 2032
- Figure 24: Middle East & Africa APAC SSD Caching Industry Revenue (Million), by Country 2024 & 2032
- Figure 25: Middle East & Africa APAC SSD Caching Industry Revenue Share (%), by Country 2024 & 2032
- Figure 26: Asia Pacific APAC SSD Caching Industry Revenue (Million), by Application 2024 & 2032
- Figure 27: Asia Pacific APAC SSD Caching Industry Revenue Share (%), by Application 2024 & 2032
- Figure 28: Asia Pacific APAC SSD Caching Industry Revenue (Million), by Country 2024 & 2032
- Figure 29: Asia Pacific APAC SSD Caching Industry Revenue Share (%), by Country 2024 & 2032
List of Tables
- Table 1: Global APAC SSD Caching Industry Revenue Million Forecast, by Region 2019 & 2032
- Table 2: Global APAC SSD Caching Industry Revenue Million Forecast, by Application 2019 & 2032
- Table 3: Global APAC SSD Caching Industry Revenue Million Forecast, by Region 2019 & 2032
- Table 4: Global APAC SSD Caching Industry Revenue Million Forecast, by Country 2019 & 2032
- Table 5: United States APAC SSD Caching Industry Revenue (Million) Forecast, by Application 2019 & 2032
- Table 6: Canada APAC SSD Caching Industry Revenue (Million) Forecast, by Application 2019 & 2032
- Table 7: Global APAC SSD Caching Industry Revenue Million Forecast, by Country 2019 & 2032
- Table 8: Germany APAC SSD Caching Industry Revenue (Million) Forecast, by Application 2019 & 2032
- Table 9: United Kingdom APAC SSD Caching Industry Revenue (Million) Forecast, by Application 2019 & 2032
- Table 10: France APAC SSD Caching Industry Revenue (Million) Forecast, by Application 2019 & 2032
- Table 11: Rest of Europe APAC SSD Caching Industry Revenue (Million) Forecast, by Application 2019 & 2032
- Table 12: Global APAC SSD Caching Industry Revenue Million Forecast, by Country 2019 & 2032
- Table 13: China APAC SSD Caching Industry Revenue (Million) Forecast, by Application 2019 & 2032
- Table 14: Taiwan APAC SSD Caching Industry Revenue (Million) Forecast, by Application 2019 & 2032
- Table 15: South Korea APAC SSD Caching Industry Revenue (Million) Forecast, by Application 2019 & 2032
- Table 16: Rest of Asia Pacific APAC SSD Caching Industry Revenue (Million) Forecast, by Application 2019 & 2032
- Table 17: Global APAC SSD Caching Industry Revenue Million Forecast, by Country 2019 & 2032
- Table 18: APAC SSD Caching Industry Revenue (Million) Forecast, by Application 2019 & 2032
- Table 19: Global APAC SSD Caching Industry Revenue Million Forecast, by Application 2019 & 2032
- Table 20: Global APAC SSD Caching Industry Revenue Million Forecast, by Country 2019 & 2032
- Table 21: United States APAC SSD Caching Industry Revenue (Million) Forecast, by Application 2019 & 2032
- Table 22: Canada APAC SSD Caching Industry Revenue (Million) Forecast, by Application 2019 & 2032
- Table 23: Mexico APAC SSD Caching Industry Revenue (Million) Forecast, by Application 2019 & 2032
- Table 24: Global APAC SSD Caching Industry Revenue Million Forecast, by Application 2019 & 2032
- Table 25: Global APAC SSD Caching Industry Revenue Million Forecast, by Country 2019 & 2032
- Table 26: Brazil APAC SSD Caching Industry Revenue (Million) Forecast, by Application 2019 & 2032
- Table 27: Argentina APAC SSD Caching Industry Revenue (Million) Forecast, by Application 2019 & 2032
- Table 28: Rest of South America APAC SSD Caching Industry Revenue (Million) Forecast, by Application 2019 & 2032
- Table 29: Global APAC SSD Caching Industry Revenue Million Forecast, by Application 2019 & 2032
- Table 30: Global APAC SSD Caching Industry Revenue Million Forecast, by Country 2019 & 2032
- Table 31: United Kingdom APAC SSD Caching Industry Revenue (Million) Forecast, by Application 2019 & 2032
- Table 32: Germany APAC SSD Caching Industry Revenue (Million) Forecast, by Application 2019 & 2032
- Table 33: France APAC SSD Caching Industry Revenue (Million) Forecast, by Application 2019 & 2032
- Table 34: Italy APAC SSD Caching Industry Revenue (Million) Forecast, by Application 2019 & 2032
- Table 35: Spain APAC SSD Caching Industry Revenue (Million) Forecast, by Application 2019 & 2032
- Table 36: Russia APAC SSD Caching Industry Revenue (Million) Forecast, by Application 2019 & 2032
- Table 37: Benelux APAC SSD Caching Industry Revenue (Million) Forecast, by Application 2019 & 2032
- Table 38: Nordics APAC SSD Caching Industry Revenue (Million) Forecast, by Application 2019 & 2032
- Table 39: Rest of Europe APAC SSD Caching Industry Revenue (Million) Forecast, by Application 2019 & 2032
- Table 40: Global APAC SSD Caching Industry Revenue Million Forecast, by Application 2019 & 2032
- Table 41: Global APAC SSD Caching Industry Revenue Million Forecast, by Country 2019 & 2032
- Table 42: Turkey APAC SSD Caching Industry Revenue (Million) Forecast, by Application 2019 & 2032
- Table 43: Israel APAC SSD Caching Industry Revenue (Million) Forecast, by Application 2019 & 2032
- Table 44: GCC APAC SSD Caching Industry Revenue (Million) Forecast, by Application 2019 & 2032
- Table 45: North Africa APAC SSD Caching Industry Revenue (Million) Forecast, by Application 2019 & 2032
- Table 46: South Africa APAC SSD Caching Industry Revenue (Million) Forecast, by Application 2019 & 2032
- Table 47: Rest of Middle East & Africa APAC SSD Caching Industry Revenue (Million) Forecast, by Application 2019 & 2032
- Table 48: Global APAC SSD Caching Industry Revenue Million Forecast, by Application 2019 & 2032
- Table 49: Global APAC SSD Caching Industry Revenue Million Forecast, by Country 2019 & 2032
- Table 50: China APAC SSD Caching Industry Revenue (Million) Forecast, by Application 2019 & 2032
- Table 51: India APAC SSD Caching Industry Revenue (Million) Forecast, by Application 2019 & 2032
- Table 52: Japan APAC SSD Caching Industry Revenue (Million) Forecast, by Application 2019 & 2032
- Table 53: South Korea APAC SSD Caching Industry Revenue (Million) Forecast, by Application 2019 & 2032
- Table 54: ASEAN APAC SSD Caching Industry Revenue (Million) Forecast, by Application 2019 & 2032
- Table 55: Oceania APAC SSD Caching Industry Revenue (Million) Forecast, by Application 2019 & 2032
- Table 56: Rest of Asia Pacific APAC SSD Caching Industry Revenue (Million) Forecast, by Application 2019 & 2032
Frequently Asked Questions
1. What is the projected Compound Annual Growth Rate (CAGR) of the APAC SSD Caching Industry?
The projected CAGR is approximately 7.50%.
2. Which companies are prominent players in the APAC SSD Caching Industry?
Key companies in the market include Microsemi (Microchip Technology Inc )*List Not Exhaustive, Seagate Technology LLC, Micron Technology Inc, Inspur Group, Samsung Electronics Co Ltd, Transcend Information Inc, Kioxia (Toshiba Memory Corporation), ADATA Technology Co Ltd, Western Digital Corporation, SK Hynix Inc, NetApp Inc, Intel Corporation, QNAP Systems Inc.
3. What are the main segments of the APAC SSD Caching Industry?
The market segments include Application.
4. Can you provide details about the market size?
The market size is estimated to be USD 19.17 Million as of 2022.
5. What are some drivers contributing to market growth?
Improvements Offered by SSDs Over Conventional HDDs.
6. What are the notable trends driving market growth?
Enterprise Storage Application Segment is Expected to Hold Significant Market Share.
7. Are there any restraints impacting market growth?
Slow Pace in Development of Applications Despite Heavy investments in R&D; Commplexities in Hardware Designing.
8. Can you provide examples of recent developments in the market?
July 2023: Lenovo updated ThinkSystem DM5000H can scale up to 1.96 PB of raw storage capacity. A cluster of the DM5000H storage systems can scale up to 23.5 PB for NAS or up to 11.7 PB for SAN environments. The ThinkSystem DM5000H offers unified file and block storage connectivity with support for 1 GbE or 10 GbE NAS and iSCSI and 8 Gb or 16 Gb Fibre Channel protocols simultaneously. Acceleration of read-centric workloads with the high-speed, low-latency onboard NVMe SSD caching.
9. What pricing options are available for accessing the report?
Pricing options include single-user, multi-user, and enterprise licenses priced at USD 4750, USD 4950, and USD 6800 respectively.
10. Is the market size provided in terms of value or volume?
The market size is provided in terms of value, measured in Million.
11. Are there any specific market keywords associated with the report?
Yes, the market keyword associated with the report is "APAC SSD Caching Industry," which aids in identifying and referencing the specific market segment covered.
12. How do I determine which pricing option suits my needs best?
The pricing options vary based on user requirements and access needs. Individual users may opt for single-user licenses, while businesses requiring broader access may choose multi-user or enterprise licenses for cost-effective access to the report.
13. Are there any additional resources or data provided in the APAC SSD Caching Industry report?
While the report offers comprehensive insights, it's advisable to review the specific contents or supplementary materials provided to ascertain if additional resources or data are available.
14. How can I stay updated on further developments or reports in the APAC SSD Caching Industry?
To stay informed about further developments, trends, and reports in the APAC SSD Caching Industry, consider subscribing to industry newsletters, following relevant companies and organizations, or regularly checking reputable industry news sources and publications.
Methodology
Step 1 - Identification of Relevant Samples Size from Population Database


Step 2 - Approaches for Defining Global Market Size (Value, Volume* & Price*)

Note*: In applicable scenarios
Step 3 - Data Sources
Primary Research
- Web Analytics
- Survey Reports
- Research Institute
- Latest Research Reports
- Opinion Leaders
Secondary Research
- Annual Reports
- White Paper
- Latest Press Release
- Industry Association
- Paid Database
- Investor Presentations

Step 4 - Data Triangulation
Involves using different sources of information in order to increase the validity of a study
These sources are likely to be stakeholders in a program - participants, other researchers, program staff, other community members, and so on.
Then we put all data in single framework & apply various statistical tools to find out the dynamic on the market.
During the analysis stage, feedback from the stakeholder groups would be compared to determine areas of agreement as well as areas of divergence


