
Key Insights
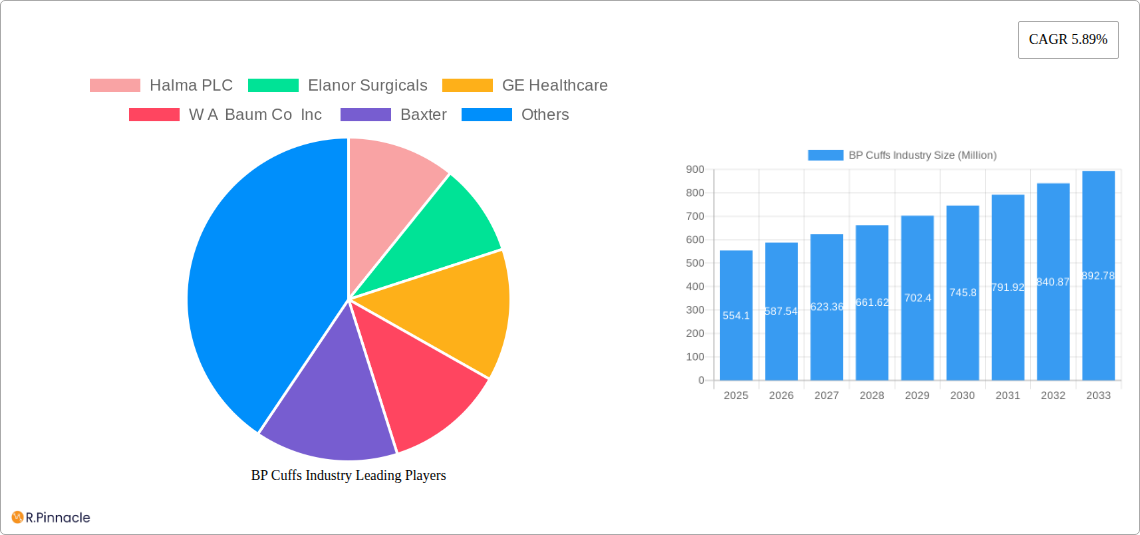
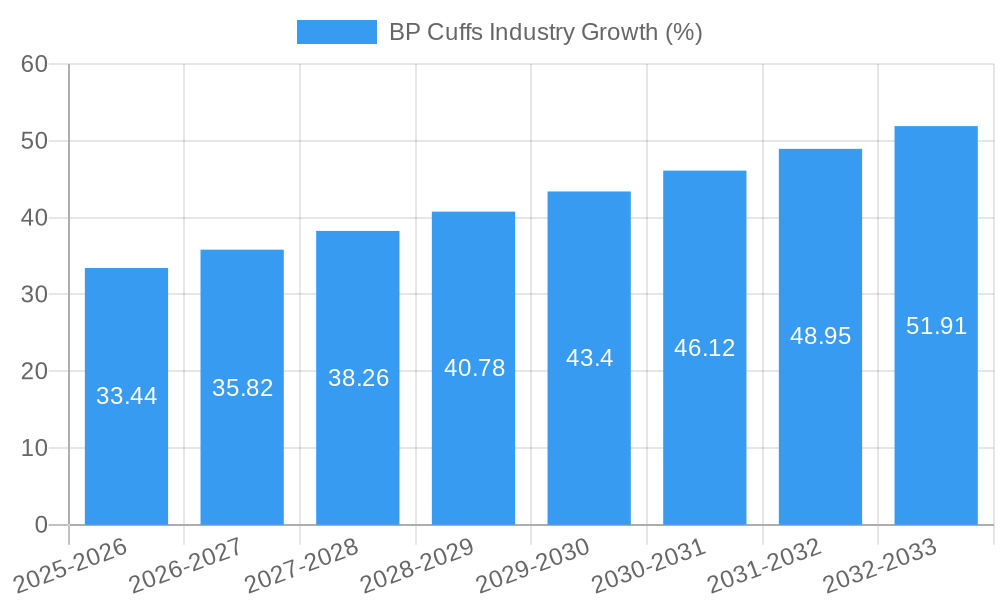
The global blood pressure (BP) cuffs market, valued at $554.10 million in 2025, is projected to experience robust growth, driven by a rising prevalence of hypertension globally and an increasing demand for accurate and reliable blood pressure monitoring devices. The market's Compound Annual Growth Rate (CAGR) of 5.89% from 2019 to 2024 suggests a continued upward trajectory through 2033. Several factors contribute to this growth. The aging global population, a significant risk factor for hypertension, fuels demand for both home and clinical BP cuffs. Technological advancements, including the development of automated and wireless BP cuffs, enhance ease of use and data management, further stimulating market expansion. The increasing integration of BP cuffs into telehealth platforms and remote patient monitoring systems adds another layer of growth potential. While the market is segmented by end-user (hospitals, clinics, other end-users), usage (reusable, disposable), and product type (manual, automated), the automated segment is expected to witness faster growth due to its convenience and improved accuracy. Competition within the market is intense, with established players like GE Healthcare, Omron Healthcare, and Philips competing alongside smaller, specialized manufacturers. Geographic expansion, particularly in emerging economies with rising healthcare infrastructure and awareness, presents significant opportunities for market participants. However, price sensitivity in certain regions and potential regulatory hurdles in some markets could present challenges to sustained growth.
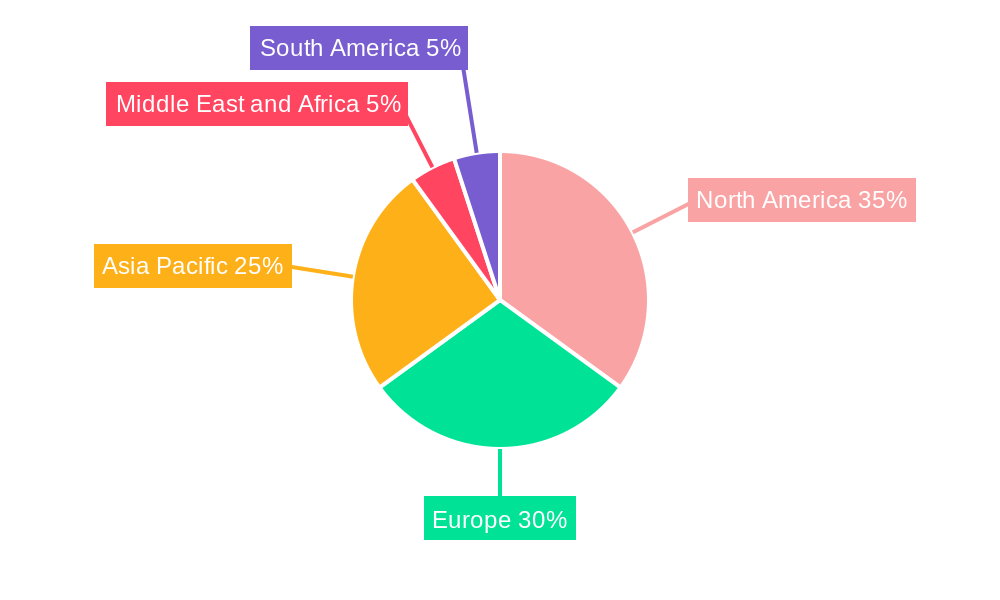
The market segmentation reveals significant opportunities. The disposable segment, driven by hygiene concerns and convenience, is likely to show strong growth, especially in clinical settings. Automated BP cuffs, offering greater accuracy and ease of use, are gaining popularity over manual cuffs, contributing significantly to the overall market expansion. North America and Europe are expected to hold substantial market shares due to high healthcare expenditure and advanced healthcare infrastructure, but the Asia-Pacific region presents a considerable growth potential driven by increasing healthcare awareness and rising disposable incomes. The competitive landscape necessitates continuous innovation and strategic partnerships to maintain a leading position within this dynamic market. Companies are focusing on product differentiation through features like enhanced accuracy, connectivity, and user-friendly interfaces.
BP Cuffs Industry Report: 2019-2033
This comprehensive report provides an in-depth analysis of the global BP Cuffs industry, offering valuable insights for industry professionals, investors, and strategic decision-makers. With a study period spanning 2019-2033, a base year of 2025, and a forecast period of 2025-2033, this report presents a detailed overview of market size, growth drivers, challenges, and future opportunities. The report utilizes data from the historical period (2019-2024) to project future trends and market dynamics. The total market value is estimated at xx Million in 2025 and projected to reach xx Million by 2033.
BP Cuffs Industry Market Structure & Innovation Trends
The BP Cuffs market is characterized by a moderately consolidated structure with key players holding significant market share. Halma PLC, GE Healthcare, Omron Healthcare Inc, and Cardinal Health are among the leading companies, collectively accounting for an estimated xx% of the market share in 2025. Market concentration is influenced by factors such as brand recognition, technological advancements, and established distribution networks. Innovation is driven by the need for improved accuracy, ease of use, and integration with telehealth platforms. Stringent regulatory frameworks governing medical devices impact market entry and product development. Substitute products, such as smartphone-based blood pressure monitoring apps, pose a competitive challenge, although their accuracy remains a concern. The end-user demographic is broad, spanning hospitals, clinics, and individual consumers. M&A activities have been moderate in recent years, with deal values totaling approximately xx Million in the past five years. Examples include (but are not limited to):
- Strategic acquisitions focusing on technology integration and expansion into new markets.
- Consolidation amongst smaller players to gain market share and improve operational efficiency.
BP Cuffs Industry Market Dynamics & Trends
The global BP Cuffs market is experiencing robust growth, driven by several factors. The rising prevalence of hypertension and cardiovascular diseases is a major catalyst, increasing the demand for accurate and reliable blood pressure monitoring devices. Technological advancements, such as the development of automated and wireless BP cuffs with integrated data analysis capabilities, are significantly improving accuracy and user convenience, fueling market growth. Consumer preferences are shifting toward user-friendly, home-based monitoring solutions, which is driving the demand for automated and connected devices. Competitive dynamics are shaped by continuous innovation, product differentiation, and strategic partnerships. The market is expected to witness a Compound Annual Growth Rate (CAGR) of xx% during the forecast period (2025-2033). Market penetration of automated BP cuffs is projected to increase from xx% in 2025 to xx% by 2033.
Dominant Regions & Segments in BP Cuffs Industry
North America currently holds the largest market share in the BP Cuffs industry, driven by factors such as high healthcare expenditure, advanced medical infrastructure, and high prevalence of hypertension.
- Key Drivers for North America: Strong regulatory environment supporting medical device innovation, well-established healthcare systems, high adoption rates of advanced technologies.
Europe is another significant market, although growth is slightly slower compared to North America. Asia-Pacific is expected to witness substantial growth driven by rising healthcare awareness and increasing disposable incomes.
- Key Segments:
- End User: Hospitals currently dominate the market, followed by clinics and other end-users (home use).
- Usage: Disposable BP cuffs are gaining popularity due to improved hygiene and convenience, although reusable cuffs remain a significant segment.
- Product Type: Automated BP cuffs are experiencing rapid growth due to accuracy and ease of use, surpassing manual BP cuffs in market share.
BP Cuffs Industry Product Innovations
Recent innovations in BP cuffs focus on enhancing accuracy, ease of use, and connectivity. Smart BP cuffs with Bluetooth capabilities allow for seamless data transfer to smartphones and health management platforms. The integration of advanced algorithms and artificial intelligence (AI) is improving diagnostic capabilities and enabling early detection of cardiovascular risks. Miniaturization and improved comfort are also key trends, enhancing patient compliance. The market is witnessing a trend towards the development of cuffs designed for specific patient populations, such as pediatric and geriatric patients.
Report Scope & Segmentation Analysis
This report segments the BP Cuffs market across several key parameters:
- End User: Hospitals, Clinics, Other End Users (Home use, etc.) Each segment demonstrates varying growth trajectories and competitive landscapes.
- Usage: Reusable and Disposable. The disposable segment is expected to show faster growth due to hygiene concerns.
- Product Type: Manual and Automated. Automated cuffs are projected to capture a larger market share due to ease of use and increased accuracy. The report provides detailed market size and growth projections for each segment.
Key Drivers of BP Cuffs Industry Growth
Several factors are driving the growth of the BP Cuffs industry:
- Rising Prevalence of Hypertension: The increasing incidence of hypertension globally is a primary driver, leading to higher demand for accurate and reliable BP monitoring devices.
- Technological Advancements: The introduction of smart and connected BP cuffs is enhancing user experience and expanding market reach.
- Government Initiatives: Support for preventive healthcare and initiatives promoting early detection of cardiovascular diseases is boosting industry growth.
Challenges in the BP Cuffs Industry Sector
The BP Cuffs industry faces certain challenges:
- Stringent Regulatory Approvals: The stringent regulatory requirements for medical devices increase the cost and time involved in product development and market entry.
- Supply Chain Disruptions: Global supply chain disruptions can impact the availability and cost of raw materials, affecting production and pricing.
- Intense Competition: The presence of numerous players with varying levels of technological capabilities and market presence creates intense competition.
Emerging Opportunities in BP Cuffs Industry
Several emerging opportunities exist in the BP Cuffs industry:
- Integration with Telehealth Platforms: The increasing adoption of telehealth creates opportunities for integrating BP cuffs with remote patient monitoring systems.
- Development of AI-powered diagnostic tools: Integrating AI into BP cuffs could enable early detection of cardiovascular risks and improve treatment outcomes.
- Expansion into Emerging Markets: Untapped markets in developing countries offer significant growth potential.
Leading Players in the BP Cuffs Industry Market
- Halma PLC
- Elanor Surgicals
- GE Healthcare
- W A Baum Co Inc
- Baxter
- Spengler SAS
- Cardinal Health
- Koninklijke Philips NV
- Omron Healthcare Inc
- Spacelabs Healthcare
- American Diagnostic Corporation
- Medline Industries Inc
Key Developments in BP Cuffs Industry Industry
- September 2022: Garmin launched a smart blood pressure monitor with adjustable cuffs.
- February 2022: Inbody introduced the new BP 170 one-touch automatic blood pressure cuff monitor.
Future Outlook for BP Cuffs Industry Market
The future of the BP Cuffs industry looks promising. Continued technological advancements, rising prevalence of hypertension, and increasing adoption of telehealth are expected to drive significant growth. Strategic partnerships, focus on product innovation, and expansion into new markets will be key success factors for industry players. The market is poised for substantial growth, with a projected xx Million increase in market value by 2033.
BP Cuffs Industry Segmentation
-
1. Usage
- 1.1. Reusable
- 1.2. Disposable
-
2. Product Type
- 2.1. Manual
- 2.2. Automated
-
3. End User
- 3.1. Hospitals
- 3.2. Clinics
- 3.3. Other End Users
BP Cuffs Industry Segmentation By Geography
-
1. North America
- 1.1. United States
- 1.2. Canada
- 1.3. Mexico
-
2. Europe
- 2.1. Germany
- 2.2. United Kingdom
- 2.3. France
- 2.4. Italy
- 2.5. Spain
- 2.6. Rest of Europe
-
3. Asia Pacific
- 3.1. China
- 3.2. Japan
- 3.3. India
- 3.4. Australia
- 3.5. South Korea
- 3.6. Rest of Asia Pacific
-
4. Middle East and Africa
- 4.1. GCC
- 4.2. South Africa
- 4.3. Rest of Middle East and Africa
-
5. South America
- 5.1. Brazil
- 5.2. Argentina
- 5.3. Rest of South America
BP Cuffs Industry REPORT HIGHLIGHTS
| Aspects | Details |
|---|---|
| Study Period | 2019-2033 |
| Base Year | 2024 |
| Estimated Year | 2025 |
| Forecast Period | 2025-2033 |
| Historical Period | 2019-2024 |
| Growth Rate | CAGR of 5.89% from 2019-2033 |
| Segmentation |
|
Table of Contents
- 1. Introduction
- 1.1. Research Scope
- 1.2. Market Segmentation
- 1.3. Research Methodology
- 1.4. Definitions and Assumptions
- 2. Executive Summary
- 2.1. Introduction
- 3. Market Dynamics
- 3.1. Introduction
- 3.2. Market Drivers
- 3.2.1. Increasing Prevalence of Hypertension; Growing Demand for Blood Monitoring Devices
- 3.3. Market Restrains
- 3.3.1. Threat of Infection from Reusable BP Cuffs
- 3.4. Market Trends
- 3.4.1. Automated Blood Pressure Cuffs Segment is Expected to Hold a Significant Market Share Over the Forecast Period
- 4. Market Factor Analysis
- 4.1. Porters Five Forces
- 4.2. Supply/Value Chain
- 4.3. PESTEL analysis
- 4.4. Market Entropy
- 4.5. Patent/Trademark Analysis
- 5. Global BP Cuffs Industry Analysis, Insights and Forecast, 2019-2031
- 5.1. Market Analysis, Insights and Forecast - by Usage
- 5.1.1. Reusable
- 5.1.2. Disposable
- 5.2. Market Analysis, Insights and Forecast - by Product Type
- 5.2.1. Manual
- 5.2.2. Automated
- 5.3. Market Analysis, Insights and Forecast - by End User
- 5.3.1. Hospitals
- 5.3.2. Clinics
- 5.3.3. Other End Users
- 5.4. Market Analysis, Insights and Forecast - by Region
- 5.4.1. North America
- 5.4.2. Europe
- 5.4.3. Asia Pacific
- 5.4.4. Middle East and Africa
- 5.4.5. South America
- 5.1. Market Analysis, Insights and Forecast - by Usage
- 6. North America BP Cuffs Industry Analysis, Insights and Forecast, 2019-2031
- 6.1. Market Analysis, Insights and Forecast - by Usage
- 6.1.1. Reusable
- 6.1.2. Disposable
- 6.2. Market Analysis, Insights and Forecast - by Product Type
- 6.2.1. Manual
- 6.2.2. Automated
- 6.3. Market Analysis, Insights and Forecast - by End User
- 6.3.1. Hospitals
- 6.3.2. Clinics
- 6.3.3. Other End Users
- 6.1. Market Analysis, Insights and Forecast - by Usage
- 7. Europe BP Cuffs Industry Analysis, Insights and Forecast, 2019-2031
- 7.1. Market Analysis, Insights and Forecast - by Usage
- 7.1.1. Reusable
- 7.1.2. Disposable
- 7.2. Market Analysis, Insights and Forecast - by Product Type
- 7.2.1. Manual
- 7.2.2. Automated
- 7.3. Market Analysis, Insights and Forecast - by End User
- 7.3.1. Hospitals
- 7.3.2. Clinics
- 7.3.3. Other End Users
- 7.1. Market Analysis, Insights and Forecast - by Usage
- 8. Asia Pacific BP Cuffs Industry Analysis, Insights and Forecast, 2019-2031
- 8.1. Market Analysis, Insights and Forecast - by Usage
- 8.1.1. Reusable
- 8.1.2. Disposable
- 8.2. Market Analysis, Insights and Forecast - by Product Type
- 8.2.1. Manual
- 8.2.2. Automated
- 8.3. Market Analysis, Insights and Forecast - by End User
- 8.3.1. Hospitals
- 8.3.2. Clinics
- 8.3.3. Other End Users
- 8.1. Market Analysis, Insights and Forecast - by Usage
- 9. Middle East and Africa BP Cuffs Industry Analysis, Insights and Forecast, 2019-2031
- 9.1. Market Analysis, Insights and Forecast - by Usage
- 9.1.1. Reusable
- 9.1.2. Disposable
- 9.2. Market Analysis, Insights and Forecast - by Product Type
- 9.2.1. Manual
- 9.2.2. Automated
- 9.3. Market Analysis, Insights and Forecast - by End User
- 9.3.1. Hospitals
- 9.3.2. Clinics
- 9.3.3. Other End Users
- 9.1. Market Analysis, Insights and Forecast - by Usage
- 10. South America BP Cuffs Industry Analysis, Insights and Forecast, 2019-2031
- 10.1. Market Analysis, Insights and Forecast - by Usage
- 10.1.1. Reusable
- 10.1.2. Disposable
- 10.2. Market Analysis, Insights and Forecast - by Product Type
- 10.2.1. Manual
- 10.2.2. Automated
- 10.3. Market Analysis, Insights and Forecast - by End User
- 10.3.1. Hospitals
- 10.3.2. Clinics
- 10.3.3. Other End Users
- 10.1. Market Analysis, Insights and Forecast - by Usage
- 11. North America BP Cuffs Industry Analysis, Insights and Forecast, 2019-2031
- 11.1. Market Analysis, Insights and Forecast - By Country/Sub-region
- 11.1.1 United States
- 11.1.2 Canada
- 11.1.3 Mexico
- 12. Europe BP Cuffs Industry Analysis, Insights and Forecast, 2019-2031
- 12.1. Market Analysis, Insights and Forecast - By Country/Sub-region
- 12.1.1 Germany
- 12.1.2 United Kingdom
- 12.1.3 France
- 12.1.4 Italy
- 12.1.5 Spain
- 12.1.6 Rest of Europe
- 13. Asia Pacific BP Cuffs Industry Analysis, Insights and Forecast, 2019-2031
- 13.1. Market Analysis, Insights and Forecast - By Country/Sub-region
- 13.1.1 China
- 13.1.2 Japan
- 13.1.3 India
- 13.1.4 Australia
- 13.1.5 South Korea
- 13.1.6 Rest of Asia Pacific
- 14. Middle East and Africa BP Cuffs Industry Analysis, Insights and Forecast, 2019-2031
- 14.1. Market Analysis, Insights and Forecast - By Country/Sub-region
- 14.1.1 GCC
- 14.1.2 South Africa
- 14.1.3 Rest of Middle East and Africa
- 15. South America BP Cuffs Industry Analysis, Insights and Forecast, 2019-2031
- 15.1. Market Analysis, Insights and Forecast - By Country/Sub-region
- 15.1.1 Brazil
- 15.1.2 Argentina
- 15.1.3 Rest of South America
- 16. Competitive Analysis
- 16.1. Global Market Share Analysis 2024
- 16.2. Company Profiles
- 16.2.1 Halma PLC
- 16.2.1.1. Overview
- 16.2.1.2. Products
- 16.2.1.3. SWOT Analysis
- 16.2.1.4. Recent Developments
- 16.2.1.5. Financials (Based on Availability)
- 16.2.2 Elanor Surgicals
- 16.2.2.1. Overview
- 16.2.2.2. Products
- 16.2.2.3. SWOT Analysis
- 16.2.2.4. Recent Developments
- 16.2.2.5. Financials (Based on Availability)
- 16.2.3 GE Healthcare
- 16.2.3.1. Overview
- 16.2.3.2. Products
- 16.2.3.3. SWOT Analysis
- 16.2.3.4. Recent Developments
- 16.2.3.5. Financials (Based on Availability)
- 16.2.4 W A Baum Co Inc
- 16.2.4.1. Overview
- 16.2.4.2. Products
- 16.2.4.3. SWOT Analysis
- 16.2.4.4. Recent Developments
- 16.2.4.5. Financials (Based on Availability)
- 16.2.5 Baxter
- 16.2.5.1. Overview
- 16.2.5.2. Products
- 16.2.5.3. SWOT Analysis
- 16.2.5.4. Recent Developments
- 16.2.5.5. Financials (Based on Availability)
- 16.2.6 Spengler SAS
- 16.2.6.1. Overview
- 16.2.6.2. Products
- 16.2.6.3. SWOT Analysis
- 16.2.6.4. Recent Developments
- 16.2.6.5. Financials (Based on Availability)
- 16.2.7 Cardinal Health
- 16.2.7.1. Overview
- 16.2.7.2. Products
- 16.2.7.3. SWOT Analysis
- 16.2.7.4. Recent Developments
- 16.2.7.5. Financials (Based on Availability)
- 16.2.8 Koninklijke Philips NV
- 16.2.8.1. Overview
- 16.2.8.2. Products
- 16.2.8.3. SWOT Analysis
- 16.2.8.4. Recent Developments
- 16.2.8.5. Financials (Based on Availability)
- 16.2.9 Omron Healthcare Inc
- 16.2.9.1. Overview
- 16.2.9.2. Products
- 16.2.9.3. SWOT Analysis
- 16.2.9.4. Recent Developments
- 16.2.9.5. Financials (Based on Availability)
- 16.2.10 Spacelabs Healthcare
- 16.2.10.1. Overview
- 16.2.10.2. Products
- 16.2.10.3. SWOT Analysis
- 16.2.10.4. Recent Developments
- 16.2.10.5. Financials (Based on Availability)
- 16.2.11 American Diagnostic Corporation
- 16.2.11.1. Overview
- 16.2.11.2. Products
- 16.2.11.3. SWOT Analysis
- 16.2.11.4. Recent Developments
- 16.2.11.5. Financials (Based on Availability)
- 16.2.12 Medline Industries Inc
- 16.2.12.1. Overview
- 16.2.12.2. Products
- 16.2.12.3. SWOT Analysis
- 16.2.12.4. Recent Developments
- 16.2.12.5. Financials (Based on Availability)
- 16.2.1 Halma PLC
List of Figures
- Figure 1: Global BP Cuffs Industry Revenue Breakdown (Million, %) by Region 2024 & 2032
- Figure 2: Global BP Cuffs Industry Volume Breakdown (K Unit, %) by Region 2024 & 2032
- Figure 3: North America BP Cuffs Industry Revenue (Million), by Country 2024 & 2032
- Figure 4: North America BP Cuffs Industry Volume (K Unit), by Country 2024 & 2032
- Figure 5: North America BP Cuffs Industry Revenue Share (%), by Country 2024 & 2032
- Figure 6: North America BP Cuffs Industry Volume Share (%), by Country 2024 & 2032
- Figure 7: Europe BP Cuffs Industry Revenue (Million), by Country 2024 & 2032
- Figure 8: Europe BP Cuffs Industry Volume (K Unit), by Country 2024 & 2032
- Figure 9: Europe BP Cuffs Industry Revenue Share (%), by Country 2024 & 2032
- Figure 10: Europe BP Cuffs Industry Volume Share (%), by Country 2024 & 2032
- Figure 11: Asia Pacific BP Cuffs Industry Revenue (Million), by Country 2024 & 2032
- Figure 12: Asia Pacific BP Cuffs Industry Volume (K Unit), by Country 2024 & 2032
- Figure 13: Asia Pacific BP Cuffs Industry Revenue Share (%), by Country 2024 & 2032
- Figure 14: Asia Pacific BP Cuffs Industry Volume Share (%), by Country 2024 & 2032
- Figure 15: Middle East and Africa BP Cuffs Industry Revenue (Million), by Country 2024 & 2032
- Figure 16: Middle East and Africa BP Cuffs Industry Volume (K Unit), by Country 2024 & 2032
- Figure 17: Middle East and Africa BP Cuffs Industry Revenue Share (%), by Country 2024 & 2032
- Figure 18: Middle East and Africa BP Cuffs Industry Volume Share (%), by Country 2024 & 2032
- Figure 19: South America BP Cuffs Industry Revenue (Million), by Country 2024 & 2032
- Figure 20: South America BP Cuffs Industry Volume (K Unit), by Country 2024 & 2032
- Figure 21: South America BP Cuffs Industry Revenue Share (%), by Country 2024 & 2032
- Figure 22: South America BP Cuffs Industry Volume Share (%), by Country 2024 & 2032
- Figure 23: North America BP Cuffs Industry Revenue (Million), by Usage 2024 & 2032
- Figure 24: North America BP Cuffs Industry Volume (K Unit), by Usage 2024 & 2032
- Figure 25: North America BP Cuffs Industry Revenue Share (%), by Usage 2024 & 2032
- Figure 26: North America BP Cuffs Industry Volume Share (%), by Usage 2024 & 2032
- Figure 27: North America BP Cuffs Industry Revenue (Million), by Product Type 2024 & 2032
- Figure 28: North America BP Cuffs Industry Volume (K Unit), by Product Type 2024 & 2032
- Figure 29: North America BP Cuffs Industry Revenue Share (%), by Product Type 2024 & 2032
- Figure 30: North America BP Cuffs Industry Volume Share (%), by Product Type 2024 & 2032
- Figure 31: North America BP Cuffs Industry Revenue (Million), by End User 2024 & 2032
- Figure 32: North America BP Cuffs Industry Volume (K Unit), by End User 2024 & 2032
- Figure 33: North America BP Cuffs Industry Revenue Share (%), by End User 2024 & 2032
- Figure 34: North America BP Cuffs Industry Volume Share (%), by End User 2024 & 2032
- Figure 35: North America BP Cuffs Industry Revenue (Million), by Country 2024 & 2032
- Figure 36: North America BP Cuffs Industry Volume (K Unit), by Country 2024 & 2032
- Figure 37: North America BP Cuffs Industry Revenue Share (%), by Country 2024 & 2032
- Figure 38: North America BP Cuffs Industry Volume Share (%), by Country 2024 & 2032
- Figure 39: Europe BP Cuffs Industry Revenue (Million), by Usage 2024 & 2032
- Figure 40: Europe BP Cuffs Industry Volume (K Unit), by Usage 2024 & 2032
- Figure 41: Europe BP Cuffs Industry Revenue Share (%), by Usage 2024 & 2032
- Figure 42: Europe BP Cuffs Industry Volume Share (%), by Usage 2024 & 2032
- Figure 43: Europe BP Cuffs Industry Revenue (Million), by Product Type 2024 & 2032
- Figure 44: Europe BP Cuffs Industry Volume (K Unit), by Product Type 2024 & 2032
- Figure 45: Europe BP Cuffs Industry Revenue Share (%), by Product Type 2024 & 2032
- Figure 46: Europe BP Cuffs Industry Volume Share (%), by Product Type 2024 & 2032
- Figure 47: Europe BP Cuffs Industry Revenue (Million), by End User 2024 & 2032
- Figure 48: Europe BP Cuffs Industry Volume (K Unit), by End User 2024 & 2032
- Figure 49: Europe BP Cuffs Industry Revenue Share (%), by End User 2024 & 2032
- Figure 50: Europe BP Cuffs Industry Volume Share (%), by End User 2024 & 2032
- Figure 51: Europe BP Cuffs Industry Revenue (Million), by Country 2024 & 2032
- Figure 52: Europe BP Cuffs Industry Volume (K Unit), by Country 2024 & 2032
- Figure 53: Europe BP Cuffs Industry Revenue Share (%), by Country 2024 & 2032
- Figure 54: Europe BP Cuffs Industry Volume Share (%), by Country 2024 & 2032
- Figure 55: Asia Pacific BP Cuffs Industry Revenue (Million), by Usage 2024 & 2032
- Figure 56: Asia Pacific BP Cuffs Industry Volume (K Unit), by Usage 2024 & 2032
- Figure 57: Asia Pacific BP Cuffs Industry Revenue Share (%), by Usage 2024 & 2032
- Figure 58: Asia Pacific BP Cuffs Industry Volume Share (%), by Usage 2024 & 2032
- Figure 59: Asia Pacific BP Cuffs Industry Revenue (Million), by Product Type 2024 & 2032
- Figure 60: Asia Pacific BP Cuffs Industry Volume (K Unit), by Product Type 2024 & 2032
- Figure 61: Asia Pacific BP Cuffs Industry Revenue Share (%), by Product Type 2024 & 2032
- Figure 62: Asia Pacific BP Cuffs Industry Volume Share (%), by Product Type 2024 & 2032
- Figure 63: Asia Pacific BP Cuffs Industry Revenue (Million), by End User 2024 & 2032
- Figure 64: Asia Pacific BP Cuffs Industry Volume (K Unit), by End User 2024 & 2032
- Figure 65: Asia Pacific BP Cuffs Industry Revenue Share (%), by End User 2024 & 2032
- Figure 66: Asia Pacific BP Cuffs Industry Volume Share (%), by End User 2024 & 2032
- Figure 67: Asia Pacific BP Cuffs Industry Revenue (Million), by Country 2024 & 2032
- Figure 68: Asia Pacific BP Cuffs Industry Volume (K Unit), by Country 2024 & 2032
- Figure 69: Asia Pacific BP Cuffs Industry Revenue Share (%), by Country 2024 & 2032
- Figure 70: Asia Pacific BP Cuffs Industry Volume Share (%), by Country 2024 & 2032
- Figure 71: Middle East and Africa BP Cuffs Industry Revenue (Million), by Usage 2024 & 2032
- Figure 72: Middle East and Africa BP Cuffs Industry Volume (K Unit), by Usage 2024 & 2032
- Figure 73: Middle East and Africa BP Cuffs Industry Revenue Share (%), by Usage 2024 & 2032
- Figure 74: Middle East and Africa BP Cuffs Industry Volume Share (%), by Usage 2024 & 2032
- Figure 75: Middle East and Africa BP Cuffs Industry Revenue (Million), by Product Type 2024 & 2032
- Figure 76: Middle East and Africa BP Cuffs Industry Volume (K Unit), by Product Type 2024 & 2032
- Figure 77: Middle East and Africa BP Cuffs Industry Revenue Share (%), by Product Type 2024 & 2032
- Figure 78: Middle East and Africa BP Cuffs Industry Volume Share (%), by Product Type 2024 & 2032
- Figure 79: Middle East and Africa BP Cuffs Industry Revenue (Million), by End User 2024 & 2032
- Figure 80: Middle East and Africa BP Cuffs Industry Volume (K Unit), by End User 2024 & 2032
- Figure 81: Middle East and Africa BP Cuffs Industry Revenue Share (%), by End User 2024 & 2032
- Figure 82: Middle East and Africa BP Cuffs Industry Volume Share (%), by End User 2024 & 2032
- Figure 83: Middle East and Africa BP Cuffs Industry Revenue (Million), by Country 2024 & 2032
- Figure 84: Middle East and Africa BP Cuffs Industry Volume (K Unit), by Country 2024 & 2032
- Figure 85: Middle East and Africa BP Cuffs Industry Revenue Share (%), by Country 2024 & 2032
- Figure 86: Middle East and Africa BP Cuffs Industry Volume Share (%), by Country 2024 & 2032
- Figure 87: South America BP Cuffs Industry Revenue (Million), by Usage 2024 & 2032
- Figure 88: South America BP Cuffs Industry Volume (K Unit), by Usage 2024 & 2032
- Figure 89: South America BP Cuffs Industry Revenue Share (%), by Usage 2024 & 2032
- Figure 90: South America BP Cuffs Industry Volume Share (%), by Usage 2024 & 2032
- Figure 91: South America BP Cuffs Industry Revenue (Million), by Product Type 2024 & 2032
- Figure 92: South America BP Cuffs Industry Volume (K Unit), by Product Type 2024 & 2032
- Figure 93: South America BP Cuffs Industry Revenue Share (%), by Product Type 2024 & 2032
- Figure 94: South America BP Cuffs Industry Volume Share (%), by Product Type 2024 & 2032
- Figure 95: South America BP Cuffs Industry Revenue (Million), by End User 2024 & 2032
- Figure 96: South America BP Cuffs Industry Volume (K Unit), by End User 2024 & 2032
- Figure 97: South America BP Cuffs Industry Revenue Share (%), by End User 2024 & 2032
- Figure 98: South America BP Cuffs Industry Volume Share (%), by End User 2024 & 2032
- Figure 99: South America BP Cuffs Industry Revenue (Million), by Country 2024 & 2032
- Figure 100: South America BP Cuffs Industry Volume (K Unit), by Country 2024 & 2032
- Figure 101: South America BP Cuffs Industry Revenue Share (%), by Country 2024 & 2032
- Figure 102: South America BP Cuffs Industry Volume Share (%), by Country 2024 & 2032
List of Tables
- Table 1: Global BP Cuffs Industry Revenue Million Forecast, by Region 2019 & 2032
- Table 2: Global BP Cuffs Industry Volume K Unit Forecast, by Region 2019 & 2032
- Table 3: Global BP Cuffs Industry Revenue Million Forecast, by Usage 2019 & 2032
- Table 4: Global BP Cuffs Industry Volume K Unit Forecast, by Usage 2019 & 2032
- Table 5: Global BP Cuffs Industry Revenue Million Forecast, by Product Type 2019 & 2032
- Table 6: Global BP Cuffs Industry Volume K Unit Forecast, by Product Type 2019 & 2032
- Table 7: Global BP Cuffs Industry Revenue Million Forecast, by End User 2019 & 2032
- Table 8: Global BP Cuffs Industry Volume K Unit Forecast, by End User 2019 & 2032
- Table 9: Global BP Cuffs Industry Revenue Million Forecast, by Region 2019 & 2032
- Table 10: Global BP Cuffs Industry Volume K Unit Forecast, by Region 2019 & 2032
- Table 11: Global BP Cuffs Industry Revenue Million Forecast, by Country 2019 & 2032
- Table 12: Global BP Cuffs Industry Volume K Unit Forecast, by Country 2019 & 2032
- Table 13: United States BP Cuffs Industry Revenue (Million) Forecast, by Application 2019 & 2032
- Table 14: United States BP Cuffs Industry Volume (K Unit) Forecast, by Application 2019 & 2032
- Table 15: Canada BP Cuffs Industry Revenue (Million) Forecast, by Application 2019 & 2032
- Table 16: Canada BP Cuffs Industry Volume (K Unit) Forecast, by Application 2019 & 2032
- Table 17: Mexico BP Cuffs Industry Revenue (Million) Forecast, by Application 2019 & 2032
- Table 18: Mexico BP Cuffs Industry Volume (K Unit) Forecast, by Application 2019 & 2032
- Table 19: Global BP Cuffs Industry Revenue Million Forecast, by Country 2019 & 2032
- Table 20: Global BP Cuffs Industry Volume K Unit Forecast, by Country 2019 & 2032
- Table 21: Germany BP Cuffs Industry Revenue (Million) Forecast, by Application 2019 & 2032
- Table 22: Germany BP Cuffs Industry Volume (K Unit) Forecast, by Application 2019 & 2032
- Table 23: United Kingdom BP Cuffs Industry Revenue (Million) Forecast, by Application 2019 & 2032
- Table 24: United Kingdom BP Cuffs Industry Volume (K Unit) Forecast, by Application 2019 & 2032
- Table 25: France BP Cuffs Industry Revenue (Million) Forecast, by Application 2019 & 2032
- Table 26: France BP Cuffs Industry Volume (K Unit) Forecast, by Application 2019 & 2032
- Table 27: Italy BP Cuffs Industry Revenue (Million) Forecast, by Application 2019 & 2032
- Table 28: Italy BP Cuffs Industry Volume (K Unit) Forecast, by Application 2019 & 2032
- Table 29: Spain BP Cuffs Industry Revenue (Million) Forecast, by Application 2019 & 2032
- Table 30: Spain BP Cuffs Industry Volume (K Unit) Forecast, by Application 2019 & 2032
- Table 31: Rest of Europe BP Cuffs Industry Revenue (Million) Forecast, by Application 2019 & 2032
- Table 32: Rest of Europe BP Cuffs Industry Volume (K Unit) Forecast, by Application 2019 & 2032
- Table 33: Global BP Cuffs Industry Revenue Million Forecast, by Country 2019 & 2032
- Table 34: Global BP Cuffs Industry Volume K Unit Forecast, by Country 2019 & 2032
- Table 35: China BP Cuffs Industry Revenue (Million) Forecast, by Application 2019 & 2032
- Table 36: China BP Cuffs Industry Volume (K Unit) Forecast, by Application 2019 & 2032
- Table 37: Japan BP Cuffs Industry Revenue (Million) Forecast, by Application 2019 & 2032
- Table 38: Japan BP Cuffs Industry Volume (K Unit) Forecast, by Application 2019 & 2032
- Table 39: India BP Cuffs Industry Revenue (Million) Forecast, by Application 2019 & 2032
- Table 40: India BP Cuffs Industry Volume (K Unit) Forecast, by Application 2019 & 2032
- Table 41: Australia BP Cuffs Industry Revenue (Million) Forecast, by Application 2019 & 2032
- Table 42: Australia BP Cuffs Industry Volume (K Unit) Forecast, by Application 2019 & 2032
- Table 43: South Korea BP Cuffs Industry Revenue (Million) Forecast, by Application 2019 & 2032
- Table 44: South Korea BP Cuffs Industry Volume (K Unit) Forecast, by Application 2019 & 2032
- Table 45: Rest of Asia Pacific BP Cuffs Industry Revenue (Million) Forecast, by Application 2019 & 2032
- Table 46: Rest of Asia Pacific BP Cuffs Industry Volume (K Unit) Forecast, by Application 2019 & 2032
- Table 47: Global BP Cuffs Industry Revenue Million Forecast, by Country 2019 & 2032
- Table 48: Global BP Cuffs Industry Volume K Unit Forecast, by Country 2019 & 2032
- Table 49: GCC BP Cuffs Industry Revenue (Million) Forecast, by Application 2019 & 2032
- Table 50: GCC BP Cuffs Industry Volume (K Unit) Forecast, by Application 2019 & 2032
- Table 51: South Africa BP Cuffs Industry Revenue (Million) Forecast, by Application 2019 & 2032
- Table 52: South Africa BP Cuffs Industry Volume (K Unit) Forecast, by Application 2019 & 2032
- Table 53: Rest of Middle East and Africa BP Cuffs Industry Revenue (Million) Forecast, by Application 2019 & 2032
- Table 54: Rest of Middle East and Africa BP Cuffs Industry Volume (K Unit) Forecast, by Application 2019 & 2032
- Table 55: Global BP Cuffs Industry Revenue Million Forecast, by Country 2019 & 2032
- Table 56: Global BP Cuffs Industry Volume K Unit Forecast, by Country 2019 & 2032
- Table 57: Brazil BP Cuffs Industry Revenue (Million) Forecast, by Application 2019 & 2032
- Table 58: Brazil BP Cuffs Industry Volume (K Unit) Forecast, by Application 2019 & 2032
- Table 59: Argentina BP Cuffs Industry Revenue (Million) Forecast, by Application 2019 & 2032
- Table 60: Argentina BP Cuffs Industry Volume (K Unit) Forecast, by Application 2019 & 2032
- Table 61: Rest of South America BP Cuffs Industry Revenue (Million) Forecast, by Application 2019 & 2032
- Table 62: Rest of South America BP Cuffs Industry Volume (K Unit) Forecast, by Application 2019 & 2032
- Table 63: Global BP Cuffs Industry Revenue Million Forecast, by Usage 2019 & 2032
- Table 64: Global BP Cuffs Industry Volume K Unit Forecast, by Usage 2019 & 2032
- Table 65: Global BP Cuffs Industry Revenue Million Forecast, by Product Type 2019 & 2032
- Table 66: Global BP Cuffs Industry Volume K Unit Forecast, by Product Type 2019 & 2032
- Table 67: Global BP Cuffs Industry Revenue Million Forecast, by End User 2019 & 2032
- Table 68: Global BP Cuffs Industry Volume K Unit Forecast, by End User 2019 & 2032
- Table 69: Global BP Cuffs Industry Revenue Million Forecast, by Country 2019 & 2032
- Table 70: Global BP Cuffs Industry Volume K Unit Forecast, by Country 2019 & 2032
- Table 71: United States BP Cuffs Industry Revenue (Million) Forecast, by Application 2019 & 2032
- Table 72: United States BP Cuffs Industry Volume (K Unit) Forecast, by Application 2019 & 2032
- Table 73: Canada BP Cuffs Industry Revenue (Million) Forecast, by Application 2019 & 2032
- Table 74: Canada BP Cuffs Industry Volume (K Unit) Forecast, by Application 2019 & 2032
- Table 75: Mexico BP Cuffs Industry Revenue (Million) Forecast, by Application 2019 & 2032
- Table 76: Mexico BP Cuffs Industry Volume (K Unit) Forecast, by Application 2019 & 2032
- Table 77: Global BP Cuffs Industry Revenue Million Forecast, by Usage 2019 & 2032
- Table 78: Global BP Cuffs Industry Volume K Unit Forecast, by Usage 2019 & 2032
- Table 79: Global BP Cuffs Industry Revenue Million Forecast, by Product Type 2019 & 2032
- Table 80: Global BP Cuffs Industry Volume K Unit Forecast, by Product Type 2019 & 2032
- Table 81: Global BP Cuffs Industry Revenue Million Forecast, by End User 2019 & 2032
- Table 82: Global BP Cuffs Industry Volume K Unit Forecast, by End User 2019 & 2032
- Table 83: Global BP Cuffs Industry Revenue Million Forecast, by Country 2019 & 2032
- Table 84: Global BP Cuffs Industry Volume K Unit Forecast, by Country 2019 & 2032
- Table 85: Germany BP Cuffs Industry Revenue (Million) Forecast, by Application 2019 & 2032
- Table 86: Germany BP Cuffs Industry Volume (K Unit) Forecast, by Application 2019 & 2032
- Table 87: United Kingdom BP Cuffs Industry Revenue (Million) Forecast, by Application 2019 & 2032
- Table 88: United Kingdom BP Cuffs Industry Volume (K Unit) Forecast, by Application 2019 & 2032
- Table 89: France BP Cuffs Industry Revenue (Million) Forecast, by Application 2019 & 2032
- Table 90: France BP Cuffs Industry Volume (K Unit) Forecast, by Application 2019 & 2032
- Table 91: Italy BP Cuffs Industry Revenue (Million) Forecast, by Application 2019 & 2032
- Table 92: Italy BP Cuffs Industry Volume (K Unit) Forecast, by Application 2019 & 2032
- Table 93: Spain BP Cuffs Industry Revenue (Million) Forecast, by Application 2019 & 2032
- Table 94: Spain BP Cuffs Industry Volume (K Unit) Forecast, by Application 2019 & 2032
- Table 95: Rest of Europe BP Cuffs Industry Revenue (Million) Forecast, by Application 2019 & 2032
- Table 96: Rest of Europe BP Cuffs Industry Volume (K Unit) Forecast, by Application 2019 & 2032
- Table 97: Global BP Cuffs Industry Revenue Million Forecast, by Usage 2019 & 2032
- Table 98: Global BP Cuffs Industry Volume K Unit Forecast, by Usage 2019 & 2032
- Table 99: Global BP Cuffs Industry Revenue Million Forecast, by Product Type 2019 & 2032
- Table 100: Global BP Cuffs Industry Volume K Unit Forecast, by Product Type 2019 & 2032
- Table 101: Global BP Cuffs Industry Revenue Million Forecast, by End User 2019 & 2032
- Table 102: Global BP Cuffs Industry Volume K Unit Forecast, by End User 2019 & 2032
- Table 103: Global BP Cuffs Industry Revenue Million Forecast, by Country 2019 & 2032
- Table 104: Global BP Cuffs Industry Volume K Unit Forecast, by Country 2019 & 2032
- Table 105: China BP Cuffs Industry Revenue (Million) Forecast, by Application 2019 & 2032
- Table 106: China BP Cuffs Industry Volume (K Unit) Forecast, by Application 2019 & 2032
- Table 107: Japan BP Cuffs Industry Revenue (Million) Forecast, by Application 2019 & 2032
- Table 108: Japan BP Cuffs Industry Volume (K Unit) Forecast, by Application 2019 & 2032
- Table 109: India BP Cuffs Industry Revenue (Million) Forecast, by Application 2019 & 2032
- Table 110: India BP Cuffs Industry Volume (K Unit) Forecast, by Application 2019 & 2032
- Table 111: Australia BP Cuffs Industry Revenue (Million) Forecast, by Application 2019 & 2032
- Table 112: Australia BP Cuffs Industry Volume (K Unit) Forecast, by Application 2019 & 2032
- Table 113: South Korea BP Cuffs Industry Revenue (Million) Forecast, by Application 2019 & 2032
- Table 114: South Korea BP Cuffs Industry Volume (K Unit) Forecast, by Application 2019 & 2032
- Table 115: Rest of Asia Pacific BP Cuffs Industry Revenue (Million) Forecast, by Application 2019 & 2032
- Table 116: Rest of Asia Pacific BP Cuffs Industry Volume (K Unit) Forecast, by Application 2019 & 2032
- Table 117: Global BP Cuffs Industry Revenue Million Forecast, by Usage 2019 & 2032
- Table 118: Global BP Cuffs Industry Volume K Unit Forecast, by Usage 2019 & 2032
- Table 119: Global BP Cuffs Industry Revenue Million Forecast, by Product Type 2019 & 2032
- Table 120: Global BP Cuffs Industry Volume K Unit Forecast, by Product Type 2019 & 2032
- Table 121: Global BP Cuffs Industry Revenue Million Forecast, by End User 2019 & 2032
- Table 122: Global BP Cuffs Industry Volume K Unit Forecast, by End User 2019 & 2032
- Table 123: Global BP Cuffs Industry Revenue Million Forecast, by Country 2019 & 2032
- Table 124: Global BP Cuffs Industry Volume K Unit Forecast, by Country 2019 & 2032
- Table 125: GCC BP Cuffs Industry Revenue (Million) Forecast, by Application 2019 & 2032
- Table 126: GCC BP Cuffs Industry Volume (K Unit) Forecast, by Application 2019 & 2032
- Table 127: South Africa BP Cuffs Industry Revenue (Million) Forecast, by Application 2019 & 2032
- Table 128: South Africa BP Cuffs Industry Volume (K Unit) Forecast, by Application 2019 & 2032
- Table 129: Rest of Middle East and Africa BP Cuffs Industry Revenue (Million) Forecast, by Application 2019 & 2032
- Table 130: Rest of Middle East and Africa BP Cuffs Industry Volume (K Unit) Forecast, by Application 2019 & 2032
- Table 131: Global BP Cuffs Industry Revenue Million Forecast, by Usage 2019 & 2032
- Table 132: Global BP Cuffs Industry Volume K Unit Forecast, by Usage 2019 & 2032
- Table 133: Global BP Cuffs Industry Revenue Million Forecast, by Product Type 2019 & 2032
- Table 134: Global BP Cuffs Industry Volume K Unit Forecast, by Product Type 2019 & 2032
- Table 135: Global BP Cuffs Industry Revenue Million Forecast, by End User 2019 & 2032
- Table 136: Global BP Cuffs Industry Volume K Unit Forecast, by End User 2019 & 2032
- Table 137: Global BP Cuffs Industry Revenue Million Forecast, by Country 2019 & 2032
- Table 138: Global BP Cuffs Industry Volume K Unit Forecast, by Country 2019 & 2032
- Table 139: Brazil BP Cuffs Industry Revenue (Million) Forecast, by Application 2019 & 2032
- Table 140: Brazil BP Cuffs Industry Volume (K Unit) Forecast, by Application 2019 & 2032
- Table 141: Argentina BP Cuffs Industry Revenue (Million) Forecast, by Application 2019 & 2032
- Table 142: Argentina BP Cuffs Industry Volume (K Unit) Forecast, by Application 2019 & 2032
- Table 143: Rest of South America BP Cuffs Industry Revenue (Million) Forecast, by Application 2019 & 2032
- Table 144: Rest of South America BP Cuffs Industry Volume (K Unit) Forecast, by Application 2019 & 2032
Frequently Asked Questions
1. What is the projected Compound Annual Growth Rate (CAGR) of the BP Cuffs Industry?
The projected CAGR is approximately 5.89%.
2. Which companies are prominent players in the BP Cuffs Industry?
Key companies in the market include Halma PLC, Elanor Surgicals, GE Healthcare, W A Baum Co Inc , Baxter, Spengler SAS, Cardinal Health, Koninklijke Philips NV, Omron Healthcare Inc, Spacelabs Healthcare, American Diagnostic Corporation, Medline Industries Inc.
3. What are the main segments of the BP Cuffs Industry?
The market segments include Usage, Product Type, End User.
4. Can you provide details about the market size?
The market size is estimated to be USD 554.10 Million as of 2022.
5. What are some drivers contributing to market growth?
Increasing Prevalence of Hypertension; Growing Demand for Blood Monitoring Devices.
6. What are the notable trends driving market growth?
Automated Blood Pressure Cuffs Segment is Expected to Hold a Significant Market Share Over the Forecast Period.
7. Are there any restraints impacting market growth?
Threat of Infection from Reusable BP Cuffs.
8. Can you provide examples of recent developments in the market?
In September 2022, Garmin launched a smart blood pressure monitor with adjustable cuffs which allows users to measure systolic and diastolic blood pressure at home and on the go.
9. What pricing options are available for accessing the report?
Pricing options include single-user, multi-user, and enterprise licenses priced at USD 4750, USD 5250, and USD 8750 respectively.
10. Is the market size provided in terms of value or volume?
The market size is provided in terms of value, measured in Million and volume, measured in K Unit.
11. Are there any specific market keywords associated with the report?
Yes, the market keyword associated with the report is "BP Cuffs Industry," which aids in identifying and referencing the specific market segment covered.
12. How do I determine which pricing option suits my needs best?
The pricing options vary based on user requirements and access needs. Individual users may opt for single-user licenses, while businesses requiring broader access may choose multi-user or enterprise licenses for cost-effective access to the report.
13. Are there any additional resources or data provided in the BP Cuffs Industry report?
While the report offers comprehensive insights, it's advisable to review the specific contents or supplementary materials provided to ascertain if additional resources or data are available.
14. How can I stay updated on further developments or reports in the BP Cuffs Industry?
To stay informed about further developments, trends, and reports in the BP Cuffs Industry, consider subscribing to industry newsletters, following relevant companies and organizations, or regularly checking reputable industry news sources and publications.
Methodology
Step 1 - Identification of Relevant Samples Size from Population Database


Step 2 - Approaches for Defining Global Market Size (Value, Volume* & Price*)

Note*: In applicable scenarios
Step 3 - Data Sources
Primary Research
- Web Analytics
- Survey Reports
- Research Institute
- Latest Research Reports
- Opinion Leaders
Secondary Research
- Annual Reports
- White Paper
- Latest Press Release
- Industry Association
- Paid Database
- Investor Presentations

Step 4 - Data Triangulation
Involves using different sources of information in order to increase the validity of a study
These sources are likely to be stakeholders in a program - participants, other researchers, program staff, other community members, and so on.
Then we put all data in single framework & apply various statistical tools to find out the dynamic on the market.
During the analysis stage, feedback from the stakeholder groups would be compared to determine areas of agreement as well as areas of divergence


