
Key Insights
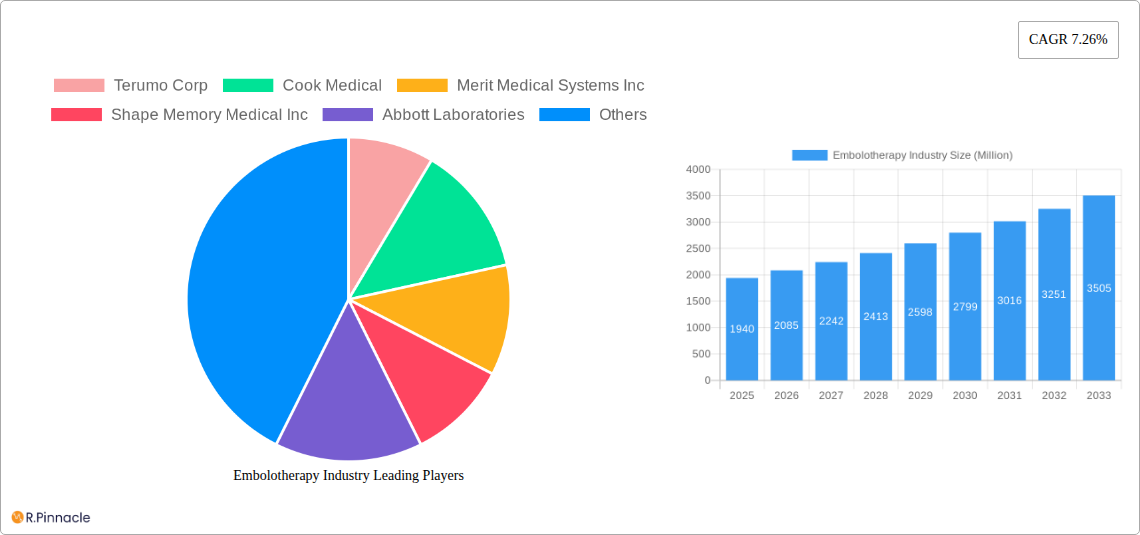
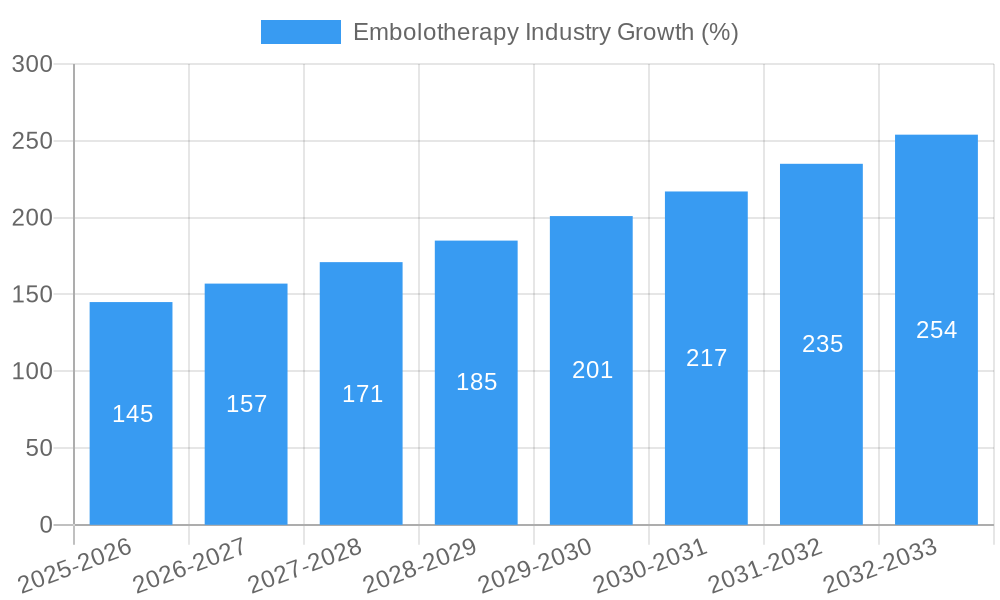
The global embolization therapy market, valued at $1.94 billion in 2025, is projected to experience robust growth, driven by a rising prevalence of cardiovascular diseases, an aging global population, and advancements in minimally invasive procedures. The 7.26% CAGR from 2025 to 2033 indicates a significant expansion, with coiling devices dominating the embolization technique segment due to their efficacy and widespread adoption. Peripheral vascular disease is currently the largest application area, followed by oncology and neurology, reflecting the diverse therapeutic applications of embolization. Technological innovations, such as the development of biocompatible and biodegradable embolic agents, are expected to further propel market growth. However, potential restraints include the relatively high cost of procedures, the need for specialized expertise, and the risk of complications associated with embolization. The market is highly competitive, with key players including Terumo, Cook Medical, Merit Medical, and Abbott, constantly striving to enhance product portfolios and expand their market share through strategic partnerships and acquisitions. Geographic expansion, particularly in emerging economies with rising healthcare infrastructure and awareness, presents significant growth opportunities.
Further analysis suggests a shift towards minimally invasive procedures in various medical specialties. This trend significantly benefits the embolization therapy market as it reduces patient recovery time and improves overall outcomes. The increasing adoption of advanced imaging techniques, such as CT scans and MRI, also plays a crucial role in improving the accuracy of embolization procedures, further driving market growth. While the precise breakdown of segmental revenue isn't provided, based on market trends, we can reasonably project that the oncology and neurology segments will show particularly strong growth rates over the forecast period, driven by increasing incidences of related diseases and advancements in targeted therapies utilizing embolization techniques. Competition among established players is intense, and new entrants will likely need to focus on innovation and specialized applications to gain market share.
Embolotherapy Industry Report: 2019-2033 Market Analysis & Forecast
This comprehensive report provides a detailed analysis of the Embolotherapy industry, projecting a market valued at xx Million by 2033. It offers actionable insights for industry professionals, investors, and stakeholders seeking to navigate this dynamic market. The report covers the period from 2019 to 2033, with 2025 as the base and estimated year.
Embolotherapy Industry Market Structure & Innovation Trends
The global embolization market is moderately concentrated, with key players like Terumo Corp, Cook Medical, Merit Medical Systems Inc, and Boston Scientific Corporation holding significant market share. The exact market share percentages are detailed within the full report. Innovation is driven by advancements in device design, materials science (leading to improved biocompatibility and efficacy), and minimally invasive techniques. Regulatory frameworks, such as those set by the FDA, significantly influence product development and market access. The industry witnesses frequent mergers and acquisitions (M&A) activities, with deal values ranging from xx Million to xx Million in recent years, primarily driven by strategic expansion and technological integration. Product substitutes, such as surgical interventions, exist but are often less favorable due to invasiveness or other limitations. The end-user demographic predominantly includes hospitals, interventional radiology centers, and specialized clinics.
- Market Concentration: Moderately concentrated with top players holding significant share.
- Innovation Drivers: Advancements in device design, materials, and minimally invasive procedures.
- Regulatory Framework: FDA approvals and international regulatory standards shape market dynamics.
- M&A Activity: Significant activity with deals valued in the tens to hundreds of Millions.
- End-User Demographics: Primarily hospitals, specialized clinics, and interventional radiology centers.
Embolotherapy Industry Market Dynamics & Trends
The embolization market exhibits a robust CAGR of xx% during the forecast period (2025-2033), driven by an increasing prevalence of target conditions like peripheral vascular disease and oncology. Technological disruptions, such as the introduction of novel embolic agents and improved imaging techniques, are fueling market growth. Consumer preferences are shifting towards minimally invasive procedures with reduced recovery times and improved patient outcomes. The competitive landscape is characterized by intense rivalry amongst established players and emerging companies, leading to continuous innovation and price competition. Market penetration is increasing in developing economies due to rising healthcare spending and improved access to advanced medical technologies.
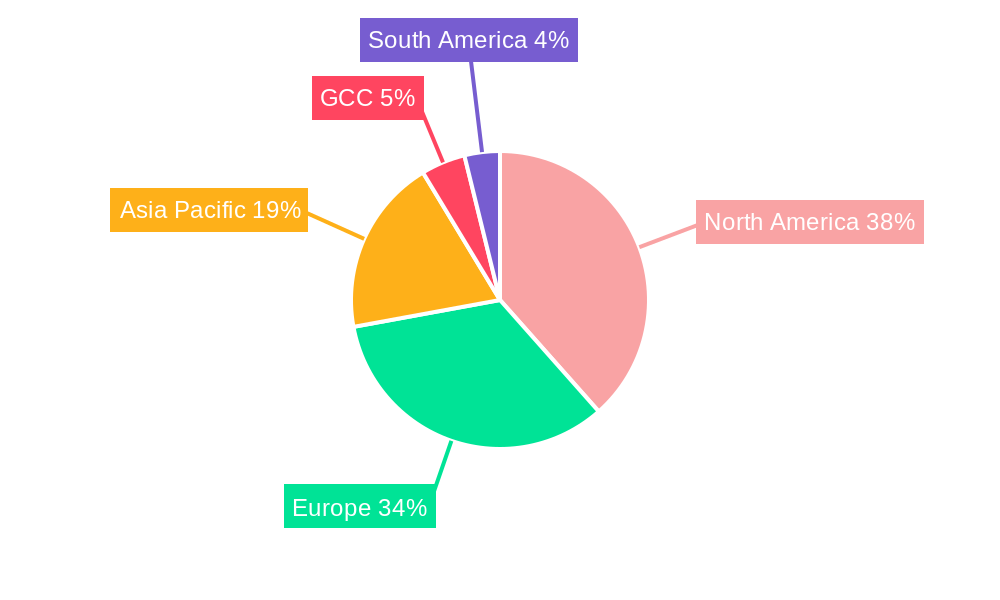
Dominant Regions & Segments in Embolotherapy Industry
The North American region currently dominates the embolization market, driven by high healthcare expenditure, technological advancements, and a substantial patient pool. Within applications, Peripheral Vascular Disease (PVD) and Oncology represent the largest segments, followed by Neurology and Urology. The dominance of Coiling Devices in the embolization technique segment is observed. Key drivers for regional dominance include:
North America: High healthcare expenditure, technological advancements, and strong regulatory support.
Europe: Growing geriatric population, increasing prevalence of chronic diseases.
Asia-Pacific: Rising healthcare spending, increasing awareness of minimally invasive treatments.
Peripheral Vascular Disease (PVD): Largest segment driven by high prevalence of vascular disorders.
Oncology: Significant growth due to rising cancer incidence and minimally invasive treatment preferences.
Coiling Devices: Dominant technique due to efficacy and established market presence.
Embolotherapy Industry Product Innovations
Recent years have witnessed significant advancements in embolization technology, including the introduction of bioabsorbable embolic materials, improved device delivery systems, and advanced imaging capabilities for precise targeting. These innovations enhance treatment efficacy, reduce complications, and improve patient outcomes, thereby driving market growth and competitive advantage. The market is witnessing a shift towards more sophisticated and targeted embolization techniques, tailored to specific patient needs and anatomical locations.
Report Scope & Segmentation Analysis
This report segments the embolization market by embolization technique (Coiling Devices and Non-coiling Devices) and application (Peripheral Vascular Disease, Oncology, Neurology, Urology, and Other Applications). Each segment's growth projection, market size, and competitive landscape are comprehensively analyzed within the full report. The market size for each segment is detailed with projections from 2025 to 2033 showing expected growth for each.
Key Drivers of Embolotherapy Industry Growth
The embolization market is experiencing substantial growth driven by several factors: the increasing prevalence of target conditions (PVD, oncology, neurology); advancements in minimally invasive techniques; rising healthcare expenditure globally; and favorable regulatory environments supporting the adoption of novel embolization technologies.
Challenges in the Embolotherapy Industry Sector
The industry faces challenges including stringent regulatory approvals, potential complications associated with embolization procedures, and high treatment costs limiting access in certain regions. Supply chain disruptions and intense competition amongst established players also pose significant challenges. The exact quantitative impact of these factors is detailed in the full report.
Emerging Opportunities in Embolotherapy Industry
Emerging opportunities include the development of novel embolic agents with improved biocompatibility and efficacy; expansion into untapped markets; and the integration of artificial intelligence and machine learning for improved procedural planning and precision. The growing demand for minimally invasive treatments in developing economies also presents a significant opportunity.
Leading Players in the Embolotherapy Industry Market
- Terumo Corp
- Cook Medical
- Merit Medical Systems Inc
- Shape Memory Medical Inc
- Abbott Laboratories
- Medtronic PLC
- Johnson and Johnson (CERENOVUS)
- B Braun Melsungen AG
- Stryker Corporation
- Boston Scientific Corporation
- W L Gore & Associates Inc
- Penumbra Inc
Key Developments in Embolotherapy Industry
- July 2021: Terumo Medical Corporation launches AZUR Vascular Plug, compatible with microcatheters for occluding arteries up to 8mm.
- April 2021: FDA approves Medtronic PLC's Pipeline Flex Embolization Device with Shield Technology for brain aneurysms.
Future Outlook for Embolotherapy Industry Market
The embolization market is poised for sustained growth, driven by technological innovation, increasing prevalence of target conditions, and expanding market penetration in emerging economies. Strategic partnerships, acquisitions, and the development of innovative embolic agents will continue to shape the market landscape. The long-term outlook is highly positive, with significant growth potential across various segments and regions.
Embolotherapy Industry Segmentation
-
1. Embolization Technique
- 1.1. Coiling Devices
- 1.2. Non-coiling Devices
-
2. Application
- 2.1. Peripheral Vascular Disease
- 2.2. Oncology
- 2.3. Neurology
- 2.4. Urology
- 2.5. Other Applications
Embolotherapy Industry Segmentation By Geography
-
1. North America
- 1.1. United States
- 1.2. Canada
- 1.3. Mexico
-
2. Europe
- 2.1. Germany
- 2.2. United Kingdom
- 2.3. France
- 2.4. Italy
- 2.5. Spain
- 2.6. Rest of Europe
-
3. Asia Pacific
- 3.1. China
- 3.2. Japan
- 3.3. India
- 3.4. Australia
- 3.5. South Korea
- 3.6. Rest of Asia Pacific
- 4. Middle East
-
5. GCC
- 5.1. South Africa
- 5.2. Rest of Middle East
-
6. South America
- 6.1. Brazil
- 6.2. Argentina
- 6.3. Rest of South America
Embolotherapy Industry REPORT HIGHLIGHTS
| Aspects | Details |
|---|---|
| Study Period | 2019-2033 |
| Base Year | 2024 |
| Estimated Year | 2025 |
| Forecast Period | 2025-2033 |
| Historical Period | 2019-2024 |
| Growth Rate | CAGR of 7.26% from 2019-2033 |
| Segmentation |
|
Table of Contents
- 1. Introduction
- 1.1. Research Scope
- 1.2. Market Segmentation
- 1.3. Research Methodology
- 1.4. Definitions and Assumptions
- 2. Executive Summary
- 2.1. Introduction
- 3. Market Dynamics
- 3.1. Introduction
- 3.2. Market Drivers
- 3.2.1. Increasing Prevalence of Vascular Diseases; Technological Advancements in Embolization Products and Procedures; Increasing Research and Development Activities
- 3.3. Market Restrains
- 3.3.1. High Costs Associated with Embolization Procedures; Stringent Regulatory Norms; Complications Associated with Embolization Procedures
- 3.4. Market Trends
- 3.4.1. The Non-coiling Devices Segment is Expected to Hold a Major Market Share in the Vascular Embolization Market over the Forecast Period
- 4. Market Factor Analysis
- 4.1. Porters Five Forces
- 4.2. Supply/Value Chain
- 4.3. PESTEL analysis
- 4.4. Market Entropy
- 4.5. Patent/Trademark Analysis
- 5. Global Embolotherapy Industry Analysis, Insights and Forecast, 2019-2031
- 5.1. Market Analysis, Insights and Forecast - by Embolization Technique
- 5.1.1. Coiling Devices
- 5.1.2. Non-coiling Devices
- 5.2. Market Analysis, Insights and Forecast - by Application
- 5.2.1. Peripheral Vascular Disease
- 5.2.2. Oncology
- 5.2.3. Neurology
- 5.2.4. Urology
- 5.2.5. Other Applications
- 5.3. Market Analysis, Insights and Forecast - by Region
- 5.3.1. North America
- 5.3.2. Europe
- 5.3.3. Asia Pacific
- 5.3.4. Middle East
- 5.3.5. GCC
- 5.3.6. South America
- 5.1. Market Analysis, Insights and Forecast - by Embolization Technique
- 6. North America Embolotherapy Industry Analysis, Insights and Forecast, 2019-2031
- 6.1. Market Analysis, Insights and Forecast - by Embolization Technique
- 6.1.1. Coiling Devices
- 6.1.2. Non-coiling Devices
- 6.2. Market Analysis, Insights and Forecast - by Application
- 6.2.1. Peripheral Vascular Disease
- 6.2.2. Oncology
- 6.2.3. Neurology
- 6.2.4. Urology
- 6.2.5. Other Applications
- 6.1. Market Analysis, Insights and Forecast - by Embolization Technique
- 7. Europe Embolotherapy Industry Analysis, Insights and Forecast, 2019-2031
- 7.1. Market Analysis, Insights and Forecast - by Embolization Technique
- 7.1.1. Coiling Devices
- 7.1.2. Non-coiling Devices
- 7.2. Market Analysis, Insights and Forecast - by Application
- 7.2.1. Peripheral Vascular Disease
- 7.2.2. Oncology
- 7.2.3. Neurology
- 7.2.4. Urology
- 7.2.5. Other Applications
- 7.1. Market Analysis, Insights and Forecast - by Embolization Technique
- 8. Asia Pacific Embolotherapy Industry Analysis, Insights and Forecast, 2019-2031
- 8.1. Market Analysis, Insights and Forecast - by Embolization Technique
- 8.1.1. Coiling Devices
- 8.1.2. Non-coiling Devices
- 8.2. Market Analysis, Insights and Forecast - by Application
- 8.2.1. Peripheral Vascular Disease
- 8.2.2. Oncology
- 8.2.3. Neurology
- 8.2.4. Urology
- 8.2.5. Other Applications
- 8.1. Market Analysis, Insights and Forecast - by Embolization Technique
- 9. Middle East Embolotherapy Industry Analysis, Insights and Forecast, 2019-2031
- 9.1. Market Analysis, Insights and Forecast - by Embolization Technique
- 9.1.1. Coiling Devices
- 9.1.2. Non-coiling Devices
- 9.2. Market Analysis, Insights and Forecast - by Application
- 9.2.1. Peripheral Vascular Disease
- 9.2.2. Oncology
- 9.2.3. Neurology
- 9.2.4. Urology
- 9.2.5. Other Applications
- 9.1. Market Analysis, Insights and Forecast - by Embolization Technique
- 10. GCC Embolotherapy Industry Analysis, Insights and Forecast, 2019-2031
- 10.1. Market Analysis, Insights and Forecast - by Embolization Technique
- 10.1.1. Coiling Devices
- 10.1.2. Non-coiling Devices
- 10.2. Market Analysis, Insights and Forecast - by Application
- 10.2.1. Peripheral Vascular Disease
- 10.2.2. Oncology
- 10.2.3. Neurology
- 10.2.4. Urology
- 10.2.5. Other Applications
- 10.1. Market Analysis, Insights and Forecast - by Embolization Technique
- 11. South America Embolotherapy Industry Analysis, Insights and Forecast, 2019-2031
- 11.1. Market Analysis, Insights and Forecast - by Embolization Technique
- 11.1.1. Coiling Devices
- 11.1.2. Non-coiling Devices
- 11.2. Market Analysis, Insights and Forecast - by Application
- 11.2.1. Peripheral Vascular Disease
- 11.2.2. Oncology
- 11.2.3. Neurology
- 11.2.4. Urology
- 11.2.5. Other Applications
- 11.1. Market Analysis, Insights and Forecast - by Embolization Technique
- 12. North America Embolotherapy Industry Analysis, Insights and Forecast, 2019-2031
- 12.1. Market Analysis, Insights and Forecast - By Country/Sub-region
- 12.1.1. undefined
- 13. Europe Embolotherapy Industry Analysis, Insights and Forecast, 2019-2031
- 13.1. Market Analysis, Insights and Forecast - By Country/Sub-region
- 13.1.1. undefined
- 14. Asia Pacific Embolotherapy Industry Analysis, Insights and Forecast, 2019-2031
- 14.1. Market Analysis, Insights and Forecast - By Country/Sub-region
- 14.1.1. undefined
- 15. GCC Embolotherapy Industry Analysis, Insights and Forecast, 2019-2031
- 15.1. Market Analysis, Insights and Forecast - By Country/Sub-region
- 15.1.1. undefined
- 16. South America Embolotherapy Industry Analysis, Insights and Forecast, 2019-2031
- 16.1. Market Analysis, Insights and Forecast - By Country/Sub-region
- 16.1.1. undefined
- 17. Competitive Analysis
- 17.1. Global Market Share Analysis 2024
- 17.2. Company Profiles
- 17.2.1 Terumo Corp
- 17.2.1.1. Overview
- 17.2.1.2. Products
- 17.2.1.3. SWOT Analysis
- 17.2.1.4. Recent Developments
- 17.2.1.5. Financials (Based on Availability)
- 17.2.2 Cook Medical
- 17.2.2.1. Overview
- 17.2.2.2. Products
- 17.2.2.3. SWOT Analysis
- 17.2.2.4. Recent Developments
- 17.2.2.5. Financials (Based on Availability)
- 17.2.3 Merit Medical Systems Inc
- 17.2.3.1. Overview
- 17.2.3.2. Products
- 17.2.3.3. SWOT Analysis
- 17.2.3.4. Recent Developments
- 17.2.3.5. Financials (Based on Availability)
- 17.2.4 Shape Memory Medical Inc
- 17.2.4.1. Overview
- 17.2.4.2. Products
- 17.2.4.3. SWOT Analysis
- 17.2.4.4. Recent Developments
- 17.2.4.5. Financials (Based on Availability)
- 17.2.5 Abbott Laboratories
- 17.2.5.1. Overview
- 17.2.5.2. Products
- 17.2.5.3. SWOT Analysis
- 17.2.5.4. Recent Developments
- 17.2.5.5. Financials (Based on Availability)
- 17.2.6 Medtronic PLC
- 17.2.6.1. Overview
- 17.2.6.2. Products
- 17.2.6.3. SWOT Analysis
- 17.2.6.4. Recent Developments
- 17.2.6.5. Financials (Based on Availability)
- 17.2.7 Johnson and Johnson (CERENOVUS)
- 17.2.7.1. Overview
- 17.2.7.2. Products
- 17.2.7.3. SWOT Analysis
- 17.2.7.4. Recent Developments
- 17.2.7.5. Financials (Based on Availability)
- 17.2.8 B Braun Melsungen AG
- 17.2.8.1. Overview
- 17.2.8.2. Products
- 17.2.8.3. SWOT Analysis
- 17.2.8.4. Recent Developments
- 17.2.8.5. Financials (Based on Availability)
- 17.2.9 Stryker Corporation
- 17.2.9.1. Overview
- 17.2.9.2. Products
- 17.2.9.3. SWOT Analysis
- 17.2.9.4. Recent Developments
- 17.2.9.5. Financials (Based on Availability)
- 17.2.10 Boston Scientific Corporation
- 17.2.10.1. Overview
- 17.2.10.2. Products
- 17.2.10.3. SWOT Analysis
- 17.2.10.4. Recent Developments
- 17.2.10.5. Financials (Based on Availability)
- 17.2.11 W L Gore & Associates Inc
- 17.2.11.1. Overview
- 17.2.11.2. Products
- 17.2.11.3. SWOT Analysis
- 17.2.11.4. Recent Developments
- 17.2.11.5. Financials (Based on Availability)
- 17.2.12 Penumbra Inc
- 17.2.12.1. Overview
- 17.2.12.2. Products
- 17.2.12.3. SWOT Analysis
- 17.2.12.4. Recent Developments
- 17.2.12.5. Financials (Based on Availability)
- 17.2.1 Terumo Corp
List of Figures
- Figure 1: Global Embolotherapy Industry Revenue Breakdown (Million, %) by Region 2024 & 2032
- Figure 2: Global Embolotherapy Industry Volume Breakdown (K Unit, %) by Region 2024 & 2032
- Figure 3: North America Embolotherapy Industry Revenue (Million), by Country 2024 & 2032
- Figure 4: North America Embolotherapy Industry Volume (K Unit), by Country 2024 & 2032
- Figure 5: North America Embolotherapy Industry Revenue Share (%), by Country 2024 & 2032
- Figure 6: North America Embolotherapy Industry Volume Share (%), by Country 2024 & 2032
- Figure 7: Europe Embolotherapy Industry Revenue (Million), by Country 2024 & 2032
- Figure 8: Europe Embolotherapy Industry Volume (K Unit), by Country 2024 & 2032
- Figure 9: Europe Embolotherapy Industry Revenue Share (%), by Country 2024 & 2032
- Figure 10: Europe Embolotherapy Industry Volume Share (%), by Country 2024 & 2032
- Figure 11: Asia Pacific Embolotherapy Industry Revenue (Million), by Country 2024 & 2032
- Figure 12: Asia Pacific Embolotherapy Industry Volume (K Unit), by Country 2024 & 2032
- Figure 13: Asia Pacific Embolotherapy Industry Revenue Share (%), by Country 2024 & 2032
- Figure 14: Asia Pacific Embolotherapy Industry Volume Share (%), by Country 2024 & 2032
- Figure 15: GCC Embolotherapy Industry Revenue (Million), by Country 2024 & 2032
- Figure 16: GCC Embolotherapy Industry Volume (K Unit), by Country 2024 & 2032
- Figure 17: GCC Embolotherapy Industry Revenue Share (%), by Country 2024 & 2032
- Figure 18: GCC Embolotherapy Industry Volume Share (%), by Country 2024 & 2032
- Figure 19: South America Embolotherapy Industry Revenue (Million), by Country 2024 & 2032
- Figure 20: South America Embolotherapy Industry Volume (K Unit), by Country 2024 & 2032
- Figure 21: South America Embolotherapy Industry Revenue Share (%), by Country 2024 & 2032
- Figure 22: South America Embolotherapy Industry Volume Share (%), by Country 2024 & 2032
- Figure 23: North America Embolotherapy Industry Revenue (Million), by Embolization Technique 2024 & 2032
- Figure 24: North America Embolotherapy Industry Volume (K Unit), by Embolization Technique 2024 & 2032
- Figure 25: North America Embolotherapy Industry Revenue Share (%), by Embolization Technique 2024 & 2032
- Figure 26: North America Embolotherapy Industry Volume Share (%), by Embolization Technique 2024 & 2032
- Figure 27: North America Embolotherapy Industry Revenue (Million), by Application 2024 & 2032
- Figure 28: North America Embolotherapy Industry Volume (K Unit), by Application 2024 & 2032
- Figure 29: North America Embolotherapy Industry Revenue Share (%), by Application 2024 & 2032
- Figure 30: North America Embolotherapy Industry Volume Share (%), by Application 2024 & 2032
- Figure 31: North America Embolotherapy Industry Revenue (Million), by Country 2024 & 2032
- Figure 32: North America Embolotherapy Industry Volume (K Unit), by Country 2024 & 2032
- Figure 33: North America Embolotherapy Industry Revenue Share (%), by Country 2024 & 2032
- Figure 34: North America Embolotherapy Industry Volume Share (%), by Country 2024 & 2032
- Figure 35: Europe Embolotherapy Industry Revenue (Million), by Embolization Technique 2024 & 2032
- Figure 36: Europe Embolotherapy Industry Volume (K Unit), by Embolization Technique 2024 & 2032
- Figure 37: Europe Embolotherapy Industry Revenue Share (%), by Embolization Technique 2024 & 2032
- Figure 38: Europe Embolotherapy Industry Volume Share (%), by Embolization Technique 2024 & 2032
- Figure 39: Europe Embolotherapy Industry Revenue (Million), by Application 2024 & 2032
- Figure 40: Europe Embolotherapy Industry Volume (K Unit), by Application 2024 & 2032
- Figure 41: Europe Embolotherapy Industry Revenue Share (%), by Application 2024 & 2032
- Figure 42: Europe Embolotherapy Industry Volume Share (%), by Application 2024 & 2032
- Figure 43: Europe Embolotherapy Industry Revenue (Million), by Country 2024 & 2032
- Figure 44: Europe Embolotherapy Industry Volume (K Unit), by Country 2024 & 2032
- Figure 45: Europe Embolotherapy Industry Revenue Share (%), by Country 2024 & 2032
- Figure 46: Europe Embolotherapy Industry Volume Share (%), by Country 2024 & 2032
- Figure 47: Asia Pacific Embolotherapy Industry Revenue (Million), by Embolization Technique 2024 & 2032
- Figure 48: Asia Pacific Embolotherapy Industry Volume (K Unit), by Embolization Technique 2024 & 2032
- Figure 49: Asia Pacific Embolotherapy Industry Revenue Share (%), by Embolization Technique 2024 & 2032
- Figure 50: Asia Pacific Embolotherapy Industry Volume Share (%), by Embolization Technique 2024 & 2032
- Figure 51: Asia Pacific Embolotherapy Industry Revenue (Million), by Application 2024 & 2032
- Figure 52: Asia Pacific Embolotherapy Industry Volume (K Unit), by Application 2024 & 2032
- Figure 53: Asia Pacific Embolotherapy Industry Revenue Share (%), by Application 2024 & 2032
- Figure 54: Asia Pacific Embolotherapy Industry Volume Share (%), by Application 2024 & 2032
- Figure 55: Asia Pacific Embolotherapy Industry Revenue (Million), by Country 2024 & 2032
- Figure 56: Asia Pacific Embolotherapy Industry Volume (K Unit), by Country 2024 & 2032
- Figure 57: Asia Pacific Embolotherapy Industry Revenue Share (%), by Country 2024 & 2032
- Figure 58: Asia Pacific Embolotherapy Industry Volume Share (%), by Country 2024 & 2032
- Figure 59: Middle East Embolotherapy Industry Revenue (Million), by Embolization Technique 2024 & 2032
- Figure 60: Middle East Embolotherapy Industry Volume (K Unit), by Embolization Technique 2024 & 2032
- Figure 61: Middle East Embolotherapy Industry Revenue Share (%), by Embolization Technique 2024 & 2032
- Figure 62: Middle East Embolotherapy Industry Volume Share (%), by Embolization Technique 2024 & 2032
- Figure 63: Middle East Embolotherapy Industry Revenue (Million), by Application 2024 & 2032
- Figure 64: Middle East Embolotherapy Industry Volume (K Unit), by Application 2024 & 2032
- Figure 65: Middle East Embolotherapy Industry Revenue Share (%), by Application 2024 & 2032
- Figure 66: Middle East Embolotherapy Industry Volume Share (%), by Application 2024 & 2032
- Figure 67: Middle East Embolotherapy Industry Revenue (Million), by Country 2024 & 2032
- Figure 68: Middle East Embolotherapy Industry Volume (K Unit), by Country 2024 & 2032
- Figure 69: Middle East Embolotherapy Industry Revenue Share (%), by Country 2024 & 2032
- Figure 70: Middle East Embolotherapy Industry Volume Share (%), by Country 2024 & 2032
- Figure 71: GCC Embolotherapy Industry Revenue (Million), by Embolization Technique 2024 & 2032
- Figure 72: GCC Embolotherapy Industry Volume (K Unit), by Embolization Technique 2024 & 2032
- Figure 73: GCC Embolotherapy Industry Revenue Share (%), by Embolization Technique 2024 & 2032
- Figure 74: GCC Embolotherapy Industry Volume Share (%), by Embolization Technique 2024 & 2032
- Figure 75: GCC Embolotherapy Industry Revenue (Million), by Application 2024 & 2032
- Figure 76: GCC Embolotherapy Industry Volume (K Unit), by Application 2024 & 2032
- Figure 77: GCC Embolotherapy Industry Revenue Share (%), by Application 2024 & 2032
- Figure 78: GCC Embolotherapy Industry Volume Share (%), by Application 2024 & 2032
- Figure 79: GCC Embolotherapy Industry Revenue (Million), by Country 2024 & 2032
- Figure 80: GCC Embolotherapy Industry Volume (K Unit), by Country 2024 & 2032
- Figure 81: GCC Embolotherapy Industry Revenue Share (%), by Country 2024 & 2032
- Figure 82: GCC Embolotherapy Industry Volume Share (%), by Country 2024 & 2032
- Figure 83: South America Embolotherapy Industry Revenue (Million), by Embolization Technique 2024 & 2032
- Figure 84: South America Embolotherapy Industry Volume (K Unit), by Embolization Technique 2024 & 2032
- Figure 85: South America Embolotherapy Industry Revenue Share (%), by Embolization Technique 2024 & 2032
- Figure 86: South America Embolotherapy Industry Volume Share (%), by Embolization Technique 2024 & 2032
- Figure 87: South America Embolotherapy Industry Revenue (Million), by Application 2024 & 2032
- Figure 88: South America Embolotherapy Industry Volume (K Unit), by Application 2024 & 2032
- Figure 89: South America Embolotherapy Industry Revenue Share (%), by Application 2024 & 2032
- Figure 90: South America Embolotherapy Industry Volume Share (%), by Application 2024 & 2032
- Figure 91: South America Embolotherapy Industry Revenue (Million), by Country 2024 & 2032
- Figure 92: South America Embolotherapy Industry Volume (K Unit), by Country 2024 & 2032
- Figure 93: South America Embolotherapy Industry Revenue Share (%), by Country 2024 & 2032
- Figure 94: South America Embolotherapy Industry Volume Share (%), by Country 2024 & 2032
List of Tables
- Table 1: Global Embolotherapy Industry Revenue Million Forecast, by Region 2019 & 2032
- Table 2: Global Embolotherapy Industry Volume K Unit Forecast, by Region 2019 & 2032
- Table 3: Global Embolotherapy Industry Revenue Million Forecast, by Embolization Technique 2019 & 2032
- Table 4: Global Embolotherapy Industry Volume K Unit Forecast, by Embolization Technique 2019 & 2032
- Table 5: Global Embolotherapy Industry Revenue Million Forecast, by Application 2019 & 2032
- Table 6: Global Embolotherapy Industry Volume K Unit Forecast, by Application 2019 & 2032
- Table 7: Global Embolotherapy Industry Revenue Million Forecast, by Region 2019 & 2032
- Table 8: Global Embolotherapy Industry Volume K Unit Forecast, by Region 2019 & 2032
- Table 9: Global Embolotherapy Industry Revenue Million Forecast, by Country 2019 & 2032
- Table 10: Global Embolotherapy Industry Volume K Unit Forecast, by Country 2019 & 2032
- Table 11: Global Embolotherapy Industry Revenue Million Forecast, by Country 2019 & 2032
- Table 12: Global Embolotherapy Industry Volume K Unit Forecast, by Country 2019 & 2032
- Table 13: Global Embolotherapy Industry Revenue Million Forecast, by Country 2019 & 2032
- Table 14: Global Embolotherapy Industry Volume K Unit Forecast, by Country 2019 & 2032
- Table 15: Global Embolotherapy Industry Revenue Million Forecast, by Country 2019 & 2032
- Table 16: Global Embolotherapy Industry Volume K Unit Forecast, by Country 2019 & 2032
- Table 17: Global Embolotherapy Industry Revenue Million Forecast, by Country 2019 & 2032
- Table 18: Global Embolotherapy Industry Volume K Unit Forecast, by Country 2019 & 2032
- Table 19: Global Embolotherapy Industry Revenue Million Forecast, by Embolization Technique 2019 & 2032
- Table 20: Global Embolotherapy Industry Volume K Unit Forecast, by Embolization Technique 2019 & 2032
- Table 21: Global Embolotherapy Industry Revenue Million Forecast, by Application 2019 & 2032
- Table 22: Global Embolotherapy Industry Volume K Unit Forecast, by Application 2019 & 2032
- Table 23: Global Embolotherapy Industry Revenue Million Forecast, by Country 2019 & 2032
- Table 24: Global Embolotherapy Industry Volume K Unit Forecast, by Country 2019 & 2032
- Table 25: United States Embolotherapy Industry Revenue (Million) Forecast, by Application 2019 & 2032
- Table 26: United States Embolotherapy Industry Volume (K Unit) Forecast, by Application 2019 & 2032
- Table 27: Canada Embolotherapy Industry Revenue (Million) Forecast, by Application 2019 & 2032
- Table 28: Canada Embolotherapy Industry Volume (K Unit) Forecast, by Application 2019 & 2032
- Table 29: Mexico Embolotherapy Industry Revenue (Million) Forecast, by Application 2019 & 2032
- Table 30: Mexico Embolotherapy Industry Volume (K Unit) Forecast, by Application 2019 & 2032
- Table 31: Global Embolotherapy Industry Revenue Million Forecast, by Embolization Technique 2019 & 2032
- Table 32: Global Embolotherapy Industry Volume K Unit Forecast, by Embolization Technique 2019 & 2032
- Table 33: Global Embolotherapy Industry Revenue Million Forecast, by Application 2019 & 2032
- Table 34: Global Embolotherapy Industry Volume K Unit Forecast, by Application 2019 & 2032
- Table 35: Global Embolotherapy Industry Revenue Million Forecast, by Country 2019 & 2032
- Table 36: Global Embolotherapy Industry Volume K Unit Forecast, by Country 2019 & 2032
- Table 37: Germany Embolotherapy Industry Revenue (Million) Forecast, by Application 2019 & 2032
- Table 38: Germany Embolotherapy Industry Volume (K Unit) Forecast, by Application 2019 & 2032
- Table 39: United Kingdom Embolotherapy Industry Revenue (Million) Forecast, by Application 2019 & 2032
- Table 40: United Kingdom Embolotherapy Industry Volume (K Unit) Forecast, by Application 2019 & 2032
- Table 41: France Embolotherapy Industry Revenue (Million) Forecast, by Application 2019 & 2032
- Table 42: France Embolotherapy Industry Volume (K Unit) Forecast, by Application 2019 & 2032
- Table 43: Italy Embolotherapy Industry Revenue (Million) Forecast, by Application 2019 & 2032
- Table 44: Italy Embolotherapy Industry Volume (K Unit) Forecast, by Application 2019 & 2032
- Table 45: Spain Embolotherapy Industry Revenue (Million) Forecast, by Application 2019 & 2032
- Table 46: Spain Embolotherapy Industry Volume (K Unit) Forecast, by Application 2019 & 2032
- Table 47: Rest of Europe Embolotherapy Industry Revenue (Million) Forecast, by Application 2019 & 2032
- Table 48: Rest of Europe Embolotherapy Industry Volume (K Unit) Forecast, by Application 2019 & 2032
- Table 49: Global Embolotherapy Industry Revenue Million Forecast, by Embolization Technique 2019 & 2032
- Table 50: Global Embolotherapy Industry Volume K Unit Forecast, by Embolization Technique 2019 & 2032
- Table 51: Global Embolotherapy Industry Revenue Million Forecast, by Application 2019 & 2032
- Table 52: Global Embolotherapy Industry Volume K Unit Forecast, by Application 2019 & 2032
- Table 53: Global Embolotherapy Industry Revenue Million Forecast, by Country 2019 & 2032
- Table 54: Global Embolotherapy Industry Volume K Unit Forecast, by Country 2019 & 2032
- Table 55: China Embolotherapy Industry Revenue (Million) Forecast, by Application 2019 & 2032
- Table 56: China Embolotherapy Industry Volume (K Unit) Forecast, by Application 2019 & 2032
- Table 57: Japan Embolotherapy Industry Revenue (Million) Forecast, by Application 2019 & 2032
- Table 58: Japan Embolotherapy Industry Volume (K Unit) Forecast, by Application 2019 & 2032
- Table 59: India Embolotherapy Industry Revenue (Million) Forecast, by Application 2019 & 2032
- Table 60: India Embolotherapy Industry Volume (K Unit) Forecast, by Application 2019 & 2032
- Table 61: Australia Embolotherapy Industry Revenue (Million) Forecast, by Application 2019 & 2032
- Table 62: Australia Embolotherapy Industry Volume (K Unit) Forecast, by Application 2019 & 2032
- Table 63: South Korea Embolotherapy Industry Revenue (Million) Forecast, by Application 2019 & 2032
- Table 64: South Korea Embolotherapy Industry Volume (K Unit) Forecast, by Application 2019 & 2032
- Table 65: Rest of Asia Pacific Embolotherapy Industry Revenue (Million) Forecast, by Application 2019 & 2032
- Table 66: Rest of Asia Pacific Embolotherapy Industry Volume (K Unit) Forecast, by Application 2019 & 2032
- Table 67: Global Embolotherapy Industry Revenue Million Forecast, by Embolization Technique 2019 & 2032
- Table 68: Global Embolotherapy Industry Volume K Unit Forecast, by Embolization Technique 2019 & 2032
- Table 69: Global Embolotherapy Industry Revenue Million Forecast, by Application 2019 & 2032
- Table 70: Global Embolotherapy Industry Volume K Unit Forecast, by Application 2019 & 2032
- Table 71: Global Embolotherapy Industry Revenue Million Forecast, by Country 2019 & 2032
- Table 72: Global Embolotherapy Industry Volume K Unit Forecast, by Country 2019 & 2032
- Table 73: Global Embolotherapy Industry Revenue Million Forecast, by Embolization Technique 2019 & 2032
- Table 74: Global Embolotherapy Industry Volume K Unit Forecast, by Embolization Technique 2019 & 2032
- Table 75: Global Embolotherapy Industry Revenue Million Forecast, by Application 2019 & 2032
- Table 76: Global Embolotherapy Industry Volume K Unit Forecast, by Application 2019 & 2032
- Table 77: Global Embolotherapy Industry Revenue Million Forecast, by Country 2019 & 2032
- Table 78: Global Embolotherapy Industry Volume K Unit Forecast, by Country 2019 & 2032
- Table 79: South Africa Embolotherapy Industry Revenue (Million) Forecast, by Application 2019 & 2032
- Table 80: South Africa Embolotherapy Industry Volume (K Unit) Forecast, by Application 2019 & 2032
- Table 81: Rest of Middle East Embolotherapy Industry Revenue (Million) Forecast, by Application 2019 & 2032
- Table 82: Rest of Middle East Embolotherapy Industry Volume (K Unit) Forecast, by Application 2019 & 2032
- Table 83: Global Embolotherapy Industry Revenue Million Forecast, by Embolization Technique 2019 & 2032
- Table 84: Global Embolotherapy Industry Volume K Unit Forecast, by Embolization Technique 2019 & 2032
- Table 85: Global Embolotherapy Industry Revenue Million Forecast, by Application 2019 & 2032
- Table 86: Global Embolotherapy Industry Volume K Unit Forecast, by Application 2019 & 2032
- Table 87: Global Embolotherapy Industry Revenue Million Forecast, by Country 2019 & 2032
- Table 88: Global Embolotherapy Industry Volume K Unit Forecast, by Country 2019 & 2032
- Table 89: Brazil Embolotherapy Industry Revenue (Million) Forecast, by Application 2019 & 2032
- Table 90: Brazil Embolotherapy Industry Volume (K Unit) Forecast, by Application 2019 & 2032
- Table 91: Argentina Embolotherapy Industry Revenue (Million) Forecast, by Application 2019 & 2032
- Table 92: Argentina Embolotherapy Industry Volume (K Unit) Forecast, by Application 2019 & 2032
- Table 93: Rest of South America Embolotherapy Industry Revenue (Million) Forecast, by Application 2019 & 2032
- Table 94: Rest of South America Embolotherapy Industry Volume (K Unit) Forecast, by Application 2019 & 2032
Frequently Asked Questions
1. What is the projected Compound Annual Growth Rate (CAGR) of the Embolotherapy Industry?
The projected CAGR is approximately 7.26%.
2. Which companies are prominent players in the Embolotherapy Industry?
Key companies in the market include Terumo Corp, Cook Medical, Merit Medical Systems Inc, Shape Memory Medical Inc, Abbott Laboratories, Medtronic PLC, Johnson and Johnson (CERENOVUS), B Braun Melsungen AG, Stryker Corporation, Boston Scientific Corporation, W L Gore & Associates Inc , Penumbra Inc.
3. What are the main segments of the Embolotherapy Industry?
The market segments include Embolization Technique, Application.
4. Can you provide details about the market size?
The market size is estimated to be USD 1.94 Million as of 2022.
5. What are some drivers contributing to market growth?
Increasing Prevalence of Vascular Diseases; Technological Advancements in Embolization Products and Procedures; Increasing Research and Development Activities.
6. What are the notable trends driving market growth?
The Non-coiling Devices Segment is Expected to Hold a Major Market Share in the Vascular Embolization Market over the Forecast Period.
7. Are there any restraints impacting market growth?
High Costs Associated with Embolization Procedures; Stringent Regulatory Norms; Complications Associated with Embolization Procedures.
8. Can you provide examples of recent developments in the market?
In July 2021, Terumo Medical Corporation (TMC) has the introduction of its AZUR Vascular Plug, the first and only plug compatible with a microcatheter to occlude arteries up to 8mm in diameter. The newest addition to Terumo's robust embolization portfolio is indicated for use to reduce or block the rate of blood flow in arteries of the peripheral vasculature.
9. What pricing options are available for accessing the report?
Pricing options include single-user, multi-user, and enterprise licenses priced at USD 4750, USD 5250, and USD 8750 respectively.
10. Is the market size provided in terms of value or volume?
The market size is provided in terms of value, measured in Million and volume, measured in K Unit.
11. Are there any specific market keywords associated with the report?
Yes, the market keyword associated with the report is "Embolotherapy Industry," which aids in identifying and referencing the specific market segment covered.
12. How do I determine which pricing option suits my needs best?
The pricing options vary based on user requirements and access needs. Individual users may opt for single-user licenses, while businesses requiring broader access may choose multi-user or enterprise licenses for cost-effective access to the report.
13. Are there any additional resources or data provided in the Embolotherapy Industry report?
While the report offers comprehensive insights, it's advisable to review the specific contents or supplementary materials provided to ascertain if additional resources or data are available.
14. How can I stay updated on further developments or reports in the Embolotherapy Industry?
To stay informed about further developments, trends, and reports in the Embolotherapy Industry, consider subscribing to industry newsletters, following relevant companies and organizations, or regularly checking reputable industry news sources and publications.
Methodology
Step 1 - Identification of Relevant Samples Size from Population Database


Step 2 - Approaches for Defining Global Market Size (Value, Volume* & Price*)

Note*: In applicable scenarios
Step 3 - Data Sources
Primary Research
- Web Analytics
- Survey Reports
- Research Institute
- Latest Research Reports
- Opinion Leaders
Secondary Research
- Annual Reports
- White Paper
- Latest Press Release
- Industry Association
- Paid Database
- Investor Presentations

Step 4 - Data Triangulation
Involves using different sources of information in order to increase the validity of a study
These sources are likely to be stakeholders in a program - participants, other researchers, program staff, other community members, and so on.
Then we put all data in single framework & apply various statistical tools to find out the dynamic on the market.
During the analysis stage, feedback from the stakeholder groups would be compared to determine areas of agreement as well as areas of divergence


