
Key Insights
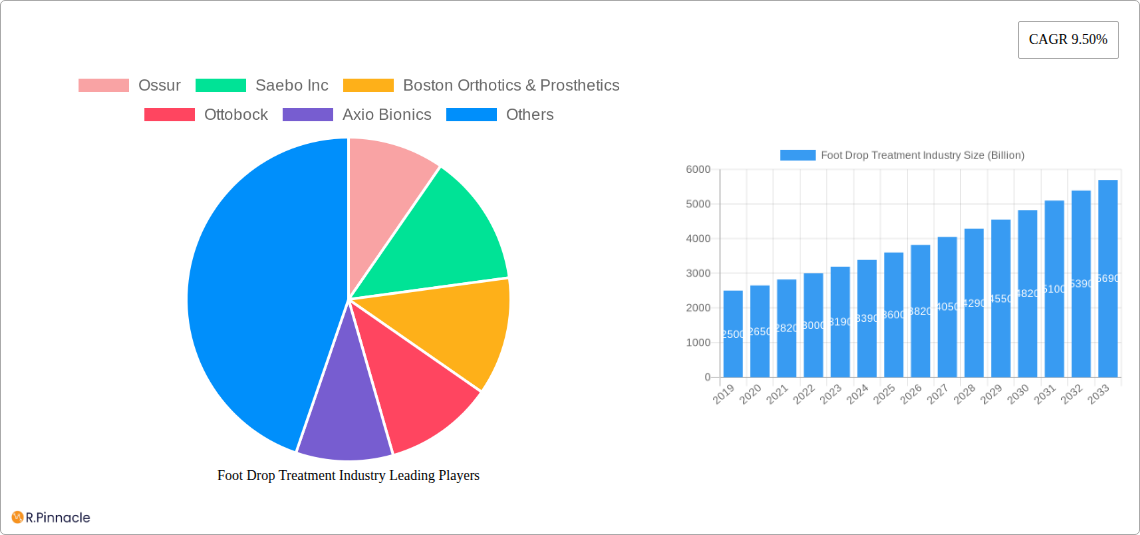
The global Foot Drop Treatment Market is poised for significant expansion, projected to reach a substantial market size of $4 billion by 2025. This growth is underpinned by a robust Compound Annual Growth Rate (CAGR) of 9.50% during the forecast period of 2025-2033. The escalating prevalence of neurological conditions such as neuropathy, muscle disorders, and brain and spinal cord injuries are primary catalysts for this market surge. These conditions often result in foot drop, necessitating advanced treatment solutions. The increasing demand for innovative products like Functional Electrical Stimulators (FES) and advanced braces and splints that offer enhanced mobility and rehabilitation is a key driver. Furthermore, a growing awareness among patients and healthcare providers regarding the benefits of early and effective intervention for foot drop is contributing to market penetration. Technological advancements in orthotics and prosthetics, coupled with a greater focus on patient-centric care and rehabilitation programs, are further fueling the market's upward trajectory.
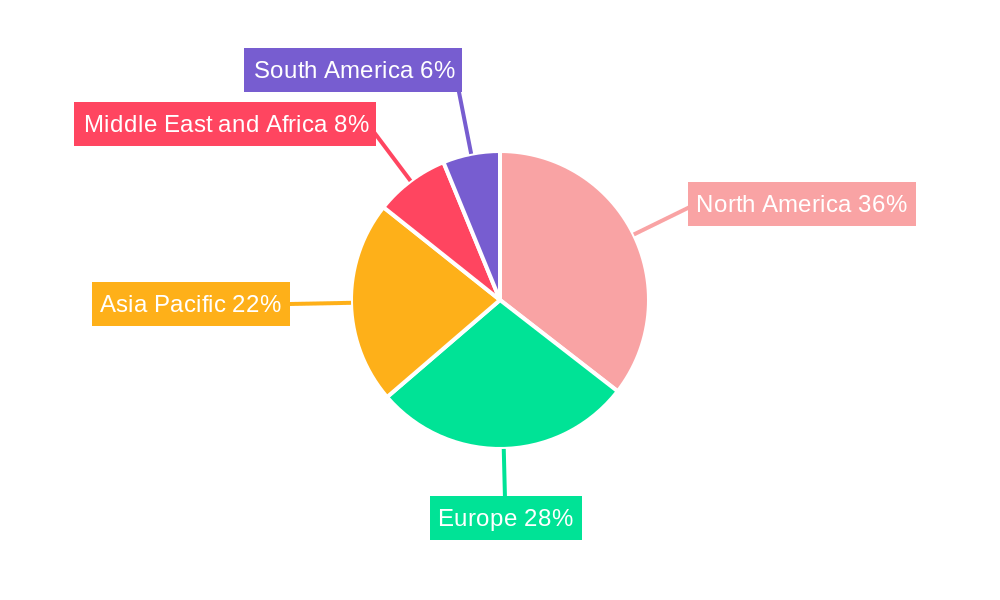
The market is segmented into product types, with Functional Electrical Stimulators and Braces/Splints representing the most prominent categories due to their direct application in managing foot drop symptoms. The application landscape is dominated by Neuropathy, Muscle Disorders, and Brain & Spinal Disorders, reflecting the primary etiologies of foot drop. Geographically, North America, particularly the United States, is expected to lead the market, driven by high healthcare expenditure, advanced technological adoption, and a strong presence of key market players such as Ossur, Ottobock, and Bioness Inc. Europe also presents a substantial market opportunity, with countries like Germany and the United Kingdom showing significant adoption rates. The Asia Pacific region is anticipated to witness the fastest growth, fueled by expanding healthcare infrastructure, increasing disposable incomes, and a growing patient pool in countries like China and India. Despite the positive outlook, potential restraints could include the high cost of some advanced treatment devices and limited access to specialized treatment centers in certain developing regions.
Unlocking Mobility: The Comprehensive Foot Drop Treatment Industry Report (2019–2033)
This in-depth report provides an exhaustive analysis of the global Foot Drop Treatment industry, essential for stakeholders seeking to navigate this rapidly evolving market. Spanning a study period from 2019 to 2033, with a base and estimated year of 2025, the report offers critical insights into market dynamics, technological advancements, and future growth trajectories. Our expert analysis, covering historical trends from 2019–2024 and a forecast period of 2025–2033, equips you with the intelligence to capitalize on opportunities within this vital sector, projected to witness significant expansion. Discover how innovations in functional electrical stimulation, advanced bracing solutions, and targeted applications for neuropathy, muscle disorders, and brain & spinal disorders are reshaping patient care and market landscapes. This report is your definitive guide to understanding the business intelligence behind foot drop treatment solutions, empowering strategic decision-making in a market projected to reach USD 9.8 Billion by 2033.
Foot Drop Treatment Industry Market Structure & Innovation Trends
The Foot Drop Treatment industry exhibits a moderately concentrated market structure, characterized by a blend of established global players and emerging innovators. Key drivers of innovation include the persistent need for improved patient mobility and quality of life, coupled with advancements in neurostimulation technology and biomechanics. Regulatory frameworks, primarily influenced by bodies like the USFDA, play a crucial role in product approval and market access, fostering both innovation and patient safety. Product substitutes exist, ranging from traditional orthotics to less invasive therapeutic approaches, though technological advancements are continually enhancing the efficacy and user-friendliness of dedicated foot drop treatments. End-user demographics are primarily individuals suffering from neurological conditions such as stroke, multiple sclerosis, cerebral palsy, and spinal cord injuries. Mergers and acquisitions (M&A) activity is anticipated to increase as larger companies seek to integrate cutting-edge technologies and expand their product portfolios, with estimated M&A deal values reaching USD 1.2 Billion over the forecast period. Market share distribution shows dominant players holding significant portions, but niche innovators are carving out substantial segments with specialized solutions. The overall market concentration is expected to see a slight decrease as new entrants leverage novel technologies, leading to a more dynamic competitive landscape.
Foot Drop Treatment Industry Market Dynamics & Trends
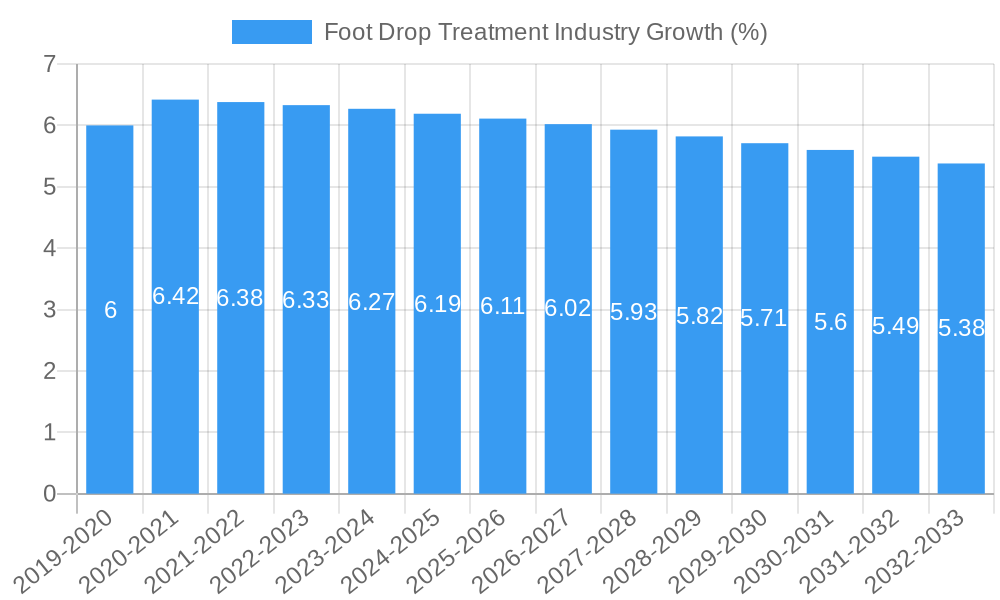
The Foot Drop Treatment industry is poised for substantial growth, driven by a confluence of escalating healthcare needs, technological breakthroughs, and increasing patient awareness. The rising global prevalence of neurological disorders, including stroke survivors and individuals with conditions like multiple sclerosis and peripheral neuropathy, forms the bedrock of market expansion. This demographic trend, coupled with an aging global population, directly translates to a larger patient pool requiring effective mobility solutions. Technological innovation is a paramount growth accelerator. The continuous development of more sophisticated and user-friendly Functional Electrical Stimulation (FES) devices, advanced orthotic designs offering enhanced comfort and efficacy, and intelligent assistive technologies are revolutionizing treatment paradigms. For instance, the integration of AI for predicting and augmenting movement, as seen with the Cionic Neural Sleeve, signifies a significant leap forward. Consumer preferences are increasingly shifting towards non-invasive, personalized, and integrated solutions that improve functional independence and overall quality of life. Patients and caregivers are actively seeking devices that are lightweight, discreet, and offer seamless integration into daily routines. Competitive dynamics are intensifying, with both established medical device manufacturers and agile startups vying for market dominance. This competition fosters innovation, drives down costs in some segments, and broadens the accessibility of advanced treatments. Market penetration is steadily increasing as awareness of available treatments grows and reimbursement policies evolve to cover these advanced solutions. The CAGR for the Foot Drop Treatment industry is projected to be approximately 9.5% from 2025 to 2033, reflecting robust market expansion. Furthermore, the increasing focus on rehabilitation and post-acute care management of neurological conditions directly fuels demand for effective foot drop interventions.
Dominant Regions & Segments in Foot Drop Treatment Industry
North America currently dominates the Foot Drop Treatment industry, driven by a robust healthcare infrastructure, high per capita healthcare spending, and a significant prevalence of neurological disorders. The United States, in particular, stands out due to advanced technological adoption, favorable reimbursement policies for advanced orthotic and neurostimulation devices, and a strong presence of leading research institutions and medical device manufacturers. Economic policies in the region strongly support the development and adoption of innovative medical technologies, further bolstering market leadership.
Within North America, and globally, the Braces/Splints segment holds a dominant position in terms of market share.
- Key Drivers for Braces/Splints Dominance:
- Established Efficacy: Traditional braces and splints have a long-standing track record of providing mechanical support and improving gait.
- Cost-Effectiveness: Compared to some advanced neurostimulation devices, certain types of braces and splints offer a more accessible price point, leading to wider adoption.
- Technological Advancements: Innovations in materials (e.g., lightweight composites) and custom-fitting technologies have significantly enhanced the comfort and effectiveness of braces.
- Patient Acceptance: Many patients are familiar and comfortable with the concept of wearing orthotic devices for support.
The Functional Electrical Stimulator (FES) segment is experiencing rapid growth and is projected to gain substantial market share due to its ability to actively retrain muscles and improve functional outcomes. The increasing adoption of FES systems for stroke rehabilitation and management of other neuromuscular conditions is a key indicator of its rising influence.
In terms of applications, Neuropathy and Brain & Spinal Disorders are the most significant segments. The high incidence of diabetic neuropathy and the long-term effects of strokes, spinal cord injuries, and conditions like Multiple Sclerosis directly contribute to the demand for effective foot drop treatments within these categories. The development of targeted FES and advanced orthotics tailored for these specific neurological deficits further cements their dominance.
Foot Drop Treatment Industry Product Innovations
Product innovations in the Foot Drop Treatment industry are primarily focused on enhancing functionality, comfort, and user experience. Advanced materials are being employed to create lighter, more durable, and custom-fit orthotics. The integration of smart technologies, such as sensors and AI algorithms, is enabling devices to adapt to individual gait patterns and provide real-time feedback or stimulation. Notably, the development of wearable FES devices that are discreet and easy to use is a significant trend. These innovations offer competitive advantages by improving patient compliance, efficacy, and overall quality of life, directly addressing unmet needs in the market.
Report Scope & Segmentation Analysis
The Foot Drop Treatment industry is segmented by Product Type into Functional Electrical Stimulator and Braces/Splints, and by Application into Neuropathy, Muscle Disorders, and Brain & Spinal Disorders. The Functional Electrical Stimulator segment is characterized by high growth potential, driven by technological advancements in neurorehabilitation and a growing understanding of FES efficacy in restoring muscle function. Market size for FES is estimated at USD 1.8 Billion in 2025, with projected growth to USD 4.5 Billion by 2033. The Braces/Splints segment, while mature, continues to hold a significant market share due to its established role and cost-effectiveness, valued at USD 3.5 Billion in 2025, expected to reach USD 5.3 Billion by 2033. For applications, Brain & Spinal Disorders represent the largest segment, accounting for an estimated USD 3.2 Billion in 2025 and projected to reach USD 5.0 Billion by 2033, owing to the high incidence of stroke and spinal cord injuries. Neuropathy applications are also substantial, valued at USD 1.5 Billion in 2025 and forecast to reach USD 2.8 Billion by 2033.
Key Drivers of Foot Drop Treatment Industry Growth
Several key drivers are propelling the growth of the Foot Drop Treatment industry. Technological advancements, particularly in FES and smart orthotics, are creating more effective and user-friendly solutions. The rising global incidence of neurological conditions like stroke, diabetes-related neuropathy, and spinal cord injuries directly expands the patient population requiring these treatments. Increasing awareness among patients and healthcare providers about the availability and benefits of advanced foot drop therapies is also a significant factor. Furthermore, supportive regulatory environments and evolving reimbursement policies are facilitating market access and adoption of innovative devices. For example, the approval of novel FES systems by regulatory bodies like the USFDA signals a positive trend.
Challenges in the Foot Drop Treatment Industry Sector
Despite promising growth, the Foot Drop Treatment industry faces several challenges. High costs associated with some advanced FES devices and custom orthotics can be a barrier to widespread adoption, particularly in developing economies. Stringent regulatory approval processes, though necessary for patient safety, can prolong time-to-market for new innovations. The need for extensive patient training and rehabilitation to effectively utilize FES devices also presents a logistical challenge. Moreover, competition from alternative treatment modalities and the potential for supply chain disruptions, especially for specialized components, can impact market growth.
Emerging Opportunities in Foot Drop Treatment Industry
Emerging opportunities in the Foot Drop Treatment industry are centered around technological integration and market expansion. The development of more compact, wireless, and AI-powered FES systems presents a significant avenue for growth. Telehealth and remote monitoring solutions can enhance patient support and compliance, expanding the reach of treatment providers. Furthermore, exploring new applications for existing technologies in less common neurological disorders and targeting emerging markets with tailored solutions can unlock substantial growth potential. The increasing focus on personalized medicine also opens doors for highly individualized orthotic and stimulation devices.
Leading Players in the Foot Drop Treatment Industry Market
- Ossur
- Saebo Inc
- Boston Orthotics & Prosthetics
- Ottobock
- Axio Bionics
- Thrive Orthopedics
- Turbomed Orthotics
- Accelerated Care Plus Corporation
- Allard
- Bioness Inc
Key Developments in Foot Drop Treatment Industry Industry
- August 2022: A novel Velcro sleeve designed with electrodes to stimulate leg muscles for individuals with difficulty walking due to nervous system conditions was announced. This device is slated for delivery in 2023, targeting stroke, multiple sclerosis, and cerebral palsy patients.
- March 2022: The United States Food and Drug Administration (USFDA) granted approval for Cionic's lightweight leg-worn Neural Sleeve, a device engineered for analyzing, predicting, and augmenting human movement.
Future Outlook for Foot Drop Treatment Industry Market
The future outlook for the Foot Drop Treatment industry is exceptionally bright, driven by continuous technological innovation and an expanding patient base. The increasing integration of AI and machine learning into wearable assistive devices will lead to more personalized and adaptive treatment solutions. The growth of smart orthotics, coupled with advancements in FES technology, promises to significantly improve functional recovery and independence for individuals affected by neurological conditions. Expansion into emerging markets and the development of more affordable treatment options will further accelerate market penetration. Strategic partnerships between technology developers, healthcare providers, and patient advocacy groups will be crucial in shaping the future landscape, ensuring wider access to these life-changing therapies and solidifying the market's trajectory towards USD 9.8 Billion by 2033.
Foot Drop Treatment Industry Segmentation
-
1. Product Type
- 1.1. Functional Electrical Stimulator
- 1.2. Braces/Splints
-
2. Application
- 2.1. Neuropathy
- 2.2. Muscle Disorders
- 2.3. Brain & Spinal Disorders
Foot Drop Treatment Industry Segmentation By Geography
-
1. North America
- 1.1. United States
- 1.2. Canada
- 1.3. Mexico
-
2. Europe
- 2.1. Germany
- 2.2. United Kingdom
- 2.3. France
- 2.4. Italy
- 2.5. Spain
- 2.6. Rest of Europe
-
3. Asia Pacific
- 3.1. China
- 3.2. Japan
- 3.3. India
- 3.4. Australia
- 3.5. South Korea
- 3.6. Rest of Asia Pacific
-
4. Middle East and Africa
- 4.1. GCC
- 4.2. South Africa
- 4.3. Rest of Middle East and Africa
-
5. South America
- 5.1. Brazil
- 5.2. Argentina
- 5.3. Rest of South America
Foot Drop Treatment Industry REPORT HIGHLIGHTS
| Aspects | Details |
|---|---|
| Study Period | 2019-2033 |
| Base Year | 2024 |
| Estimated Year | 2025 |
| Forecast Period | 2025-2033 |
| Historical Period | 2019-2024 |
| Growth Rate | CAGR of 9.50% from 2019-2033 |
| Segmentation |
|
Table of Contents
- 1. Introduction
- 1.1. Research Scope
- 1.2. Market Segmentation
- 1.3. Research Methodology
- 1.4. Definitions and Assumptions
- 2. Executive Summary
- 2.1. Introduction
- 3. Market Dynamics
- 3.1. Introduction
- 3.2. Market Drivers
- 3.2.1. Growing Burden of Chronic Diseases; Advancements in Products
- 3.3. Market Restrains
- 3.3.1. High Cost of Functional Electrical Stimulators
- 3.4. Market Trends
- 3.4.1. Functional Electrical Stimulator Segment is Expected to Show a Significant Growth Rate in the Foot Drop Treatment Market
- 4. Market Factor Analysis
- 4.1. Porters Five Forces
- 4.2. Supply/Value Chain
- 4.3. PESTEL analysis
- 4.4. Market Entropy
- 4.5. Patent/Trademark Analysis
- 5. Global Foot Drop Treatment Industry Analysis, Insights and Forecast, 2019-2031
- 5.1. Market Analysis, Insights and Forecast - by Product Type
- 5.1.1. Functional Electrical Stimulator
- 5.1.2. Braces/Splints
- 5.2. Market Analysis, Insights and Forecast - by Application
- 5.2.1. Neuropathy
- 5.2.2. Muscle Disorders
- 5.2.3. Brain & Spinal Disorders
- 5.3. Market Analysis, Insights and Forecast - by Region
- 5.3.1. North America
- 5.3.2. Europe
- 5.3.3. Asia Pacific
- 5.3.4. Middle East and Africa
- 5.3.5. South America
- 5.1. Market Analysis, Insights and Forecast - by Product Type
- 6. North America Foot Drop Treatment Industry Analysis, Insights and Forecast, 2019-2031
- 6.1. Market Analysis, Insights and Forecast - by Product Type
- 6.1.1. Functional Electrical Stimulator
- 6.1.2. Braces/Splints
- 6.2. Market Analysis, Insights and Forecast - by Application
- 6.2.1. Neuropathy
- 6.2.2. Muscle Disorders
- 6.2.3. Brain & Spinal Disorders
- 6.1. Market Analysis, Insights and Forecast - by Product Type
- 7. Europe Foot Drop Treatment Industry Analysis, Insights and Forecast, 2019-2031
- 7.1. Market Analysis, Insights and Forecast - by Product Type
- 7.1.1. Functional Electrical Stimulator
- 7.1.2. Braces/Splints
- 7.2. Market Analysis, Insights and Forecast - by Application
- 7.2.1. Neuropathy
- 7.2.2. Muscle Disorders
- 7.2.3. Brain & Spinal Disorders
- 7.1. Market Analysis, Insights and Forecast - by Product Type
- 8. Asia Pacific Foot Drop Treatment Industry Analysis, Insights and Forecast, 2019-2031
- 8.1. Market Analysis, Insights and Forecast - by Product Type
- 8.1.1. Functional Electrical Stimulator
- 8.1.2. Braces/Splints
- 8.2. Market Analysis, Insights and Forecast - by Application
- 8.2.1. Neuropathy
- 8.2.2. Muscle Disorders
- 8.2.3. Brain & Spinal Disorders
- 8.1. Market Analysis, Insights and Forecast - by Product Type
- 9. Middle East and Africa Foot Drop Treatment Industry Analysis, Insights and Forecast, 2019-2031
- 9.1. Market Analysis, Insights and Forecast - by Product Type
- 9.1.1. Functional Electrical Stimulator
- 9.1.2. Braces/Splints
- 9.2. Market Analysis, Insights and Forecast - by Application
- 9.2.1. Neuropathy
- 9.2.2. Muscle Disorders
- 9.2.3. Brain & Spinal Disorders
- 9.1. Market Analysis, Insights and Forecast - by Product Type
- 10. South America Foot Drop Treatment Industry Analysis, Insights and Forecast, 2019-2031
- 10.1. Market Analysis, Insights and Forecast - by Product Type
- 10.1.1. Functional Electrical Stimulator
- 10.1.2. Braces/Splints
- 10.2. Market Analysis, Insights and Forecast - by Application
- 10.2.1. Neuropathy
- 10.2.2. Muscle Disorders
- 10.2.3. Brain & Spinal Disorders
- 10.1. Market Analysis, Insights and Forecast - by Product Type
- 11. North America Foot Drop Treatment Industry Analysis, Insights and Forecast, 2019-2031
- 11.1. Market Analysis, Insights and Forecast - By Country/Sub-region
- 11.1.1 United States
- 11.1.2 Canada
- 11.1.3 Mexico
- 12. Europe Foot Drop Treatment Industry Analysis, Insights and Forecast, 2019-2031
- 12.1. Market Analysis, Insights and Forecast - By Country/Sub-region
- 12.1.1 Germany
- 12.1.2 United Kingdom
- 12.1.3 France
- 12.1.4 Italy
- 12.1.5 Spain
- 12.1.6 Rest of Europe
- 13. Asia Pacific Foot Drop Treatment Industry Analysis, Insights and Forecast, 2019-2031
- 13.1. Market Analysis, Insights and Forecast - By Country/Sub-region
- 13.1.1 China
- 13.1.2 Japan
- 13.1.3 India
- 13.1.4 Australia
- 13.1.5 South Korea
- 13.1.6 Rest of Asia Pacific
- 14. Middle East and Africa Foot Drop Treatment Industry Analysis, Insights and Forecast, 2019-2031
- 14.1. Market Analysis, Insights and Forecast - By Country/Sub-region
- 14.1.1 GCC
- 14.1.2 South Africa
- 14.1.3 Rest of Middle East and Africa
- 15. South America Foot Drop Treatment Industry Analysis, Insights and Forecast, 2019-2031
- 15.1. Market Analysis, Insights and Forecast - By Country/Sub-region
- 15.1.1 Brazil
- 15.1.2 Argentina
- 15.1.3 Rest of South America
- 16. Competitive Analysis
- 16.1. Global Market Share Analysis 2024
- 16.2. Company Profiles
- 16.2.1 Ossur
- 16.2.1.1. Overview
- 16.2.1.2. Products
- 16.2.1.3. SWOT Analysis
- 16.2.1.4. Recent Developments
- 16.2.1.5. Financials (Based on Availability)
- 16.2.2 Saebo Inc
- 16.2.2.1. Overview
- 16.2.2.2. Products
- 16.2.2.3. SWOT Analysis
- 16.2.2.4. Recent Developments
- 16.2.2.5. Financials (Based on Availability)
- 16.2.3 Boston Orthotics & Prosthetics
- 16.2.3.1. Overview
- 16.2.3.2. Products
- 16.2.3.3. SWOT Analysis
- 16.2.3.4. Recent Developments
- 16.2.3.5. Financials (Based on Availability)
- 16.2.4 Ottobock
- 16.2.4.1. Overview
- 16.2.4.2. Products
- 16.2.4.3. SWOT Analysis
- 16.2.4.4. Recent Developments
- 16.2.4.5. Financials (Based on Availability)
- 16.2.5 Axio Bionics
- 16.2.5.1. Overview
- 16.2.5.2. Products
- 16.2.5.3. SWOT Analysis
- 16.2.5.4. Recent Developments
- 16.2.5.5. Financials (Based on Availability)
- 16.2.6 Thrive Orthopedics
- 16.2.6.1. Overview
- 16.2.6.2. Products
- 16.2.6.3. SWOT Analysis
- 16.2.6.4. Recent Developments
- 16.2.6.5. Financials (Based on Availability)
- 16.2.7 Turbomed Orthotics*List Not Exhaustive
- 16.2.7.1. Overview
- 16.2.7.2. Products
- 16.2.7.3. SWOT Analysis
- 16.2.7.4. Recent Developments
- 16.2.7.5. Financials (Based on Availability)
- 16.2.8 Accelerated Care Plus Corporation
- 16.2.8.1. Overview
- 16.2.8.2. Products
- 16.2.8.3. SWOT Analysis
- 16.2.8.4. Recent Developments
- 16.2.8.5. Financials (Based on Availability)
- 16.2.9 Allard
- 16.2.9.1. Overview
- 16.2.9.2. Products
- 16.2.9.3. SWOT Analysis
- 16.2.9.4. Recent Developments
- 16.2.9.5. Financials (Based on Availability)
- 16.2.10 Bioness Inc
- 16.2.10.1. Overview
- 16.2.10.2. Products
- 16.2.10.3. SWOT Analysis
- 16.2.10.4. Recent Developments
- 16.2.10.5. Financials (Based on Availability)
- 16.2.1 Ossur
List of Figures
- Figure 1: Global Foot Drop Treatment Industry Revenue Breakdown (Billion, %) by Region 2024 & 2032
- Figure 2: Global Foot Drop Treatment Industry Volume Breakdown (Piece, %) by Region 2024 & 2032
- Figure 3: North America Foot Drop Treatment Industry Revenue (Billion), by Country 2024 & 2032
- Figure 4: North America Foot Drop Treatment Industry Volume (Piece), by Country 2024 & 2032
- Figure 5: North America Foot Drop Treatment Industry Revenue Share (%), by Country 2024 & 2032
- Figure 6: North America Foot Drop Treatment Industry Volume Share (%), by Country 2024 & 2032
- Figure 7: Europe Foot Drop Treatment Industry Revenue (Billion), by Country 2024 & 2032
- Figure 8: Europe Foot Drop Treatment Industry Volume (Piece), by Country 2024 & 2032
- Figure 9: Europe Foot Drop Treatment Industry Revenue Share (%), by Country 2024 & 2032
- Figure 10: Europe Foot Drop Treatment Industry Volume Share (%), by Country 2024 & 2032
- Figure 11: Asia Pacific Foot Drop Treatment Industry Revenue (Billion), by Country 2024 & 2032
- Figure 12: Asia Pacific Foot Drop Treatment Industry Volume (Piece), by Country 2024 & 2032
- Figure 13: Asia Pacific Foot Drop Treatment Industry Revenue Share (%), by Country 2024 & 2032
- Figure 14: Asia Pacific Foot Drop Treatment Industry Volume Share (%), by Country 2024 & 2032
- Figure 15: Middle East and Africa Foot Drop Treatment Industry Revenue (Billion), by Country 2024 & 2032
- Figure 16: Middle East and Africa Foot Drop Treatment Industry Volume (Piece), by Country 2024 & 2032
- Figure 17: Middle East and Africa Foot Drop Treatment Industry Revenue Share (%), by Country 2024 & 2032
- Figure 18: Middle East and Africa Foot Drop Treatment Industry Volume Share (%), by Country 2024 & 2032
- Figure 19: South America Foot Drop Treatment Industry Revenue (Billion), by Country 2024 & 2032
- Figure 20: South America Foot Drop Treatment Industry Volume (Piece), by Country 2024 & 2032
- Figure 21: South America Foot Drop Treatment Industry Revenue Share (%), by Country 2024 & 2032
- Figure 22: South America Foot Drop Treatment Industry Volume Share (%), by Country 2024 & 2032
- Figure 23: North America Foot Drop Treatment Industry Revenue (Billion), by Product Type 2024 & 2032
- Figure 24: North America Foot Drop Treatment Industry Volume (Piece), by Product Type 2024 & 2032
- Figure 25: North America Foot Drop Treatment Industry Revenue Share (%), by Product Type 2024 & 2032
- Figure 26: North America Foot Drop Treatment Industry Volume Share (%), by Product Type 2024 & 2032
- Figure 27: North America Foot Drop Treatment Industry Revenue (Billion), by Application 2024 & 2032
- Figure 28: North America Foot Drop Treatment Industry Volume (Piece), by Application 2024 & 2032
- Figure 29: North America Foot Drop Treatment Industry Revenue Share (%), by Application 2024 & 2032
- Figure 30: North America Foot Drop Treatment Industry Volume Share (%), by Application 2024 & 2032
- Figure 31: North America Foot Drop Treatment Industry Revenue (Billion), by Country 2024 & 2032
- Figure 32: North America Foot Drop Treatment Industry Volume (Piece), by Country 2024 & 2032
- Figure 33: North America Foot Drop Treatment Industry Revenue Share (%), by Country 2024 & 2032
- Figure 34: North America Foot Drop Treatment Industry Volume Share (%), by Country 2024 & 2032
- Figure 35: Europe Foot Drop Treatment Industry Revenue (Billion), by Product Type 2024 & 2032
- Figure 36: Europe Foot Drop Treatment Industry Volume (Piece), by Product Type 2024 & 2032
- Figure 37: Europe Foot Drop Treatment Industry Revenue Share (%), by Product Type 2024 & 2032
- Figure 38: Europe Foot Drop Treatment Industry Volume Share (%), by Product Type 2024 & 2032
- Figure 39: Europe Foot Drop Treatment Industry Revenue (Billion), by Application 2024 & 2032
- Figure 40: Europe Foot Drop Treatment Industry Volume (Piece), by Application 2024 & 2032
- Figure 41: Europe Foot Drop Treatment Industry Revenue Share (%), by Application 2024 & 2032
- Figure 42: Europe Foot Drop Treatment Industry Volume Share (%), by Application 2024 & 2032
- Figure 43: Europe Foot Drop Treatment Industry Revenue (Billion), by Country 2024 & 2032
- Figure 44: Europe Foot Drop Treatment Industry Volume (Piece), by Country 2024 & 2032
- Figure 45: Europe Foot Drop Treatment Industry Revenue Share (%), by Country 2024 & 2032
- Figure 46: Europe Foot Drop Treatment Industry Volume Share (%), by Country 2024 & 2032
- Figure 47: Asia Pacific Foot Drop Treatment Industry Revenue (Billion), by Product Type 2024 & 2032
- Figure 48: Asia Pacific Foot Drop Treatment Industry Volume (Piece), by Product Type 2024 & 2032
- Figure 49: Asia Pacific Foot Drop Treatment Industry Revenue Share (%), by Product Type 2024 & 2032
- Figure 50: Asia Pacific Foot Drop Treatment Industry Volume Share (%), by Product Type 2024 & 2032
- Figure 51: Asia Pacific Foot Drop Treatment Industry Revenue (Billion), by Application 2024 & 2032
- Figure 52: Asia Pacific Foot Drop Treatment Industry Volume (Piece), by Application 2024 & 2032
- Figure 53: Asia Pacific Foot Drop Treatment Industry Revenue Share (%), by Application 2024 & 2032
- Figure 54: Asia Pacific Foot Drop Treatment Industry Volume Share (%), by Application 2024 & 2032
- Figure 55: Asia Pacific Foot Drop Treatment Industry Revenue (Billion), by Country 2024 & 2032
- Figure 56: Asia Pacific Foot Drop Treatment Industry Volume (Piece), by Country 2024 & 2032
- Figure 57: Asia Pacific Foot Drop Treatment Industry Revenue Share (%), by Country 2024 & 2032
- Figure 58: Asia Pacific Foot Drop Treatment Industry Volume Share (%), by Country 2024 & 2032
- Figure 59: Middle East and Africa Foot Drop Treatment Industry Revenue (Billion), by Product Type 2024 & 2032
- Figure 60: Middle East and Africa Foot Drop Treatment Industry Volume (Piece), by Product Type 2024 & 2032
- Figure 61: Middle East and Africa Foot Drop Treatment Industry Revenue Share (%), by Product Type 2024 & 2032
- Figure 62: Middle East and Africa Foot Drop Treatment Industry Volume Share (%), by Product Type 2024 & 2032
- Figure 63: Middle East and Africa Foot Drop Treatment Industry Revenue (Billion), by Application 2024 & 2032
- Figure 64: Middle East and Africa Foot Drop Treatment Industry Volume (Piece), by Application 2024 & 2032
- Figure 65: Middle East and Africa Foot Drop Treatment Industry Revenue Share (%), by Application 2024 & 2032
- Figure 66: Middle East and Africa Foot Drop Treatment Industry Volume Share (%), by Application 2024 & 2032
- Figure 67: Middle East and Africa Foot Drop Treatment Industry Revenue (Billion), by Country 2024 & 2032
- Figure 68: Middle East and Africa Foot Drop Treatment Industry Volume (Piece), by Country 2024 & 2032
- Figure 69: Middle East and Africa Foot Drop Treatment Industry Revenue Share (%), by Country 2024 & 2032
- Figure 70: Middle East and Africa Foot Drop Treatment Industry Volume Share (%), by Country 2024 & 2032
- Figure 71: South America Foot Drop Treatment Industry Revenue (Billion), by Product Type 2024 & 2032
- Figure 72: South America Foot Drop Treatment Industry Volume (Piece), by Product Type 2024 & 2032
- Figure 73: South America Foot Drop Treatment Industry Revenue Share (%), by Product Type 2024 & 2032
- Figure 74: South America Foot Drop Treatment Industry Volume Share (%), by Product Type 2024 & 2032
- Figure 75: South America Foot Drop Treatment Industry Revenue (Billion), by Application 2024 & 2032
- Figure 76: South America Foot Drop Treatment Industry Volume (Piece), by Application 2024 & 2032
- Figure 77: South America Foot Drop Treatment Industry Revenue Share (%), by Application 2024 & 2032
- Figure 78: South America Foot Drop Treatment Industry Volume Share (%), by Application 2024 & 2032
- Figure 79: South America Foot Drop Treatment Industry Revenue (Billion), by Country 2024 & 2032
- Figure 80: South America Foot Drop Treatment Industry Volume (Piece), by Country 2024 & 2032
- Figure 81: South America Foot Drop Treatment Industry Revenue Share (%), by Country 2024 & 2032
- Figure 82: South America Foot Drop Treatment Industry Volume Share (%), by Country 2024 & 2032
List of Tables
- Table 1: Global Foot Drop Treatment Industry Revenue Billion Forecast, by Region 2019 & 2032
- Table 2: Global Foot Drop Treatment Industry Volume Piece Forecast, by Region 2019 & 2032
- Table 3: Global Foot Drop Treatment Industry Revenue Billion Forecast, by Product Type 2019 & 2032
- Table 4: Global Foot Drop Treatment Industry Volume Piece Forecast, by Product Type 2019 & 2032
- Table 5: Global Foot Drop Treatment Industry Revenue Billion Forecast, by Application 2019 & 2032
- Table 6: Global Foot Drop Treatment Industry Volume Piece Forecast, by Application 2019 & 2032
- Table 7: Global Foot Drop Treatment Industry Revenue Billion Forecast, by Region 2019 & 2032
- Table 8: Global Foot Drop Treatment Industry Volume Piece Forecast, by Region 2019 & 2032
- Table 9: Global Foot Drop Treatment Industry Revenue Billion Forecast, by Country 2019 & 2032
- Table 10: Global Foot Drop Treatment Industry Volume Piece Forecast, by Country 2019 & 2032
- Table 11: United States Foot Drop Treatment Industry Revenue (Billion) Forecast, by Application 2019 & 2032
- Table 12: United States Foot Drop Treatment Industry Volume (Piece) Forecast, by Application 2019 & 2032
- Table 13: Canada Foot Drop Treatment Industry Revenue (Billion) Forecast, by Application 2019 & 2032
- Table 14: Canada Foot Drop Treatment Industry Volume (Piece) Forecast, by Application 2019 & 2032
- Table 15: Mexico Foot Drop Treatment Industry Revenue (Billion) Forecast, by Application 2019 & 2032
- Table 16: Mexico Foot Drop Treatment Industry Volume (Piece) Forecast, by Application 2019 & 2032
- Table 17: Global Foot Drop Treatment Industry Revenue Billion Forecast, by Country 2019 & 2032
- Table 18: Global Foot Drop Treatment Industry Volume Piece Forecast, by Country 2019 & 2032
- Table 19: Germany Foot Drop Treatment Industry Revenue (Billion) Forecast, by Application 2019 & 2032
- Table 20: Germany Foot Drop Treatment Industry Volume (Piece) Forecast, by Application 2019 & 2032
- Table 21: United Kingdom Foot Drop Treatment Industry Revenue (Billion) Forecast, by Application 2019 & 2032
- Table 22: United Kingdom Foot Drop Treatment Industry Volume (Piece) Forecast, by Application 2019 & 2032
- Table 23: France Foot Drop Treatment Industry Revenue (Billion) Forecast, by Application 2019 & 2032
- Table 24: France Foot Drop Treatment Industry Volume (Piece) Forecast, by Application 2019 & 2032
- Table 25: Italy Foot Drop Treatment Industry Revenue (Billion) Forecast, by Application 2019 & 2032
- Table 26: Italy Foot Drop Treatment Industry Volume (Piece) Forecast, by Application 2019 & 2032
- Table 27: Spain Foot Drop Treatment Industry Revenue (Billion) Forecast, by Application 2019 & 2032
- Table 28: Spain Foot Drop Treatment Industry Volume (Piece) Forecast, by Application 2019 & 2032
- Table 29: Rest of Europe Foot Drop Treatment Industry Revenue (Billion) Forecast, by Application 2019 & 2032
- Table 30: Rest of Europe Foot Drop Treatment Industry Volume (Piece) Forecast, by Application 2019 & 2032
- Table 31: Global Foot Drop Treatment Industry Revenue Billion Forecast, by Country 2019 & 2032
- Table 32: Global Foot Drop Treatment Industry Volume Piece Forecast, by Country 2019 & 2032
- Table 33: China Foot Drop Treatment Industry Revenue (Billion) Forecast, by Application 2019 & 2032
- Table 34: China Foot Drop Treatment Industry Volume (Piece) Forecast, by Application 2019 & 2032
- Table 35: Japan Foot Drop Treatment Industry Revenue (Billion) Forecast, by Application 2019 & 2032
- Table 36: Japan Foot Drop Treatment Industry Volume (Piece) Forecast, by Application 2019 & 2032
- Table 37: India Foot Drop Treatment Industry Revenue (Billion) Forecast, by Application 2019 & 2032
- Table 38: India Foot Drop Treatment Industry Volume (Piece) Forecast, by Application 2019 & 2032
- Table 39: Australia Foot Drop Treatment Industry Revenue (Billion) Forecast, by Application 2019 & 2032
- Table 40: Australia Foot Drop Treatment Industry Volume (Piece) Forecast, by Application 2019 & 2032
- Table 41: South Korea Foot Drop Treatment Industry Revenue (Billion) Forecast, by Application 2019 & 2032
- Table 42: South Korea Foot Drop Treatment Industry Volume (Piece) Forecast, by Application 2019 & 2032
- Table 43: Rest of Asia Pacific Foot Drop Treatment Industry Revenue (Billion) Forecast, by Application 2019 & 2032
- Table 44: Rest of Asia Pacific Foot Drop Treatment Industry Volume (Piece) Forecast, by Application 2019 & 2032
- Table 45: Global Foot Drop Treatment Industry Revenue Billion Forecast, by Country 2019 & 2032
- Table 46: Global Foot Drop Treatment Industry Volume Piece Forecast, by Country 2019 & 2032
- Table 47: GCC Foot Drop Treatment Industry Revenue (Billion) Forecast, by Application 2019 & 2032
- Table 48: GCC Foot Drop Treatment Industry Volume (Piece) Forecast, by Application 2019 & 2032
- Table 49: South Africa Foot Drop Treatment Industry Revenue (Billion) Forecast, by Application 2019 & 2032
- Table 50: South Africa Foot Drop Treatment Industry Volume (Piece) Forecast, by Application 2019 & 2032
- Table 51: Rest of Middle East and Africa Foot Drop Treatment Industry Revenue (Billion) Forecast, by Application 2019 & 2032
- Table 52: Rest of Middle East and Africa Foot Drop Treatment Industry Volume (Piece) Forecast, by Application 2019 & 2032
- Table 53: Global Foot Drop Treatment Industry Revenue Billion Forecast, by Country 2019 & 2032
- Table 54: Global Foot Drop Treatment Industry Volume Piece Forecast, by Country 2019 & 2032
- Table 55: Brazil Foot Drop Treatment Industry Revenue (Billion) Forecast, by Application 2019 & 2032
- Table 56: Brazil Foot Drop Treatment Industry Volume (Piece) Forecast, by Application 2019 & 2032
- Table 57: Argentina Foot Drop Treatment Industry Revenue (Billion) Forecast, by Application 2019 & 2032
- Table 58: Argentina Foot Drop Treatment Industry Volume (Piece) Forecast, by Application 2019 & 2032
- Table 59: Rest of South America Foot Drop Treatment Industry Revenue (Billion) Forecast, by Application 2019 & 2032
- Table 60: Rest of South America Foot Drop Treatment Industry Volume (Piece) Forecast, by Application 2019 & 2032
- Table 61: Global Foot Drop Treatment Industry Revenue Billion Forecast, by Product Type 2019 & 2032
- Table 62: Global Foot Drop Treatment Industry Volume Piece Forecast, by Product Type 2019 & 2032
- Table 63: Global Foot Drop Treatment Industry Revenue Billion Forecast, by Application 2019 & 2032
- Table 64: Global Foot Drop Treatment Industry Volume Piece Forecast, by Application 2019 & 2032
- Table 65: Global Foot Drop Treatment Industry Revenue Billion Forecast, by Country 2019 & 2032
- Table 66: Global Foot Drop Treatment Industry Volume Piece Forecast, by Country 2019 & 2032
- Table 67: United States Foot Drop Treatment Industry Revenue (Billion) Forecast, by Application 2019 & 2032
- Table 68: United States Foot Drop Treatment Industry Volume (Piece) Forecast, by Application 2019 & 2032
- Table 69: Canada Foot Drop Treatment Industry Revenue (Billion) Forecast, by Application 2019 & 2032
- Table 70: Canada Foot Drop Treatment Industry Volume (Piece) Forecast, by Application 2019 & 2032
- Table 71: Mexico Foot Drop Treatment Industry Revenue (Billion) Forecast, by Application 2019 & 2032
- Table 72: Mexico Foot Drop Treatment Industry Volume (Piece) Forecast, by Application 2019 & 2032
- Table 73: Global Foot Drop Treatment Industry Revenue Billion Forecast, by Product Type 2019 & 2032
- Table 74: Global Foot Drop Treatment Industry Volume Piece Forecast, by Product Type 2019 & 2032
- Table 75: Global Foot Drop Treatment Industry Revenue Billion Forecast, by Application 2019 & 2032
- Table 76: Global Foot Drop Treatment Industry Volume Piece Forecast, by Application 2019 & 2032
- Table 77: Global Foot Drop Treatment Industry Revenue Billion Forecast, by Country 2019 & 2032
- Table 78: Global Foot Drop Treatment Industry Volume Piece Forecast, by Country 2019 & 2032
- Table 79: Germany Foot Drop Treatment Industry Revenue (Billion) Forecast, by Application 2019 & 2032
- Table 80: Germany Foot Drop Treatment Industry Volume (Piece) Forecast, by Application 2019 & 2032
- Table 81: United Kingdom Foot Drop Treatment Industry Revenue (Billion) Forecast, by Application 2019 & 2032
- Table 82: United Kingdom Foot Drop Treatment Industry Volume (Piece) Forecast, by Application 2019 & 2032
- Table 83: France Foot Drop Treatment Industry Revenue (Billion) Forecast, by Application 2019 & 2032
- Table 84: France Foot Drop Treatment Industry Volume (Piece) Forecast, by Application 2019 & 2032
- Table 85: Italy Foot Drop Treatment Industry Revenue (Billion) Forecast, by Application 2019 & 2032
- Table 86: Italy Foot Drop Treatment Industry Volume (Piece) Forecast, by Application 2019 & 2032
- Table 87: Spain Foot Drop Treatment Industry Revenue (Billion) Forecast, by Application 2019 & 2032
- Table 88: Spain Foot Drop Treatment Industry Volume (Piece) Forecast, by Application 2019 & 2032
- Table 89: Rest of Europe Foot Drop Treatment Industry Revenue (Billion) Forecast, by Application 2019 & 2032
- Table 90: Rest of Europe Foot Drop Treatment Industry Volume (Piece) Forecast, by Application 2019 & 2032
- Table 91: Global Foot Drop Treatment Industry Revenue Billion Forecast, by Product Type 2019 & 2032
- Table 92: Global Foot Drop Treatment Industry Volume Piece Forecast, by Product Type 2019 & 2032
- Table 93: Global Foot Drop Treatment Industry Revenue Billion Forecast, by Application 2019 & 2032
- Table 94: Global Foot Drop Treatment Industry Volume Piece Forecast, by Application 2019 & 2032
- Table 95: Global Foot Drop Treatment Industry Revenue Billion Forecast, by Country 2019 & 2032
- Table 96: Global Foot Drop Treatment Industry Volume Piece Forecast, by Country 2019 & 2032
- Table 97: China Foot Drop Treatment Industry Revenue (Billion) Forecast, by Application 2019 & 2032
- Table 98: China Foot Drop Treatment Industry Volume (Piece) Forecast, by Application 2019 & 2032
- Table 99: Japan Foot Drop Treatment Industry Revenue (Billion) Forecast, by Application 2019 & 2032
- Table 100: Japan Foot Drop Treatment Industry Volume (Piece) Forecast, by Application 2019 & 2032
- Table 101: India Foot Drop Treatment Industry Revenue (Billion) Forecast, by Application 2019 & 2032
- Table 102: India Foot Drop Treatment Industry Volume (Piece) Forecast, by Application 2019 & 2032
- Table 103: Australia Foot Drop Treatment Industry Revenue (Billion) Forecast, by Application 2019 & 2032
- Table 104: Australia Foot Drop Treatment Industry Volume (Piece) Forecast, by Application 2019 & 2032
- Table 105: South Korea Foot Drop Treatment Industry Revenue (Billion) Forecast, by Application 2019 & 2032
- Table 106: South Korea Foot Drop Treatment Industry Volume (Piece) Forecast, by Application 2019 & 2032
- Table 107: Rest of Asia Pacific Foot Drop Treatment Industry Revenue (Billion) Forecast, by Application 2019 & 2032
- Table 108: Rest of Asia Pacific Foot Drop Treatment Industry Volume (Piece) Forecast, by Application 2019 & 2032
- Table 109: Global Foot Drop Treatment Industry Revenue Billion Forecast, by Product Type 2019 & 2032
- Table 110: Global Foot Drop Treatment Industry Volume Piece Forecast, by Product Type 2019 & 2032
- Table 111: Global Foot Drop Treatment Industry Revenue Billion Forecast, by Application 2019 & 2032
- Table 112: Global Foot Drop Treatment Industry Volume Piece Forecast, by Application 2019 & 2032
- Table 113: Global Foot Drop Treatment Industry Revenue Billion Forecast, by Country 2019 & 2032
- Table 114: Global Foot Drop Treatment Industry Volume Piece Forecast, by Country 2019 & 2032
- Table 115: GCC Foot Drop Treatment Industry Revenue (Billion) Forecast, by Application 2019 & 2032
- Table 116: GCC Foot Drop Treatment Industry Volume (Piece) Forecast, by Application 2019 & 2032
- Table 117: South Africa Foot Drop Treatment Industry Revenue (Billion) Forecast, by Application 2019 & 2032
- Table 118: South Africa Foot Drop Treatment Industry Volume (Piece) Forecast, by Application 2019 & 2032
- Table 119: Rest of Middle East and Africa Foot Drop Treatment Industry Revenue (Billion) Forecast, by Application 2019 & 2032
- Table 120: Rest of Middle East and Africa Foot Drop Treatment Industry Volume (Piece) Forecast, by Application 2019 & 2032
- Table 121: Global Foot Drop Treatment Industry Revenue Billion Forecast, by Product Type 2019 & 2032
- Table 122: Global Foot Drop Treatment Industry Volume Piece Forecast, by Product Type 2019 & 2032
- Table 123: Global Foot Drop Treatment Industry Revenue Billion Forecast, by Application 2019 & 2032
- Table 124: Global Foot Drop Treatment Industry Volume Piece Forecast, by Application 2019 & 2032
- Table 125: Global Foot Drop Treatment Industry Revenue Billion Forecast, by Country 2019 & 2032
- Table 126: Global Foot Drop Treatment Industry Volume Piece Forecast, by Country 2019 & 2032
- Table 127: Brazil Foot Drop Treatment Industry Revenue (Billion) Forecast, by Application 2019 & 2032
- Table 128: Brazil Foot Drop Treatment Industry Volume (Piece) Forecast, by Application 2019 & 2032
- Table 129: Argentina Foot Drop Treatment Industry Revenue (Billion) Forecast, by Application 2019 & 2032
- Table 130: Argentina Foot Drop Treatment Industry Volume (Piece) Forecast, by Application 2019 & 2032
- Table 131: Rest of South America Foot Drop Treatment Industry Revenue (Billion) Forecast, by Application 2019 & 2032
- Table 132: Rest of South America Foot Drop Treatment Industry Volume (Piece) Forecast, by Application 2019 & 2032
Frequently Asked Questions
1. What is the projected Compound Annual Growth Rate (CAGR) of the Foot Drop Treatment Industry?
The projected CAGR is approximately 9.50%.
2. Which companies are prominent players in the Foot Drop Treatment Industry?
Key companies in the market include Ossur, Saebo Inc, Boston Orthotics & Prosthetics, Ottobock, Axio Bionics, Thrive Orthopedics, Turbomed Orthotics*List Not Exhaustive, Accelerated Care Plus Corporation, Allard, Bioness Inc.
3. What are the main segments of the Foot Drop Treatment Industry?
The market segments include Product Type, Application.
4. Can you provide details about the market size?
The market size is estimated to be USD 4 Billion as of 2022.
5. What are some drivers contributing to market growth?
Growing Burden of Chronic Diseases; Advancements in Products.
6. What are the notable trends driving market growth?
Functional Electrical Stimulator Segment is Expected to Show a Significant Growth Rate in the Foot Drop Treatment Market.
7. Are there any restraints impacting market growth?
High Cost of Functional Electrical Stimulators.
8. Can you provide examples of recent developments in the market?
As per the news published in August 2022, a Velcro sleeve fastened around the leg has been designed with electrodes that help stimulate the muscles of those who experience difficulty getting around due to nervous system conditions. This device will be ready for delivery to those who have experienced a stroke, or have multiple sclerosis or cerebral palsy, in 2023.
9. What pricing options are available for accessing the report?
Pricing options include single-user, multi-user, and enterprise licenses priced at USD 4750, USD 5250, and USD 8750 respectively.
10. Is the market size provided in terms of value or volume?
The market size is provided in terms of value, measured in Billion and volume, measured in Piece.
11. Are there any specific market keywords associated with the report?
Yes, the market keyword associated with the report is "Foot Drop Treatment Industry," which aids in identifying and referencing the specific market segment covered.
12. How do I determine which pricing option suits my needs best?
The pricing options vary based on user requirements and access needs. Individual users may opt for single-user licenses, while businesses requiring broader access may choose multi-user or enterprise licenses for cost-effective access to the report.
13. Are there any additional resources or data provided in the Foot Drop Treatment Industry report?
While the report offers comprehensive insights, it's advisable to review the specific contents or supplementary materials provided to ascertain if additional resources or data are available.
14. How can I stay updated on further developments or reports in the Foot Drop Treatment Industry?
To stay informed about further developments, trends, and reports in the Foot Drop Treatment Industry, consider subscribing to industry newsletters, following relevant companies and organizations, or regularly checking reputable industry news sources and publications.
Methodology
Step 1 - Identification of Relevant Samples Size from Population Database


Step 2 - Approaches for Defining Global Market Size (Value, Volume* & Price*)

Note*: In applicable scenarios
Step 3 - Data Sources
Primary Research
- Web Analytics
- Survey Reports
- Research Institute
- Latest Research Reports
- Opinion Leaders
Secondary Research
- Annual Reports
- White Paper
- Latest Press Release
- Industry Association
- Paid Database
- Investor Presentations

Step 4 - Data Triangulation
Involves using different sources of information in order to increase the validity of a study
These sources are likely to be stakeholders in a program - participants, other researchers, program staff, other community members, and so on.
Then we put all data in single framework & apply various statistical tools to find out the dynamic on the market.
During the analysis stage, feedback from the stakeholder groups would be compared to determine areas of agreement as well as areas of divergence


