
Key Insights
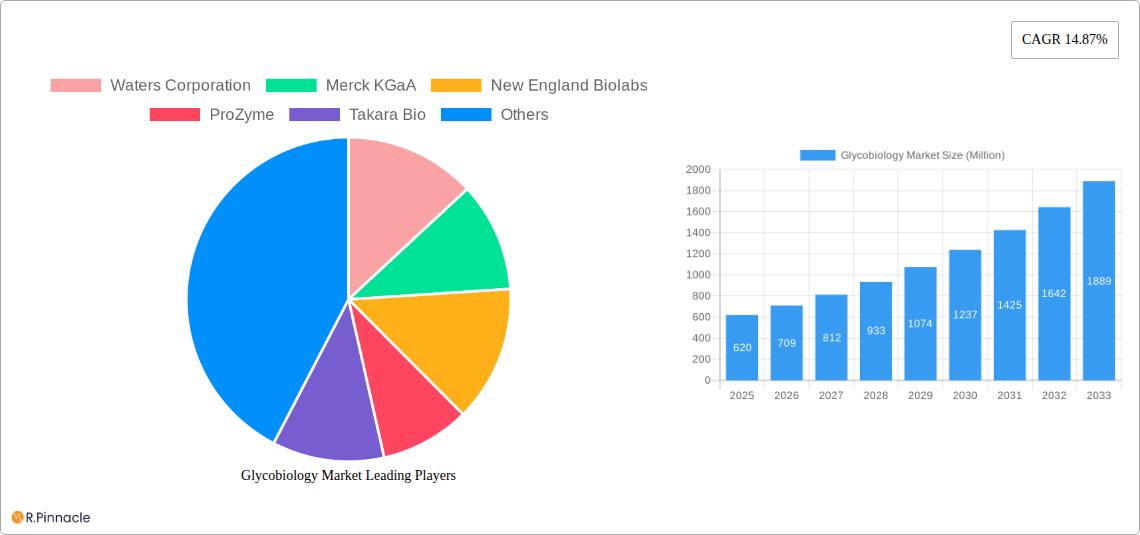
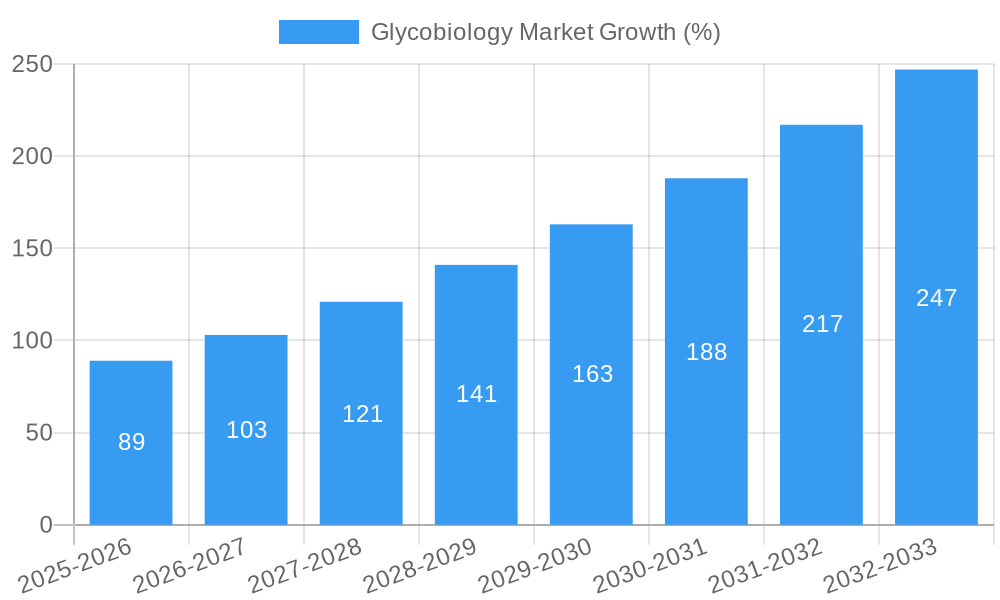
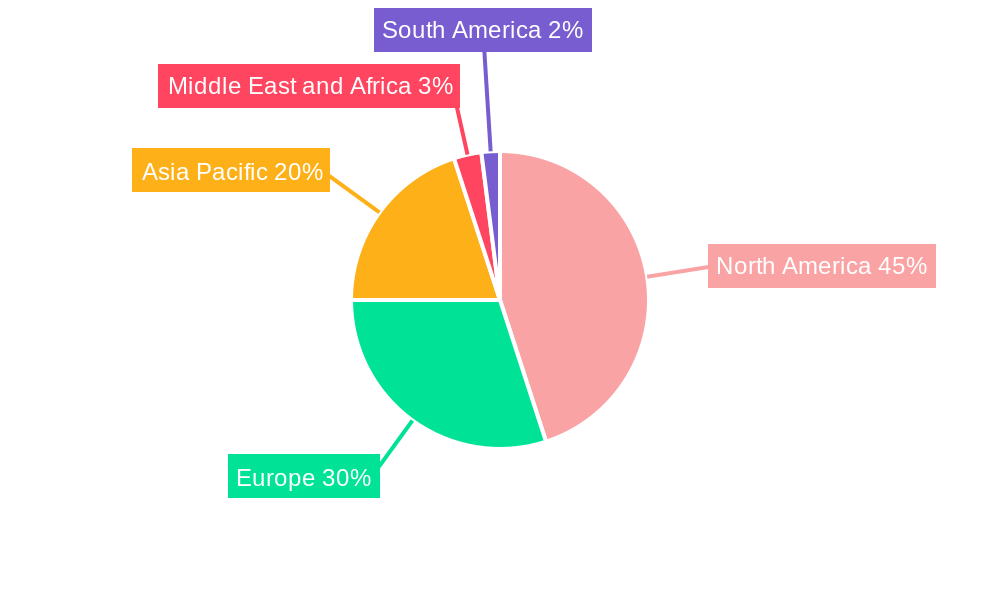
The glycobiology market, valued at $0.62 billion in 2025, is poised for significant growth, exhibiting a Compound Annual Growth Rate (CAGR) of 14.87% from 2025 to 2033. This robust expansion is driven by several key factors. The increasing prevalence of chronic diseases like cancer and autoimmune disorders fuels demand for advanced diagnostic tools and therapeutic interventions based on glycobiology research. Furthermore, the burgeoning pharmaceutical and biotechnology industries are actively investing in glycobiology-related research and development, leading to the introduction of innovative drugs and diagnostic kits. Advancements in technologies like mass spectrometry and glycomics are also contributing to market growth, enabling more precise and efficient analysis of glycans and their biological functions. The market is segmented by product (enzymes, instruments, kits, and reagents), application (diagnostics, drug discovery, oncology, immunology, and other applications), and end-user (pharmaceutical and biotechnology companies, contract research organizations, and other end-users). North America currently holds a dominant market share, owing to the presence of well-established research institutions and pharmaceutical companies, coupled with substantial funding for biomedical research. However, the Asia-Pacific region is projected to witness the fastest growth rate due to increasing healthcare expenditure and a rising prevalence of target diseases.
The competitive landscape is characterized by both large multinational corporations and specialized biotechnology companies. Key players such as Waters Corporation, Merck KGaA, New England Biolabs, and Thermo Fisher Scientific are driving innovation and expanding their product portfolios to cater to the growing market demand. However, challenges remain, including the high cost of advanced glycobiology technologies and the complexity of glycan analysis. Nevertheless, ongoing research and development efforts, coupled with increasing collaborations between academia and industry, are expected to overcome these hurdles, paving the way for continued market expansion in the forecast period. The global glycobiology market is anticipated to reach approximately $2.3 Billion by 2033 based on the given CAGR of 14.87% and a 2025 market value of $0.62 Billion.
This in-depth report provides a comprehensive analysis of the Glycobiology Market, offering invaluable insights for industry professionals, investors, and strategic decision-makers. With a meticulous study period spanning from 2019 to 2033 (Base Year: 2025, Estimated Year: 2025, Forecast Period: 2025-2033, Historical Period: 2019-2024), this report unveils the market's current dynamics, future trends, and key growth drivers. The market is projected to reach xx Million by 2033, exhibiting a significant CAGR of xx%.
Glycobiology Market Market Structure & Innovation Trends
The Glycobiology market exhibits a moderately consolidated structure, with key players like Waters Corporation, Merck KGaA, and Thermo Fisher Scientific holding significant market share. Market concentration is estimated at xx% in 2025, indicating room for both established players and emerging companies. Innovation is driven by advancements in mass spectrometry, high-throughput screening technologies, and the development of novel reagents and kits. Stringent regulatory frameworks, particularly concerning the approval of new therapeutics developed using glycobiology techniques, play a crucial role. Product substitutes, such as traditional antibody-based diagnostics, pose a competitive challenge, although the advantages of glycobiology in precision medicine are mitigating this. End-user demographics are dominated by pharmaceutical and biotechnology companies, with growing adoption by Contract Research Organizations (CROs). M&A activity within the glycobiology sector has been moderate, with deal values averaging xx Million in recent years. For example, strategic partnerships are frequently employed to expand market reach and enhance product portfolios.
Glycobiology Market Market Dynamics & Trends
The Glycobiology market is experiencing robust growth, primarily fueled by the increasing demand for personalized medicine, the rising prevalence of chronic diseases, and the development of advanced analytical techniques. Technological disruptions, such as the advent of novel mass spectrometry platforms, are revolutionizing the field, enhancing sensitivity, speed, and throughput. Consumer preferences are shifting towards more targeted and efficacious therapeutics, fueling investment in glycobiology-based drug development. Competitive dynamics are shaping the market through strategic partnerships, product innovations, and the development of novel biomarkers. The market’s CAGR during the forecast period is expected to be xx%, with a market penetration rate of approximately xx% by 2033. Factors such as increased R&D spending, coupled with rising governmental support for life sciences research further accelerate market expansion.
Dominant Regions & Segments in Glycobiology Market
- Leading Region: North America currently holds the largest market share due to the high concentration of pharmaceutical and biotechnology companies, robust research infrastructure, and advanced healthcare systems.
- Leading Country: The United States dominates the global Glycobiology market due to factors such as high R&D investments and increased funding for research and development of glycobiology-based therapies.
- Leading Product Segment: Kits and Reagents command the largest market share driven by the ease of use and cost-effectiveness.
- Leading Application Segment: Drug Discovery and Development dominates the application segment due to the significant advancements in utilizing glycobiology techniques to develop novel drugs and targeted therapies.
- Leading End-User Segment: Pharmaceutical and Biotechnology Companies account for the major share of the market, owing to the increased adoption of advanced technologies in their research and development processes.
Key drivers for regional dominance include supportive government policies promoting biotechnology and pharma research, a robust intellectual property ecosystem, and the availability of skilled labor. Europe and Asia Pacific show significant growth potential due to increasing healthcare spending and the rise of emerging economies.
Glycobiology Market Product Innovations
Recent product developments focus on enhancing the sensitivity and throughput of analytical techniques, integrating multi-omics approaches, and developing novel reagents with improved specificity. These innovations are driven by the need for high-throughput screening platforms and advanced bioinformatics solutions to process vast amounts of data generated by these techniques. The market trend favors integrated platforms combining multiple analytical techniques to provide holistic insights into glycosylation patterns. This approach offers considerable advantages in biomarker discovery and drug development, enhancing market competitiveness.
Report Scope & Segmentation Analysis
This report segments the Glycobiology market by:
Product: Enzymes, Instruments, Kits and Reagents. The growth of the kits and reagents segment is mainly propelled by the rising demand for cost-effective and high-throughput screening assays.
Application: Diagnostics, Drug Discovery and Development, Oncology, Immunology, Other Applications. Oncology and Drug Discovery and Development segments are experiencing significant growth due to increasing prevalence of cancer and chronic diseases.
End User: Pharmaceutical and Biotechnology Companies, Contract Research Organizations (CROs), Other End Users. The pharmaceutical and biotechnology companies are expected to fuel the growth of this market segment.
Key Drivers of Glycobiology Market Growth
The Glycobiology market is propelled by several key factors: the rising prevalence of chronic diseases requiring sophisticated diagnostic and therapeutic approaches, increasing investments in R&D by major pharmaceutical and biotech firms, advancements in mass spectrometry and other analytical technologies enabling high-throughput screening and improved accuracy, and government initiatives funding research into the clinical applications of glycobiology. Furthermore, growing awareness among scientists of the critical roles of glycosylation in disease pathogenesis stimulates innovations in the field.
Challenges in the Glycobiology Market Sector
The Glycobiology market faces hurdles such as the high cost of advanced analytical instruments and reagents, complex regulatory pathways for approval of new glycobiology-based therapeutics, and the shortage of skilled professionals experienced in glycobiology research and development. Supply chain disruptions can also influence the availability of essential reagents and instrument components, adding another layer of complexity and potentially hindering market expansion. The competitive landscape, with both established players and emerging companies, adds to the challenges. These challenges limit the widespread adoption and commercialization of glycobiology-based solutions and represent significant barriers to market growth.
Emerging Opportunities in Glycobiology Market
Emerging opportunities lie in the development of novel therapeutic approaches based on glycobiology principles, the expansion of applications into areas such as personalized medicine and diagnostics, and the integration of multi-omics analysis for comprehensive characterization of glycosylation patterns. The rising prevalence of chronic diseases and the growing need for personalized medicine are expected to unlock new markets and drive innovation in glycobiology. This translates into considerable market expansion prospects in the coming decade.
Leading Players in the Glycobiology Market Market
- Waters Corporation
- Merck KGaA
- New England Biolabs
- ProZyme
- Takara Bio
- Danaher Corporation
- Thermo Fisher Scientific
- Bruker Corporation
- Agilent Technologies
- Shimadzu Corporation
Key Developments in Glycobiology Market Industry
- June 2022: Thermo Fisher Scientific announced a co-marketing agreement with TransMIT GmbH to promote mass spectrometry imaging (MSI) for spatial multi-omics applications.
- April 2022: Bruker launched a MALDI HiPLEX-IHC tissue imaging solution for timsTOF flex, integrating lipidomics, glycomics, and metabolomics.
Future Outlook for Glycobiology Market Market
The Glycobiology market is poised for substantial growth, driven by continuous technological advancements, expanding applications in drug discovery and diagnostics, and increasing research funding. The development of more efficient and cost-effective analytical techniques, along with the growing understanding of glycosylation's role in disease, will further propel market expansion. Strategic partnerships and acquisitions are anticipated to reshape the competitive landscape, stimulating further innovation and accelerating market growth.
Glycobiology Market Segmentation
-
1. Product
- 1.1. Enzymes
- 1.2. Instruments
- 1.3. Kits and Reagents
-
2. Application
- 2.1. Diagnostics
- 2.2. Drug Discovery and Development
- 2.3. Oncology
- 2.4. Immunology
- 2.5. Other Applications
-
3. End User
- 3.1. Pharmaceutical and Biotechnology Companies
- 3.2. Contract Research Organizations
- 3.3. Other End Users
Glycobiology Market Segmentation By Geography
-
1. North America
- 1.1. United States
- 1.2. Canada
- 1.3. Mexico
-
2. Europe
- 2.1. Germany
- 2.2. United Kingdom
- 2.3. France
- 2.4. Italy
- 2.5. Spain
- 2.6. Rest of Europe
-
3. Asia Pacific
- 3.1. China
- 3.2. Japan
- 3.3. India
- 3.4. Australia
- 3.5. South Korea
- 3.6. Rest of Asia Pacific
-
4. Middle East and Africa
- 4.1. GCC
- 4.2. South Africa
- 4.3. Rest of Middle East and Africa
-
5. South America
- 5.1. Brazil
- 5.2. Argentina
- 5.3. Rest of South America
Glycobiology Market REPORT HIGHLIGHTS
| Aspects | Details |
|---|---|
| Study Period | 2019-2033 |
| Base Year | 2024 |
| Estimated Year | 2025 |
| Forecast Period | 2025-2033 |
| Historical Period | 2019-2024 |
| Growth Rate | CAGR of 14.87% from 2019-2033 |
| Segmentation |
|
Table of Contents
- 1. Introduction
- 1.1. Research Scope
- 1.2. Market Segmentation
- 1.3. Research Methodology
- 1.4. Definitions and Assumptions
- 2. Executive Summary
- 2.1. Introduction
- 3. Market Dynamics
- 3.1. Introduction
- 3.2. Market Drivers
- 3.2.1. Increasing Government and Private Funding for Glycomics and Proteomics Research; Growing R&D Expenditures by Pharmaceutical and Biotechnology Companies
- 3.3. Market Restrains
- 3.3.1. High Product Cost; Low Availability of Skilled Professionals
- 3.4. Market Trends
- 3.4.1. Drug Discovery and Development is Expected to be the Largest Growing Segment
- 4. Market Factor Analysis
- 4.1. Porters Five Forces
- 4.2. Supply/Value Chain
- 4.3. PESTEL analysis
- 4.4. Market Entropy
- 4.5. Patent/Trademark Analysis
- 5. Global Glycobiology Market Analysis, Insights and Forecast, 2019-2031
- 5.1. Market Analysis, Insights and Forecast - by Product
- 5.1.1. Enzymes
- 5.1.2. Instruments
- 5.1.3. Kits and Reagents
- 5.2. Market Analysis, Insights and Forecast - by Application
- 5.2.1. Diagnostics
- 5.2.2. Drug Discovery and Development
- 5.2.3. Oncology
- 5.2.4. Immunology
- 5.2.5. Other Applications
- 5.3. Market Analysis, Insights and Forecast - by End User
- 5.3.1. Pharmaceutical and Biotechnology Companies
- 5.3.2. Contract Research Organizations
- 5.3.3. Other End Users
- 5.4. Market Analysis, Insights and Forecast - by Region
- 5.4.1. North America
- 5.4.2. Europe
- 5.4.3. Asia Pacific
- 5.4.4. Middle East and Africa
- 5.4.5. South America
- 5.1. Market Analysis, Insights and Forecast - by Product
- 6. North America Glycobiology Market Analysis, Insights and Forecast, 2019-2031
- 6.1. Market Analysis, Insights and Forecast - by Product
- 6.1.1. Enzymes
- 6.1.2. Instruments
- 6.1.3. Kits and Reagents
- 6.2. Market Analysis, Insights and Forecast - by Application
- 6.2.1. Diagnostics
- 6.2.2. Drug Discovery and Development
- 6.2.3. Oncology
- 6.2.4. Immunology
- 6.2.5. Other Applications
- 6.3. Market Analysis, Insights and Forecast - by End User
- 6.3.1. Pharmaceutical and Biotechnology Companies
- 6.3.2. Contract Research Organizations
- 6.3.3. Other End Users
- 6.1. Market Analysis, Insights and Forecast - by Product
- 7. Europe Glycobiology Market Analysis, Insights and Forecast, 2019-2031
- 7.1. Market Analysis, Insights and Forecast - by Product
- 7.1.1. Enzymes
- 7.1.2. Instruments
- 7.1.3. Kits and Reagents
- 7.2. Market Analysis, Insights and Forecast - by Application
- 7.2.1. Diagnostics
- 7.2.2. Drug Discovery and Development
- 7.2.3. Oncology
- 7.2.4. Immunology
- 7.2.5. Other Applications
- 7.3. Market Analysis, Insights and Forecast - by End User
- 7.3.1. Pharmaceutical and Biotechnology Companies
- 7.3.2. Contract Research Organizations
- 7.3.3. Other End Users
- 7.1. Market Analysis, Insights and Forecast - by Product
- 8. Asia Pacific Glycobiology Market Analysis, Insights and Forecast, 2019-2031
- 8.1. Market Analysis, Insights and Forecast - by Product
- 8.1.1. Enzymes
- 8.1.2. Instruments
- 8.1.3. Kits and Reagents
- 8.2. Market Analysis, Insights and Forecast - by Application
- 8.2.1. Diagnostics
- 8.2.2. Drug Discovery and Development
- 8.2.3. Oncology
- 8.2.4. Immunology
- 8.2.5. Other Applications
- 8.3. Market Analysis, Insights and Forecast - by End User
- 8.3.1. Pharmaceutical and Biotechnology Companies
- 8.3.2. Contract Research Organizations
- 8.3.3. Other End Users
- 8.1. Market Analysis, Insights and Forecast - by Product
- 9. Middle East and Africa Glycobiology Market Analysis, Insights and Forecast, 2019-2031
- 9.1. Market Analysis, Insights and Forecast - by Product
- 9.1.1. Enzymes
- 9.1.2. Instruments
- 9.1.3. Kits and Reagents
- 9.2. Market Analysis, Insights and Forecast - by Application
- 9.2.1. Diagnostics
- 9.2.2. Drug Discovery and Development
- 9.2.3. Oncology
- 9.2.4. Immunology
- 9.2.5. Other Applications
- 9.3. Market Analysis, Insights and Forecast - by End User
- 9.3.1. Pharmaceutical and Biotechnology Companies
- 9.3.2. Contract Research Organizations
- 9.3.3. Other End Users
- 9.1. Market Analysis, Insights and Forecast - by Product
- 10. South America Glycobiology Market Analysis, Insights and Forecast, 2019-2031
- 10.1. Market Analysis, Insights and Forecast - by Product
- 10.1.1. Enzymes
- 10.1.2. Instruments
- 10.1.3. Kits and Reagents
- 10.2. Market Analysis, Insights and Forecast - by Application
- 10.2.1. Diagnostics
- 10.2.2. Drug Discovery and Development
- 10.2.3. Oncology
- 10.2.4. Immunology
- 10.2.5. Other Applications
- 10.3. Market Analysis, Insights and Forecast - by End User
- 10.3.1. Pharmaceutical and Biotechnology Companies
- 10.3.2. Contract Research Organizations
- 10.3.3. Other End Users
- 10.1. Market Analysis, Insights and Forecast - by Product
- 11. North America Glycobiology Market Analysis, Insights and Forecast, 2019-2031
- 11.1. Market Analysis, Insights and Forecast - By Country/Sub-region
- 11.1.1 United States
- 11.1.2 Canada
- 11.1.3 Mexico
- 12. Europe Glycobiology Market Analysis, Insights and Forecast, 2019-2031
- 12.1. Market Analysis, Insights and Forecast - By Country/Sub-region
- 12.1.1 Germany
- 12.1.2 United Kingdom
- 12.1.3 France
- 12.1.4 Italy
- 12.1.5 Spain
- 12.1.6 Rest of Europe
- 13. Asia Pacific Glycobiology Market Analysis, Insights and Forecast, 2019-2031
- 13.1. Market Analysis, Insights and Forecast - By Country/Sub-region
- 13.1.1 China
- 13.1.2 Japan
- 13.1.3 India
- 13.1.4 Australia
- 13.1.5 South Korea
- 13.1.6 Rest of Asia Pacific
- 14. Middle East and Africa Glycobiology Market Analysis, Insights and Forecast, 2019-2031
- 14.1. Market Analysis, Insights and Forecast - By Country/Sub-region
- 14.1.1 GCC
- 14.1.2 South Africa
- 14.1.3 Rest of Middle East and Africa
- 15. South America Glycobiology Market Analysis, Insights and Forecast, 2019-2031
- 15.1. Market Analysis, Insights and Forecast - By Country/Sub-region
- 15.1.1 Brazil
- 15.1.2 Argentina
- 15.1.3 Rest of South America
- 16. Competitive Analysis
- 16.1. Global Market Share Analysis 2024
- 16.2. Company Profiles
- 16.2.1 Waters Corporation
- 16.2.1.1. Overview
- 16.2.1.2. Products
- 16.2.1.3. SWOT Analysis
- 16.2.1.4. Recent Developments
- 16.2.1.5. Financials (Based on Availability)
- 16.2.2 Merck KGaA
- 16.2.2.1. Overview
- 16.2.2.2. Products
- 16.2.2.3. SWOT Analysis
- 16.2.2.4. Recent Developments
- 16.2.2.5. Financials (Based on Availability)
- 16.2.3 New England Biolabs
- 16.2.3.1. Overview
- 16.2.3.2. Products
- 16.2.3.3. SWOT Analysis
- 16.2.3.4. Recent Developments
- 16.2.3.5. Financials (Based on Availability)
- 16.2.4 ProZyme
- 16.2.4.1. Overview
- 16.2.4.2. Products
- 16.2.4.3. SWOT Analysis
- 16.2.4.4. Recent Developments
- 16.2.4.5. Financials (Based on Availability)
- 16.2.5 Takara Bio
- 16.2.5.1. Overview
- 16.2.5.2. Products
- 16.2.5.3. SWOT Analysis
- 16.2.5.4. Recent Developments
- 16.2.5.5. Financials (Based on Availability)
- 16.2.6 Danaher Corporation
- 16.2.6.1. Overview
- 16.2.6.2. Products
- 16.2.6.3. SWOT Analysis
- 16.2.6.4. Recent Developments
- 16.2.6.5. Financials (Based on Availability)
- 16.2.7 Thermo Fisher Scientific
- 16.2.7.1. Overview
- 16.2.7.2. Products
- 16.2.7.3. SWOT Analysis
- 16.2.7.4. Recent Developments
- 16.2.7.5. Financials (Based on Availability)
- 16.2.8 Bruker Corporation
- 16.2.8.1. Overview
- 16.2.8.2. Products
- 16.2.8.3. SWOT Analysis
- 16.2.8.4. Recent Developments
- 16.2.8.5. Financials (Based on Availability)
- 16.2.9 Agilent Technologies
- 16.2.9.1. Overview
- 16.2.9.2. Products
- 16.2.9.3. SWOT Analysis
- 16.2.9.4. Recent Developments
- 16.2.9.5. Financials (Based on Availability)
- 16.2.10 Shimadzu Corporation
- 16.2.10.1. Overview
- 16.2.10.2. Products
- 16.2.10.3. SWOT Analysis
- 16.2.10.4. Recent Developments
- 16.2.10.5. Financials (Based on Availability)
- 16.2.1 Waters Corporation
List of Figures
- Figure 1: Global Glycobiology Market Revenue Breakdown (Million, %) by Region 2024 & 2032
- Figure 2: Global Glycobiology Market Volume Breakdown (K Unit, %) by Region 2024 & 2032
- Figure 3: North America Glycobiology Market Revenue (Million), by Country 2024 & 2032
- Figure 4: North America Glycobiology Market Volume (K Unit), by Country 2024 & 2032
- Figure 5: North America Glycobiology Market Revenue Share (%), by Country 2024 & 2032
- Figure 6: North America Glycobiology Market Volume Share (%), by Country 2024 & 2032
- Figure 7: Europe Glycobiology Market Revenue (Million), by Country 2024 & 2032
- Figure 8: Europe Glycobiology Market Volume (K Unit), by Country 2024 & 2032
- Figure 9: Europe Glycobiology Market Revenue Share (%), by Country 2024 & 2032
- Figure 10: Europe Glycobiology Market Volume Share (%), by Country 2024 & 2032
- Figure 11: Asia Pacific Glycobiology Market Revenue (Million), by Country 2024 & 2032
- Figure 12: Asia Pacific Glycobiology Market Volume (K Unit), by Country 2024 & 2032
- Figure 13: Asia Pacific Glycobiology Market Revenue Share (%), by Country 2024 & 2032
- Figure 14: Asia Pacific Glycobiology Market Volume Share (%), by Country 2024 & 2032
- Figure 15: Middle East and Africa Glycobiology Market Revenue (Million), by Country 2024 & 2032
- Figure 16: Middle East and Africa Glycobiology Market Volume (K Unit), by Country 2024 & 2032
- Figure 17: Middle East and Africa Glycobiology Market Revenue Share (%), by Country 2024 & 2032
- Figure 18: Middle East and Africa Glycobiology Market Volume Share (%), by Country 2024 & 2032
- Figure 19: South America Glycobiology Market Revenue (Million), by Country 2024 & 2032
- Figure 20: South America Glycobiology Market Volume (K Unit), by Country 2024 & 2032
- Figure 21: South America Glycobiology Market Revenue Share (%), by Country 2024 & 2032
- Figure 22: South America Glycobiology Market Volume Share (%), by Country 2024 & 2032
- Figure 23: North America Glycobiology Market Revenue (Million), by Product 2024 & 2032
- Figure 24: North America Glycobiology Market Volume (K Unit), by Product 2024 & 2032
- Figure 25: North America Glycobiology Market Revenue Share (%), by Product 2024 & 2032
- Figure 26: North America Glycobiology Market Volume Share (%), by Product 2024 & 2032
- Figure 27: North America Glycobiology Market Revenue (Million), by Application 2024 & 2032
- Figure 28: North America Glycobiology Market Volume (K Unit), by Application 2024 & 2032
- Figure 29: North America Glycobiology Market Revenue Share (%), by Application 2024 & 2032
- Figure 30: North America Glycobiology Market Volume Share (%), by Application 2024 & 2032
- Figure 31: North America Glycobiology Market Revenue (Million), by End User 2024 & 2032
- Figure 32: North America Glycobiology Market Volume (K Unit), by End User 2024 & 2032
- Figure 33: North America Glycobiology Market Revenue Share (%), by End User 2024 & 2032
- Figure 34: North America Glycobiology Market Volume Share (%), by End User 2024 & 2032
- Figure 35: North America Glycobiology Market Revenue (Million), by Country 2024 & 2032
- Figure 36: North America Glycobiology Market Volume (K Unit), by Country 2024 & 2032
- Figure 37: North America Glycobiology Market Revenue Share (%), by Country 2024 & 2032
- Figure 38: North America Glycobiology Market Volume Share (%), by Country 2024 & 2032
- Figure 39: Europe Glycobiology Market Revenue (Million), by Product 2024 & 2032
- Figure 40: Europe Glycobiology Market Volume (K Unit), by Product 2024 & 2032
- Figure 41: Europe Glycobiology Market Revenue Share (%), by Product 2024 & 2032
- Figure 42: Europe Glycobiology Market Volume Share (%), by Product 2024 & 2032
- Figure 43: Europe Glycobiology Market Revenue (Million), by Application 2024 & 2032
- Figure 44: Europe Glycobiology Market Volume (K Unit), by Application 2024 & 2032
- Figure 45: Europe Glycobiology Market Revenue Share (%), by Application 2024 & 2032
- Figure 46: Europe Glycobiology Market Volume Share (%), by Application 2024 & 2032
- Figure 47: Europe Glycobiology Market Revenue (Million), by End User 2024 & 2032
- Figure 48: Europe Glycobiology Market Volume (K Unit), by End User 2024 & 2032
- Figure 49: Europe Glycobiology Market Revenue Share (%), by End User 2024 & 2032
- Figure 50: Europe Glycobiology Market Volume Share (%), by End User 2024 & 2032
- Figure 51: Europe Glycobiology Market Revenue (Million), by Country 2024 & 2032
- Figure 52: Europe Glycobiology Market Volume (K Unit), by Country 2024 & 2032
- Figure 53: Europe Glycobiology Market Revenue Share (%), by Country 2024 & 2032
- Figure 54: Europe Glycobiology Market Volume Share (%), by Country 2024 & 2032
- Figure 55: Asia Pacific Glycobiology Market Revenue (Million), by Product 2024 & 2032
- Figure 56: Asia Pacific Glycobiology Market Volume (K Unit), by Product 2024 & 2032
- Figure 57: Asia Pacific Glycobiology Market Revenue Share (%), by Product 2024 & 2032
- Figure 58: Asia Pacific Glycobiology Market Volume Share (%), by Product 2024 & 2032
- Figure 59: Asia Pacific Glycobiology Market Revenue (Million), by Application 2024 & 2032
- Figure 60: Asia Pacific Glycobiology Market Volume (K Unit), by Application 2024 & 2032
- Figure 61: Asia Pacific Glycobiology Market Revenue Share (%), by Application 2024 & 2032
- Figure 62: Asia Pacific Glycobiology Market Volume Share (%), by Application 2024 & 2032
- Figure 63: Asia Pacific Glycobiology Market Revenue (Million), by End User 2024 & 2032
- Figure 64: Asia Pacific Glycobiology Market Volume (K Unit), by End User 2024 & 2032
- Figure 65: Asia Pacific Glycobiology Market Revenue Share (%), by End User 2024 & 2032
- Figure 66: Asia Pacific Glycobiology Market Volume Share (%), by End User 2024 & 2032
- Figure 67: Asia Pacific Glycobiology Market Revenue (Million), by Country 2024 & 2032
- Figure 68: Asia Pacific Glycobiology Market Volume (K Unit), by Country 2024 & 2032
- Figure 69: Asia Pacific Glycobiology Market Revenue Share (%), by Country 2024 & 2032
- Figure 70: Asia Pacific Glycobiology Market Volume Share (%), by Country 2024 & 2032
- Figure 71: Middle East and Africa Glycobiology Market Revenue (Million), by Product 2024 & 2032
- Figure 72: Middle East and Africa Glycobiology Market Volume (K Unit), by Product 2024 & 2032
- Figure 73: Middle East and Africa Glycobiology Market Revenue Share (%), by Product 2024 & 2032
- Figure 74: Middle East and Africa Glycobiology Market Volume Share (%), by Product 2024 & 2032
- Figure 75: Middle East and Africa Glycobiology Market Revenue (Million), by Application 2024 & 2032
- Figure 76: Middle East and Africa Glycobiology Market Volume (K Unit), by Application 2024 & 2032
- Figure 77: Middle East and Africa Glycobiology Market Revenue Share (%), by Application 2024 & 2032
- Figure 78: Middle East and Africa Glycobiology Market Volume Share (%), by Application 2024 & 2032
- Figure 79: Middle East and Africa Glycobiology Market Revenue (Million), by End User 2024 & 2032
- Figure 80: Middle East and Africa Glycobiology Market Volume (K Unit), by End User 2024 & 2032
- Figure 81: Middle East and Africa Glycobiology Market Revenue Share (%), by End User 2024 & 2032
- Figure 82: Middle East and Africa Glycobiology Market Volume Share (%), by End User 2024 & 2032
- Figure 83: Middle East and Africa Glycobiology Market Revenue (Million), by Country 2024 & 2032
- Figure 84: Middle East and Africa Glycobiology Market Volume (K Unit), by Country 2024 & 2032
- Figure 85: Middle East and Africa Glycobiology Market Revenue Share (%), by Country 2024 & 2032
- Figure 86: Middle East and Africa Glycobiology Market Volume Share (%), by Country 2024 & 2032
- Figure 87: South America Glycobiology Market Revenue (Million), by Product 2024 & 2032
- Figure 88: South America Glycobiology Market Volume (K Unit), by Product 2024 & 2032
- Figure 89: South America Glycobiology Market Revenue Share (%), by Product 2024 & 2032
- Figure 90: South America Glycobiology Market Volume Share (%), by Product 2024 & 2032
- Figure 91: South America Glycobiology Market Revenue (Million), by Application 2024 & 2032
- Figure 92: South America Glycobiology Market Volume (K Unit), by Application 2024 & 2032
- Figure 93: South America Glycobiology Market Revenue Share (%), by Application 2024 & 2032
- Figure 94: South America Glycobiology Market Volume Share (%), by Application 2024 & 2032
- Figure 95: South America Glycobiology Market Revenue (Million), by End User 2024 & 2032
- Figure 96: South America Glycobiology Market Volume (K Unit), by End User 2024 & 2032
- Figure 97: South America Glycobiology Market Revenue Share (%), by End User 2024 & 2032
- Figure 98: South America Glycobiology Market Volume Share (%), by End User 2024 & 2032
- Figure 99: South America Glycobiology Market Revenue (Million), by Country 2024 & 2032
- Figure 100: South America Glycobiology Market Volume (K Unit), by Country 2024 & 2032
- Figure 101: South America Glycobiology Market Revenue Share (%), by Country 2024 & 2032
- Figure 102: South America Glycobiology Market Volume Share (%), by Country 2024 & 2032
List of Tables
- Table 1: Global Glycobiology Market Revenue Million Forecast, by Region 2019 & 2032
- Table 2: Global Glycobiology Market Volume K Unit Forecast, by Region 2019 & 2032
- Table 3: Global Glycobiology Market Revenue Million Forecast, by Product 2019 & 2032
- Table 4: Global Glycobiology Market Volume K Unit Forecast, by Product 2019 & 2032
- Table 5: Global Glycobiology Market Revenue Million Forecast, by Application 2019 & 2032
- Table 6: Global Glycobiology Market Volume K Unit Forecast, by Application 2019 & 2032
- Table 7: Global Glycobiology Market Revenue Million Forecast, by End User 2019 & 2032
- Table 8: Global Glycobiology Market Volume K Unit Forecast, by End User 2019 & 2032
- Table 9: Global Glycobiology Market Revenue Million Forecast, by Region 2019 & 2032
- Table 10: Global Glycobiology Market Volume K Unit Forecast, by Region 2019 & 2032
- Table 11: Global Glycobiology Market Revenue Million Forecast, by Country 2019 & 2032
- Table 12: Global Glycobiology Market Volume K Unit Forecast, by Country 2019 & 2032
- Table 13: United States Glycobiology Market Revenue (Million) Forecast, by Application 2019 & 2032
- Table 14: United States Glycobiology Market Volume (K Unit) Forecast, by Application 2019 & 2032
- Table 15: Canada Glycobiology Market Revenue (Million) Forecast, by Application 2019 & 2032
- Table 16: Canada Glycobiology Market Volume (K Unit) Forecast, by Application 2019 & 2032
- Table 17: Mexico Glycobiology Market Revenue (Million) Forecast, by Application 2019 & 2032
- Table 18: Mexico Glycobiology Market Volume (K Unit) Forecast, by Application 2019 & 2032
- Table 19: Global Glycobiology Market Revenue Million Forecast, by Country 2019 & 2032
- Table 20: Global Glycobiology Market Volume K Unit Forecast, by Country 2019 & 2032
- Table 21: Germany Glycobiology Market Revenue (Million) Forecast, by Application 2019 & 2032
- Table 22: Germany Glycobiology Market Volume (K Unit) Forecast, by Application 2019 & 2032
- Table 23: United Kingdom Glycobiology Market Revenue (Million) Forecast, by Application 2019 & 2032
- Table 24: United Kingdom Glycobiology Market Volume (K Unit) Forecast, by Application 2019 & 2032
- Table 25: France Glycobiology Market Revenue (Million) Forecast, by Application 2019 & 2032
- Table 26: France Glycobiology Market Volume (K Unit) Forecast, by Application 2019 & 2032
- Table 27: Italy Glycobiology Market Revenue (Million) Forecast, by Application 2019 & 2032
- Table 28: Italy Glycobiology Market Volume (K Unit) Forecast, by Application 2019 & 2032
- Table 29: Spain Glycobiology Market Revenue (Million) Forecast, by Application 2019 & 2032
- Table 30: Spain Glycobiology Market Volume (K Unit) Forecast, by Application 2019 & 2032
- Table 31: Rest of Europe Glycobiology Market Revenue (Million) Forecast, by Application 2019 & 2032
- Table 32: Rest of Europe Glycobiology Market Volume (K Unit) Forecast, by Application 2019 & 2032
- Table 33: Global Glycobiology Market Revenue Million Forecast, by Country 2019 & 2032
- Table 34: Global Glycobiology Market Volume K Unit Forecast, by Country 2019 & 2032
- Table 35: China Glycobiology Market Revenue (Million) Forecast, by Application 2019 & 2032
- Table 36: China Glycobiology Market Volume (K Unit) Forecast, by Application 2019 & 2032
- Table 37: Japan Glycobiology Market Revenue (Million) Forecast, by Application 2019 & 2032
- Table 38: Japan Glycobiology Market Volume (K Unit) Forecast, by Application 2019 & 2032
- Table 39: India Glycobiology Market Revenue (Million) Forecast, by Application 2019 & 2032
- Table 40: India Glycobiology Market Volume (K Unit) Forecast, by Application 2019 & 2032
- Table 41: Australia Glycobiology Market Revenue (Million) Forecast, by Application 2019 & 2032
- Table 42: Australia Glycobiology Market Volume (K Unit) Forecast, by Application 2019 & 2032
- Table 43: South Korea Glycobiology Market Revenue (Million) Forecast, by Application 2019 & 2032
- Table 44: South Korea Glycobiology Market Volume (K Unit) Forecast, by Application 2019 & 2032
- Table 45: Rest of Asia Pacific Glycobiology Market Revenue (Million) Forecast, by Application 2019 & 2032
- Table 46: Rest of Asia Pacific Glycobiology Market Volume (K Unit) Forecast, by Application 2019 & 2032
- Table 47: Global Glycobiology Market Revenue Million Forecast, by Country 2019 & 2032
- Table 48: Global Glycobiology Market Volume K Unit Forecast, by Country 2019 & 2032
- Table 49: GCC Glycobiology Market Revenue (Million) Forecast, by Application 2019 & 2032
- Table 50: GCC Glycobiology Market Volume (K Unit) Forecast, by Application 2019 & 2032
- Table 51: South Africa Glycobiology Market Revenue (Million) Forecast, by Application 2019 & 2032
- Table 52: South Africa Glycobiology Market Volume (K Unit) Forecast, by Application 2019 & 2032
- Table 53: Rest of Middle East and Africa Glycobiology Market Revenue (Million) Forecast, by Application 2019 & 2032
- Table 54: Rest of Middle East and Africa Glycobiology Market Volume (K Unit) Forecast, by Application 2019 & 2032
- Table 55: Global Glycobiology Market Revenue Million Forecast, by Country 2019 & 2032
- Table 56: Global Glycobiology Market Volume K Unit Forecast, by Country 2019 & 2032
- Table 57: Brazil Glycobiology Market Revenue (Million) Forecast, by Application 2019 & 2032
- Table 58: Brazil Glycobiology Market Volume (K Unit) Forecast, by Application 2019 & 2032
- Table 59: Argentina Glycobiology Market Revenue (Million) Forecast, by Application 2019 & 2032
- Table 60: Argentina Glycobiology Market Volume (K Unit) Forecast, by Application 2019 & 2032
- Table 61: Rest of South America Glycobiology Market Revenue (Million) Forecast, by Application 2019 & 2032
- Table 62: Rest of South America Glycobiology Market Volume (K Unit) Forecast, by Application 2019 & 2032
- Table 63: Global Glycobiology Market Revenue Million Forecast, by Product 2019 & 2032
- Table 64: Global Glycobiology Market Volume K Unit Forecast, by Product 2019 & 2032
- Table 65: Global Glycobiology Market Revenue Million Forecast, by Application 2019 & 2032
- Table 66: Global Glycobiology Market Volume K Unit Forecast, by Application 2019 & 2032
- Table 67: Global Glycobiology Market Revenue Million Forecast, by End User 2019 & 2032
- Table 68: Global Glycobiology Market Volume K Unit Forecast, by End User 2019 & 2032
- Table 69: Global Glycobiology Market Revenue Million Forecast, by Country 2019 & 2032
- Table 70: Global Glycobiology Market Volume K Unit Forecast, by Country 2019 & 2032
- Table 71: United States Glycobiology Market Revenue (Million) Forecast, by Application 2019 & 2032
- Table 72: United States Glycobiology Market Volume (K Unit) Forecast, by Application 2019 & 2032
- Table 73: Canada Glycobiology Market Revenue (Million) Forecast, by Application 2019 & 2032
- Table 74: Canada Glycobiology Market Volume (K Unit) Forecast, by Application 2019 & 2032
- Table 75: Mexico Glycobiology Market Revenue (Million) Forecast, by Application 2019 & 2032
- Table 76: Mexico Glycobiology Market Volume (K Unit) Forecast, by Application 2019 & 2032
- Table 77: Global Glycobiology Market Revenue Million Forecast, by Product 2019 & 2032
- Table 78: Global Glycobiology Market Volume K Unit Forecast, by Product 2019 & 2032
- Table 79: Global Glycobiology Market Revenue Million Forecast, by Application 2019 & 2032
- Table 80: Global Glycobiology Market Volume K Unit Forecast, by Application 2019 & 2032
- Table 81: Global Glycobiology Market Revenue Million Forecast, by End User 2019 & 2032
- Table 82: Global Glycobiology Market Volume K Unit Forecast, by End User 2019 & 2032
- Table 83: Global Glycobiology Market Revenue Million Forecast, by Country 2019 & 2032
- Table 84: Global Glycobiology Market Volume K Unit Forecast, by Country 2019 & 2032
- Table 85: Germany Glycobiology Market Revenue (Million) Forecast, by Application 2019 & 2032
- Table 86: Germany Glycobiology Market Volume (K Unit) Forecast, by Application 2019 & 2032
- Table 87: United Kingdom Glycobiology Market Revenue (Million) Forecast, by Application 2019 & 2032
- Table 88: United Kingdom Glycobiology Market Volume (K Unit) Forecast, by Application 2019 & 2032
- Table 89: France Glycobiology Market Revenue (Million) Forecast, by Application 2019 & 2032
- Table 90: France Glycobiology Market Volume (K Unit) Forecast, by Application 2019 & 2032
- Table 91: Italy Glycobiology Market Revenue (Million) Forecast, by Application 2019 & 2032
- Table 92: Italy Glycobiology Market Volume (K Unit) Forecast, by Application 2019 & 2032
- Table 93: Spain Glycobiology Market Revenue (Million) Forecast, by Application 2019 & 2032
- Table 94: Spain Glycobiology Market Volume (K Unit) Forecast, by Application 2019 & 2032
- Table 95: Rest of Europe Glycobiology Market Revenue (Million) Forecast, by Application 2019 & 2032
- Table 96: Rest of Europe Glycobiology Market Volume (K Unit) Forecast, by Application 2019 & 2032
- Table 97: Global Glycobiology Market Revenue Million Forecast, by Product 2019 & 2032
- Table 98: Global Glycobiology Market Volume K Unit Forecast, by Product 2019 & 2032
- Table 99: Global Glycobiology Market Revenue Million Forecast, by Application 2019 & 2032
- Table 100: Global Glycobiology Market Volume K Unit Forecast, by Application 2019 & 2032
- Table 101: Global Glycobiology Market Revenue Million Forecast, by End User 2019 & 2032
- Table 102: Global Glycobiology Market Volume K Unit Forecast, by End User 2019 & 2032
- Table 103: Global Glycobiology Market Revenue Million Forecast, by Country 2019 & 2032
- Table 104: Global Glycobiology Market Volume K Unit Forecast, by Country 2019 & 2032
- Table 105: China Glycobiology Market Revenue (Million) Forecast, by Application 2019 & 2032
- Table 106: China Glycobiology Market Volume (K Unit) Forecast, by Application 2019 & 2032
- Table 107: Japan Glycobiology Market Revenue (Million) Forecast, by Application 2019 & 2032
- Table 108: Japan Glycobiology Market Volume (K Unit) Forecast, by Application 2019 & 2032
- Table 109: India Glycobiology Market Revenue (Million) Forecast, by Application 2019 & 2032
- Table 110: India Glycobiology Market Volume (K Unit) Forecast, by Application 2019 & 2032
- Table 111: Australia Glycobiology Market Revenue (Million) Forecast, by Application 2019 & 2032
- Table 112: Australia Glycobiology Market Volume (K Unit) Forecast, by Application 2019 & 2032
- Table 113: South Korea Glycobiology Market Revenue (Million) Forecast, by Application 2019 & 2032
- Table 114: South Korea Glycobiology Market Volume (K Unit) Forecast, by Application 2019 & 2032
- Table 115: Rest of Asia Pacific Glycobiology Market Revenue (Million) Forecast, by Application 2019 & 2032
- Table 116: Rest of Asia Pacific Glycobiology Market Volume (K Unit) Forecast, by Application 2019 & 2032
- Table 117: Global Glycobiology Market Revenue Million Forecast, by Product 2019 & 2032
- Table 118: Global Glycobiology Market Volume K Unit Forecast, by Product 2019 & 2032
- Table 119: Global Glycobiology Market Revenue Million Forecast, by Application 2019 & 2032
- Table 120: Global Glycobiology Market Volume K Unit Forecast, by Application 2019 & 2032
- Table 121: Global Glycobiology Market Revenue Million Forecast, by End User 2019 & 2032
- Table 122: Global Glycobiology Market Volume K Unit Forecast, by End User 2019 & 2032
- Table 123: Global Glycobiology Market Revenue Million Forecast, by Country 2019 & 2032
- Table 124: Global Glycobiology Market Volume K Unit Forecast, by Country 2019 & 2032
- Table 125: GCC Glycobiology Market Revenue (Million) Forecast, by Application 2019 & 2032
- Table 126: GCC Glycobiology Market Volume (K Unit) Forecast, by Application 2019 & 2032
- Table 127: South Africa Glycobiology Market Revenue (Million) Forecast, by Application 2019 & 2032
- Table 128: South Africa Glycobiology Market Volume (K Unit) Forecast, by Application 2019 & 2032
- Table 129: Rest of Middle East and Africa Glycobiology Market Revenue (Million) Forecast, by Application 2019 & 2032
- Table 130: Rest of Middle East and Africa Glycobiology Market Volume (K Unit) Forecast, by Application 2019 & 2032
- Table 131: Global Glycobiology Market Revenue Million Forecast, by Product 2019 & 2032
- Table 132: Global Glycobiology Market Volume K Unit Forecast, by Product 2019 & 2032
- Table 133: Global Glycobiology Market Revenue Million Forecast, by Application 2019 & 2032
- Table 134: Global Glycobiology Market Volume K Unit Forecast, by Application 2019 & 2032
- Table 135: Global Glycobiology Market Revenue Million Forecast, by End User 2019 & 2032
- Table 136: Global Glycobiology Market Volume K Unit Forecast, by End User 2019 & 2032
- Table 137: Global Glycobiology Market Revenue Million Forecast, by Country 2019 & 2032
- Table 138: Global Glycobiology Market Volume K Unit Forecast, by Country 2019 & 2032
- Table 139: Brazil Glycobiology Market Revenue (Million) Forecast, by Application 2019 & 2032
- Table 140: Brazil Glycobiology Market Volume (K Unit) Forecast, by Application 2019 & 2032
- Table 141: Argentina Glycobiology Market Revenue (Million) Forecast, by Application 2019 & 2032
- Table 142: Argentina Glycobiology Market Volume (K Unit) Forecast, by Application 2019 & 2032
- Table 143: Rest of South America Glycobiology Market Revenue (Million) Forecast, by Application 2019 & 2032
- Table 144: Rest of South America Glycobiology Market Volume (K Unit) Forecast, by Application 2019 & 2032
Frequently Asked Questions
1. What is the projected Compound Annual Growth Rate (CAGR) of the Glycobiology Market?
The projected CAGR is approximately 14.87%.
2. Which companies are prominent players in the Glycobiology Market?
Key companies in the market include Waters Corporation, Merck KGaA, New England Biolabs, ProZyme, Takara Bio, Danaher Corporation, Thermo Fisher Scientific, Bruker Corporation, Agilent Technologies, Shimadzu Corporation.
3. What are the main segments of the Glycobiology Market?
The market segments include Product, Application, End User.
4. Can you provide details about the market size?
The market size is estimated to be USD 0.62 Million as of 2022.
5. What are some drivers contributing to market growth?
Increasing Government and Private Funding for Glycomics and Proteomics Research; Growing R&D Expenditures by Pharmaceutical and Biotechnology Companies.
6. What are the notable trends driving market growth?
Drug Discovery and Development is Expected to be the Largest Growing Segment.
7. Are there any restraints impacting market growth?
High Product Cost; Low Availability of Skilled Professionals.
8. Can you provide examples of recent developments in the market?
In June 2022, Thermo Fisher Scientific announced a co-marketing agreement with TransMIT GmbH Center for Mass Spectrometric Developments to promote the use of a mass spectrometry imaging (MSI) platform for spatial multi-omics applications in pharma and clinical labs.
9. What pricing options are available for accessing the report?
Pricing options include single-user, multi-user, and enterprise licenses priced at USD 4750, USD 5250, and USD 8750 respectively.
10. Is the market size provided in terms of value or volume?
The market size is provided in terms of value, measured in Million and volume, measured in K Unit.
11. Are there any specific market keywords associated with the report?
Yes, the market keyword associated with the report is "Glycobiology Market," which aids in identifying and referencing the specific market segment covered.
12. How do I determine which pricing option suits my needs best?
The pricing options vary based on user requirements and access needs. Individual users may opt for single-user licenses, while businesses requiring broader access may choose multi-user or enterprise licenses for cost-effective access to the report.
13. Are there any additional resources or data provided in the Glycobiology Market report?
While the report offers comprehensive insights, it's advisable to review the specific contents or supplementary materials provided to ascertain if additional resources or data are available.
14. How can I stay updated on further developments or reports in the Glycobiology Market?
To stay informed about further developments, trends, and reports in the Glycobiology Market, consider subscribing to industry newsletters, following relevant companies and organizations, or regularly checking reputable industry news sources and publications.
Methodology
Step 1 - Identification of Relevant Samples Size from Population Database


Step 2 - Approaches for Defining Global Market Size (Value, Volume* & Price*)

Note*: In applicable scenarios
Step 3 - Data Sources
Primary Research
- Web Analytics
- Survey Reports
- Research Institute
- Latest Research Reports
- Opinion Leaders
Secondary Research
- Annual Reports
- White Paper
- Latest Press Release
- Industry Association
- Paid Database
- Investor Presentations

Step 4 - Data Triangulation
Involves using different sources of information in order to increase the validity of a study
These sources are likely to be stakeholders in a program - participants, other researchers, program staff, other community members, and so on.
Then we put all data in single framework & apply various statistical tools to find out the dynamic on the market.
During the analysis stage, feedback from the stakeholder groups would be compared to determine areas of agreement as well as areas of divergence


