
Key Insights
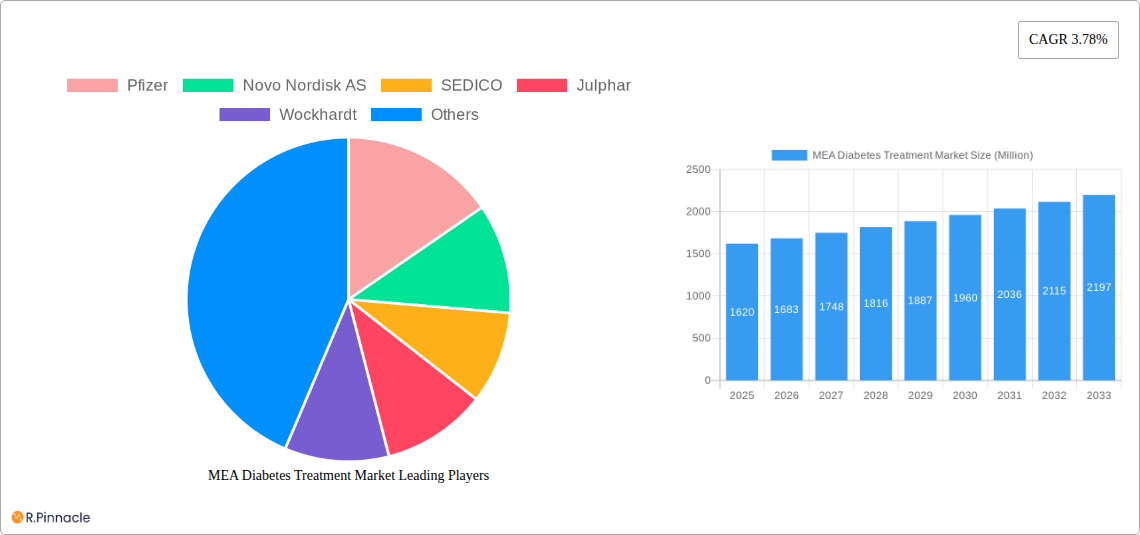
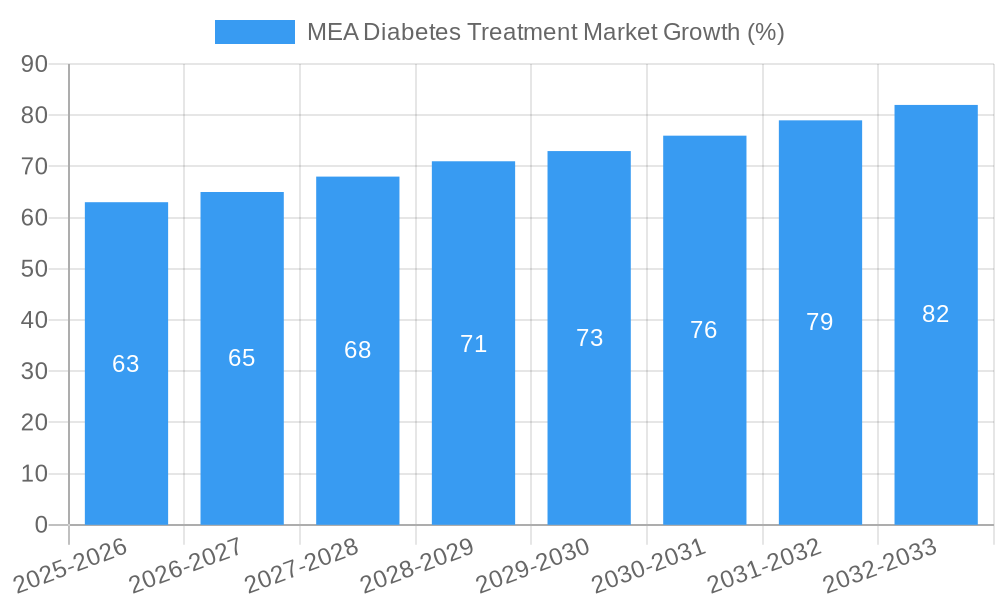
The MEA (Middle East and Africa) diabetes treatment market, valued at approximately $1.62 billion in 2025, is projected to experience steady growth with a CAGR of 3.78% from 2025 to 2033. This growth is driven by several factors, including the rising prevalence of diabetes across the region, fueled by increasing urbanization, sedentary lifestyles, and changing dietary habits. Furthermore, growing awareness of diabetes management and the increasing accessibility of advanced treatment options, such as insulin therapies (including basal/long-acting, bolus/fast-acting, and combination insulins) and biosimilars, contribute significantly to market expansion. The market is segmented by product type (Basal/Long-acting Insulins, Bolus/Fast-acting Insulins, Traditional Human Insulins, Combination Insulins, Biosimilar Insulins), with insulin therapies holding a dominant share due to their efficacy in managing blood glucose levels. Major players like Novo Nordisk, Sanofi Aventis, and Eli Lilly are key contributors, leveraging their established presence and innovative product portfolios. However, challenges such as high treatment costs, limited healthcare infrastructure in certain areas, and a lack of diabetes awareness in some populations act as market restraints. Despite these, the growing diabetic population and increased government initiatives focused on improving healthcare access are expected to positively influence market growth in the long term.
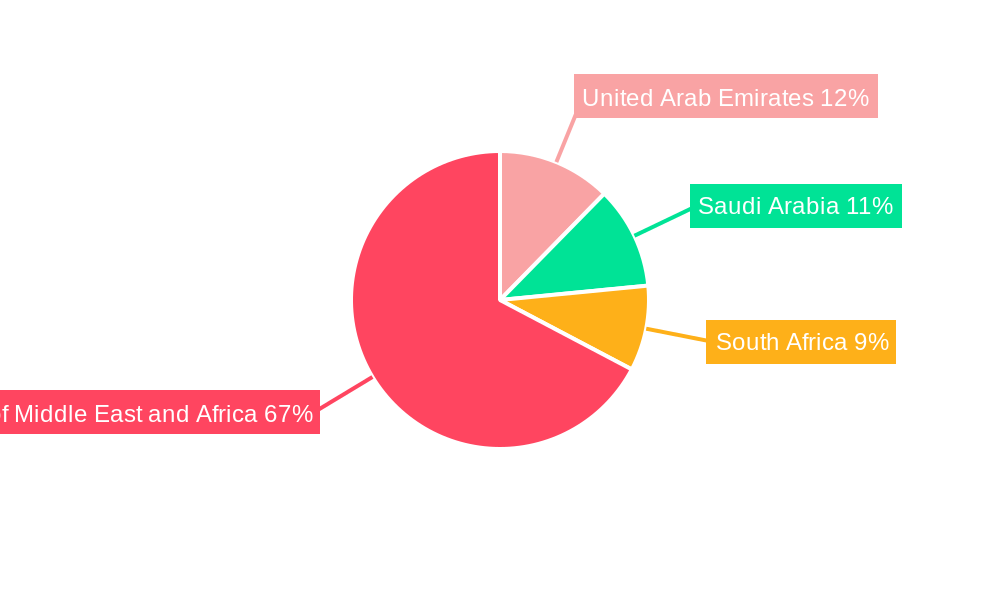
The regional distribution of the market within MEA shows varying growth potential. Countries like the United Arab Emirates and Saudi Arabia, with their relatively advanced healthcare systems and higher per capita income, are expected to exhibit faster growth compared to other regions within MEA. However, significant growth opportunities also exist in other countries as healthcare access improves and diabetes awareness campaigns become more effective. The market is also influenced by pricing strategies employed by pharmaceutical companies and the availability of generic and biosimilar insulin products, which are expected to drive greater affordability and accessibility. The continued focus on innovative treatment solutions, alongside improvements in healthcare infrastructure, will likely shape the market's future trajectory, leading to sustained and potentially accelerated growth beyond the forecast period.
MEA Diabetes Treatment Market Report: 2019-2033
This comprehensive report provides an in-depth analysis of the Middle East and Africa (MEA) diabetes treatment market, offering valuable insights for industry professionals, investors, and stakeholders. Covering the period from 2019 to 2033 (Study Period: 2019–2033, Base Year: 2025, Estimated Year: 2025, Forecast Period: 2025–2033, Historical Period: 2019–2024), this report leverages extensive market research to deliver actionable strategies for navigating this dynamic sector. The market is expected to reach xx Million by 2033, exhibiting a robust CAGR of xx%.
MEA Diabetes Treatment Market Structure & Innovation Trends
The MEA diabetes treatment market exhibits a moderately concentrated structure, with key players like Pfizer, Novo Nordisk AS, Sanofi Aventis, Eli Lilly and Company, and Biocon holding significant market share. However, the presence of several regional players and the increasing adoption of biosimilars are fostering competition. Innovation is driven by the need for more effective, affordable, and convenient treatment options, particularly for insulin delivery.
- Market Concentration: The top 5 players account for approximately xx% of the market share in 2025.
- Innovation Drivers: Rising prevalence of diabetes, technological advancements in insulin delivery systems (e.g., wearable pumps), and growing demand for biosimilars.
- Regulatory Framework: Varying regulatory landscapes across MEA countries influence market access and pricing.
- Product Substitutes: Alternative therapies, including lifestyle modifications and oral medications, compete for market share.
- End-User Demographics: The aging population and increasing prevalence of type 2 diabetes are key demographic drivers.
- M&A Activities: The past five years have seen xx M&A deals in the MEA diabetes treatment market, with a total estimated value of xx Million, primarily focused on expanding market access and acquiring innovative technologies.
MEA Diabetes Treatment Market Dynamics & Trends
The MEA diabetes treatment market is characterized by significant growth driven by several factors. The rising prevalence of diabetes, particularly type 2 diabetes, fueled by lifestyle changes and urbanization, is a primary driver. Technological advancements, such as the introduction of advanced insulin delivery systems like wearable pumps (as evidenced by EOFlow's EOPatch launch in the UAE), are revolutionizing treatment options and improving patient outcomes. Growing consumer awareness and demand for improved treatment efficacy and convenience further fuel market expansion. However, affordability remains a significant challenge, especially in low- and middle-income countries within the MEA region. The competitive landscape is intensifying with the entry of biosimilars and the strategic partnerships formed by major pharmaceutical companies. This dynamic environment is expected to yield a robust CAGR of xx% throughout the forecast period. Market penetration of advanced insulin delivery systems is projected to reach xx% by 2033.
Dominant Regions & Segments in MEA Diabetes Treatment Market
The GCC region currently dominates the MEA diabetes treatment market, driven by high diabetes prevalence, robust healthcare infrastructure, and higher disposable incomes. However, other regions, like North Africa, are experiencing rapid growth.
Key Drivers:
- High prevalence of diabetes: The GCC countries, particularly Saudi Arabia and the UAE, have among the highest rates of diabetes globally.
- Increasing healthcare expenditure: Governments are investing heavily in healthcare infrastructure and diabetes management programs.
- Rising awareness and improved diagnosis: Enhanced screening programs and greater public awareness are leading to earlier diagnosis and treatment.
Segment Dominance:
- Basal or Long-acting Insulins: This segment holds the largest market share, driven by the high prevalence of type 2 diabetes, requiring consistent insulin therapy.
- Bolus or Fast-acting Insulins: This segment is experiencing significant growth due to the increasing adoption of insulin pump therapy.
Detailed Dominance Analysis: The GCC region’s dominance is attributed to its high per capita income, well-established healthcare infrastructure, and proactive government initiatives aimed at diabetes management. Increased healthcare spending, coupled with rising awareness campaigns, has resulted in better diagnosis and treatment rates, propelling market growth.
MEA Diabetes Treatment Market Product Innovations
Recent years have witnessed significant innovation in diabetes treatment, particularly in insulin delivery systems. The introduction of wearable insulin pumps, such as EOFlow's EOPatch, offers enhanced convenience and improved patient compliance. Biosimilar insulins are also gaining traction, providing more affordable treatment options while maintaining efficacy. These advancements are shaping the competitive landscape and improving access to care.
Report Scope & Segmentation Analysis
This report segments the MEA diabetes treatment market by product type:
- Basal or Long-acting Insulins: This segment is projected to grow at a CAGR of xx% during the forecast period, driven by the increasing prevalence of type 2 diabetes. Key players include Novo Nordisk, Sanofi, and Eli Lilly.
- Bolus or Fast-acting Insulins: This segment is expected to witness robust growth, fueled by the rising adoption of insulin pump therapy. Apidra (Insulin Glulisine) is a leading product in this category.
- Traditional Human Insulins: This segment holds a significant market share, particularly in price-sensitive markets. Insuman is a prominent example.
- Combination Insulins: This segment is experiencing moderate growth, with Soliqua/Suliqua (Insulin glargine/Lixisenatide) being a key product.
- Biosimilar Insulins: This rapidly growing segment offers more cost-effective alternatives to branded insulins.
Key Drivers of MEA Diabetes Treatment Market Growth
The MEA diabetes treatment market's growth is propelled by several key factors: the escalating prevalence of diabetes, particularly type 2 diabetes, driven by lifestyle changes and an aging population; rising healthcare expenditure and government initiatives to combat diabetes; and technological innovations in insulin delivery systems, offering improved convenience and patient outcomes. The increased adoption of biosimilars is also contributing significantly to market expansion by making treatment more affordable.
Challenges in the MEA Diabetes Treatment Market Sector
Challenges include the high cost of treatment, limiting accessibility in many regions; the lack of awareness and education regarding diabetes prevention and management; variations in healthcare infrastructure across different countries within the MEA region; and the complexities of managing the supply chain for insulin and related products, especially in remote areas.
Emerging Opportunities in MEA Diabetes Treatment Market
Significant opportunities exist in expanding access to affordable diabetes treatments through the adoption of biosimilars and innovative delivery systems. The growing adoption of telemedicine and remote patient monitoring solutions presents a substantial opportunity for improving diabetes management and care. Furthermore, developing targeted educational campaigns focused on diabetes prevention and management can yield positive long-term results.
Leading Players in the MEA Diabetes Treatment Market Market
- Pfizer
- Novo Nordisk AS https://www.novonordisk.com/
- SEDICO
- Julphar
- Wockhardt
- Eli Lilly https://www.lilly.com/
- Exir
- Eli Lilly and Company https://www.lilly.com/
- Sanofi Aventis https://www.sanofi.com/
- Biocon
- Novo Nordisk https://www.novonordisk.com/
- Other Company Share Analyse
Key Developments in MEA Diabetes Treatment Market Industry
- February 2023: EOFlow receives UAE certification for its EOPatch wearable insulin pump, marking its entry into the Middle East market. This development is expected to significantly impact the market by providing a more convenient and user-friendly insulin delivery system.
- December 2022: Eli Lilly partners with Eva Pharma to improve insulin access in Africa, demonstrating a commitment to increasing affordability and accessibility of treatment. This partnership has the potential to expand the market significantly within Africa.
Future Outlook for MEA Diabetes Treatment Market Market
The MEA diabetes treatment market is poised for continued strong growth, driven by the persistent rise in diabetes prevalence and the continuous innovation in treatment technologies. The increasing adoption of cost-effective biosimilars, coupled with expanding access to advanced insulin delivery systems, will be key growth accelerators. Strategic partnerships and investments focused on improving access to care in underserved communities will further shape the future market trajectory.
MEA Diabetes Treatment Market Segmentation
-
1. Product
- 1.1. Basal or Long-acting Insulins
- 1.2. Bolus or Fast-acting Insulins
- 1.3. Traditional Human Insulins
- 1.4. Combination Insulins
- 1.5. Biosimilar Insulins
-
2. Geography
- 2.1. Saudi Arabia
- 2.2. Iran
- 2.3. Egypt
- 2.4. Oman
- 2.5. South Africa
- 2.6. Rest of Middle East and Africa
MEA Diabetes Treatment Market Segmentation By Geography
- 1. Saudi Arabia
- 2. Iran
- 3. Egypt
- 4. Oman
- 5. South Africa
- 6. Rest of Middle East and Africa
MEA Diabetes Treatment Market REPORT HIGHLIGHTS
| Aspects | Details |
|---|---|
| Study Period | 2019-2033 |
| Base Year | 2024 |
| Estimated Year | 2025 |
| Forecast Period | 2025-2033 |
| Historical Period | 2019-2024 |
| Growth Rate | CAGR of 3.78% from 2019-2033 |
| Segmentation |
|
Table of Contents
- 1. Introduction
- 1.1. Research Scope
- 1.2. Market Segmentation
- 1.3. Research Methodology
- 1.4. Definitions and Assumptions
- 2. Executive Summary
- 2.1. Introduction
- 3. Market Dynamics
- 3.1. Introduction
- 3.2. Market Drivers
- 3.2.1. ; The Rise in Global Prevalence of Cases of Obesity due to Modern Sedentary Lifestyles; Rise in Awareness and Disposable Income in Developed Economies
- 3.3. Market Restrains
- 3.3.1 ; Highly Cost of Branded Products in Emerging Countries; Severe Adverse Associated with Medication Including Seizures
- 3.3.2 Suicidal Attempts and Even Death; Adoption of Traditional Yoga and Herbal Products
- 3.4. Market Trends
- 3.4.1. Biosimilar Insulin Segment Holds Highest Market Share in Middle-East and Africa Human Insulin Market.
- 4. Market Factor Analysis
- 4.1. Porters Five Forces
- 4.2. Supply/Value Chain
- 4.3. PESTEL analysis
- 4.4. Market Entropy
- 4.5. Patent/Trademark Analysis
- 5. Global MEA Diabetes Treatment Market Analysis, Insights and Forecast, 2019-2031
- 5.1. Market Analysis, Insights and Forecast - by Product
- 5.1.1. Basal or Long-acting Insulins
- 5.1.2. Bolus or Fast-acting Insulins
- 5.1.3. Traditional Human Insulins
- 5.1.4. Combination Insulins
- 5.1.5. Biosimilar Insulins
- 5.2. Market Analysis, Insights and Forecast - by Geography
- 5.2.1. Saudi Arabia
- 5.2.2. Iran
- 5.2.3. Egypt
- 5.2.4. Oman
- 5.2.5. South Africa
- 5.2.6. Rest of Middle East and Africa
- 5.3. Market Analysis, Insights and Forecast - by Region
- 5.3.1. Saudi Arabia
- 5.3.2. Iran
- 5.3.3. Egypt
- 5.3.4. Oman
- 5.3.5. South Africa
- 5.3.6. Rest of Middle East and Africa
- 5.1. Market Analysis, Insights and Forecast - by Product
- 6. Saudi Arabia MEA Diabetes Treatment Market Analysis, Insights and Forecast, 2019-2031
- 6.1. Market Analysis, Insights and Forecast - by Product
- 6.1.1. Basal or Long-acting Insulins
- 6.1.2. Bolus or Fast-acting Insulins
- 6.1.3. Traditional Human Insulins
- 6.1.4. Combination Insulins
- 6.1.5. Biosimilar Insulins
- 6.2. Market Analysis, Insights and Forecast - by Geography
- 6.2.1. Saudi Arabia
- 6.2.2. Iran
- 6.2.3. Egypt
- 6.2.4. Oman
- 6.2.5. South Africa
- 6.2.6. Rest of Middle East and Africa
- 6.1. Market Analysis, Insights and Forecast - by Product
- 7. Iran MEA Diabetes Treatment Market Analysis, Insights and Forecast, 2019-2031
- 7.1. Market Analysis, Insights and Forecast - by Product
- 7.1.1. Basal or Long-acting Insulins
- 7.1.2. Bolus or Fast-acting Insulins
- 7.1.3. Traditional Human Insulins
- 7.1.4. Combination Insulins
- 7.1.5. Biosimilar Insulins
- 7.2. Market Analysis, Insights and Forecast - by Geography
- 7.2.1. Saudi Arabia
- 7.2.2. Iran
- 7.2.3. Egypt
- 7.2.4. Oman
- 7.2.5. South Africa
- 7.2.6. Rest of Middle East and Africa
- 7.1. Market Analysis, Insights and Forecast - by Product
- 8. Egypt MEA Diabetes Treatment Market Analysis, Insights and Forecast, 2019-2031
- 8.1. Market Analysis, Insights and Forecast - by Product
- 8.1.1. Basal or Long-acting Insulins
- 8.1.2. Bolus or Fast-acting Insulins
- 8.1.3. Traditional Human Insulins
- 8.1.4. Combination Insulins
- 8.1.5. Biosimilar Insulins
- 8.2. Market Analysis, Insights and Forecast - by Geography
- 8.2.1. Saudi Arabia
- 8.2.2. Iran
- 8.2.3. Egypt
- 8.2.4. Oman
- 8.2.5. South Africa
- 8.2.6. Rest of Middle East and Africa
- 8.1. Market Analysis, Insights and Forecast - by Product
- 9. Oman MEA Diabetes Treatment Market Analysis, Insights and Forecast, 2019-2031
- 9.1. Market Analysis, Insights and Forecast - by Product
- 9.1.1. Basal or Long-acting Insulins
- 9.1.2. Bolus or Fast-acting Insulins
- 9.1.3. Traditional Human Insulins
- 9.1.4. Combination Insulins
- 9.1.5. Biosimilar Insulins
- 9.2. Market Analysis, Insights and Forecast - by Geography
- 9.2.1. Saudi Arabia
- 9.2.2. Iran
- 9.2.3. Egypt
- 9.2.4. Oman
- 9.2.5. South Africa
- 9.2.6. Rest of Middle East and Africa
- 9.1. Market Analysis, Insights and Forecast - by Product
- 10. South Africa MEA Diabetes Treatment Market Analysis, Insights and Forecast, 2019-2031
- 10.1. Market Analysis, Insights and Forecast - by Product
- 10.1.1. Basal or Long-acting Insulins
- 10.1.2. Bolus or Fast-acting Insulins
- 10.1.3. Traditional Human Insulins
- 10.1.4. Combination Insulins
- 10.1.5. Biosimilar Insulins
- 10.2. Market Analysis, Insights and Forecast - by Geography
- 10.2.1. Saudi Arabia
- 10.2.2. Iran
- 10.2.3. Egypt
- 10.2.4. Oman
- 10.2.5. South Africa
- 10.2.6. Rest of Middle East and Africa
- 10.1. Market Analysis, Insights and Forecast - by Product
- 11. Rest of Middle East and Africa MEA Diabetes Treatment Market Analysis, Insights and Forecast, 2019-2031
- 11.1. Market Analysis, Insights and Forecast - by Product
- 11.1.1. Basal or Long-acting Insulins
- 11.1.2. Bolus or Fast-acting Insulins
- 11.1.3. Traditional Human Insulins
- 11.1.4. Combination Insulins
- 11.1.5. Biosimilar Insulins
- 11.2. Market Analysis, Insights and Forecast - by Geography
- 11.2.1. Saudi Arabia
- 11.2.2. Iran
- 11.2.3. Egypt
- 11.2.4. Oman
- 11.2.5. South Africa
- 11.2.6. Rest of Middle East and Africa
- 11.1. Market Analysis, Insights and Forecast - by Product
- 12. North America MEA Diabetes Treatment Market Analysis, Insights and Forecast, 2019-2031
- 12.1. Market Analysis, Insights and Forecast - By Country/Sub-region
- 12.1.1 United States
- 12.1.2 Canada
- 12.1.3 Mexico
- 13. Europe MEA Diabetes Treatment Market Analysis, Insights and Forecast, 2019-2031
- 13.1. Market Analysis, Insights and Forecast - By Country/Sub-region
- 13.1.1 Germany
- 13.1.2 United Kingdom
- 13.1.3 France
- 13.1.4 Spain
- 13.1.5 Italy
- 13.1.6 Spain
- 13.1.7 Belgium
- 13.1.8 Netherland
- 13.1.9 Nordics
- 13.1.10 Rest of Europe
- 14. Asia Pacific MEA Diabetes Treatment Market Analysis, Insights and Forecast, 2019-2031
- 14.1. Market Analysis, Insights and Forecast - By Country/Sub-region
- 14.1.1 China
- 14.1.2 Japan
- 14.1.3 India
- 14.1.4 South Korea
- 14.1.5 Southeast Asia
- 14.1.6 Australia
- 14.1.7 Indonesia
- 14.1.8 Phillipes
- 14.1.9 Singapore
- 14.1.10 Thailandc
- 14.1.11 Rest of Asia Pacific
- 15. South America MEA Diabetes Treatment Market Analysis, Insights and Forecast, 2019-2031
- 15.1. Market Analysis, Insights and Forecast - By Country/Sub-region
- 15.1.1 Brazil
- 15.1.2 Argentina
- 15.1.3 Peru
- 15.1.4 Chile
- 15.1.5 Colombia
- 15.1.6 Ecuador
- 15.1.7 Venezuela
- 15.1.8 Rest of South America
- 16. North America MEA Diabetes Treatment Market Analysis, Insights and Forecast, 2019-2031
- 16.1. Market Analysis, Insights and Forecast - By Country/Sub-region
- 16.1.1 United States
- 16.1.2 Canada
- 16.1.3 Mexico
- 17. MEA MEA Diabetes Treatment Market Analysis, Insights and Forecast, 2019-2031
- 17.1. Market Analysis, Insights and Forecast - By Country/Sub-region
- 17.1.1 United Arab Emirates
- 17.1.2 Saudi Arabia
- 17.1.3 South Africa
- 17.1.4 Rest of Middle East and Africa
- 18. Competitive Analysis
- 18.1. Global Market Share Analysis 2024
- 18.2. Company Profiles
- 18.2.1 Pfizer
- 18.2.1.1. Overview
- 18.2.1.2. Products
- 18.2.1.3. SWOT Analysis
- 18.2.1.4. Recent Developments
- 18.2.1.5. Financials (Based on Availability)
- 18.2.2 Novo Nordisk AS
- 18.2.2.1. Overview
- 18.2.2.2. Products
- 18.2.2.3. SWOT Analysis
- 18.2.2.4. Recent Developments
- 18.2.2.5. Financials (Based on Availability)
- 18.2.3 SEDICO
- 18.2.3.1. Overview
- 18.2.3.2. Products
- 18.2.3.3. SWOT Analysis
- 18.2.3.4. Recent Developments
- 18.2.3.5. Financials (Based on Availability)
- 18.2.4 Julphar
- 18.2.4.1. Overview
- 18.2.4.2. Products
- 18.2.4.3. SWOT Analysis
- 18.2.4.4. Recent Developments
- 18.2.4.5. Financials (Based on Availability)
- 18.2.5 Wockhardt
- 18.2.5.1. Overview
- 18.2.5.2. Products
- 18.2.5.3. SWOT Analysis
- 18.2.5.4. Recent Developments
- 18.2.5.5. Financials (Based on Availability)
- 18.2.6 Eli Lilly
- 18.2.6.1. Overview
- 18.2.6.2. Products
- 18.2.6.3. SWOT Analysis
- 18.2.6.4. Recent Developments
- 18.2.6.5. Financials (Based on Availability)
- 18.2.7 Exir
- 18.2.7.1. Overview
- 18.2.7.2. Products
- 18.2.7.3. SWOT Analysis
- 18.2.7.4. Recent Developments
- 18.2.7.5. Financials (Based on Availability)
- 18.2.8 Eli Lilly and Company
- 18.2.8.1. Overview
- 18.2.8.2. Products
- 18.2.8.3. SWOT Analysis
- 18.2.8.4. Recent Developments
- 18.2.8.5. Financials (Based on Availability)
- 18.2.9 Sanofi Aventis
- 18.2.9.1. Overview
- 18.2.9.2. Products
- 18.2.9.3. SWOT Analysis
- 18.2.9.4. Recent Developments
- 18.2.9.5. Financials (Based on Availability)
- 18.2.10 Biocon
- 18.2.10.1. Overview
- 18.2.10.2. Products
- 18.2.10.3. SWOT Analysis
- 18.2.10.4. Recent Developments
- 18.2.10.5. Financials (Based on Availability)
- 18.2.11 Novo Nordisk
- 18.2.11.1. Overview
- 18.2.11.2. Products
- 18.2.11.3. SWOT Analysis
- 18.2.11.4. Recent Developments
- 18.2.11.5. Financials (Based on Availability)
- 18.2.12 Other Company Share Analyse
- 18.2.12.1. Overview
- 18.2.12.2. Products
- 18.2.12.3. SWOT Analysis
- 18.2.12.4. Recent Developments
- 18.2.12.5. Financials (Based on Availability)
- 18.2.1 Pfizer
List of Figures
- Figure 1: Global MEA Diabetes Treatment Market Revenue Breakdown (Million, %) by Region 2024 & 2032
- Figure 2: Global MEA Diabetes Treatment Market Volume Breakdown (K Unit, %) by Region 2024 & 2032
- Figure 3: North America MEA Diabetes Treatment Market Revenue (Million), by Country 2024 & 2032
- Figure 4: North America MEA Diabetes Treatment Market Volume (K Unit), by Country 2024 & 2032
- Figure 5: North America MEA Diabetes Treatment Market Revenue Share (%), by Country 2024 & 2032
- Figure 6: North America MEA Diabetes Treatment Market Volume Share (%), by Country 2024 & 2032
- Figure 7: Europe MEA Diabetes Treatment Market Revenue (Million), by Country 2024 & 2032
- Figure 8: Europe MEA Diabetes Treatment Market Volume (K Unit), by Country 2024 & 2032
- Figure 9: Europe MEA Diabetes Treatment Market Revenue Share (%), by Country 2024 & 2032
- Figure 10: Europe MEA Diabetes Treatment Market Volume Share (%), by Country 2024 & 2032
- Figure 11: Asia Pacific MEA Diabetes Treatment Market Revenue (Million), by Country 2024 & 2032
- Figure 12: Asia Pacific MEA Diabetes Treatment Market Volume (K Unit), by Country 2024 & 2032
- Figure 13: Asia Pacific MEA Diabetes Treatment Market Revenue Share (%), by Country 2024 & 2032
- Figure 14: Asia Pacific MEA Diabetes Treatment Market Volume Share (%), by Country 2024 & 2032
- Figure 15: South America MEA Diabetes Treatment Market Revenue (Million), by Country 2024 & 2032
- Figure 16: South America MEA Diabetes Treatment Market Volume (K Unit), by Country 2024 & 2032
- Figure 17: South America MEA Diabetes Treatment Market Revenue Share (%), by Country 2024 & 2032
- Figure 18: South America MEA Diabetes Treatment Market Volume Share (%), by Country 2024 & 2032
- Figure 19: North America MEA Diabetes Treatment Market Revenue (Million), by Country 2024 & 2032
- Figure 20: North America MEA Diabetes Treatment Market Volume (K Unit), by Country 2024 & 2032
- Figure 21: North America MEA Diabetes Treatment Market Revenue Share (%), by Country 2024 & 2032
- Figure 22: North America MEA Diabetes Treatment Market Volume Share (%), by Country 2024 & 2032
- Figure 23: MEA MEA Diabetes Treatment Market Revenue (Million), by Country 2024 & 2032
- Figure 24: MEA MEA Diabetes Treatment Market Volume (K Unit), by Country 2024 & 2032
- Figure 25: MEA MEA Diabetes Treatment Market Revenue Share (%), by Country 2024 & 2032
- Figure 26: MEA MEA Diabetes Treatment Market Volume Share (%), by Country 2024 & 2032
- Figure 27: Saudi Arabia MEA Diabetes Treatment Market Revenue (Million), by Product 2024 & 2032
- Figure 28: Saudi Arabia MEA Diabetes Treatment Market Volume (K Unit), by Product 2024 & 2032
- Figure 29: Saudi Arabia MEA Diabetes Treatment Market Revenue Share (%), by Product 2024 & 2032
- Figure 30: Saudi Arabia MEA Diabetes Treatment Market Volume Share (%), by Product 2024 & 2032
- Figure 31: Saudi Arabia MEA Diabetes Treatment Market Revenue (Million), by Geography 2024 & 2032
- Figure 32: Saudi Arabia MEA Diabetes Treatment Market Volume (K Unit), by Geography 2024 & 2032
- Figure 33: Saudi Arabia MEA Diabetes Treatment Market Revenue Share (%), by Geography 2024 & 2032
- Figure 34: Saudi Arabia MEA Diabetes Treatment Market Volume Share (%), by Geography 2024 & 2032
- Figure 35: Saudi Arabia MEA Diabetes Treatment Market Revenue (Million), by Country 2024 & 2032
- Figure 36: Saudi Arabia MEA Diabetes Treatment Market Volume (K Unit), by Country 2024 & 2032
- Figure 37: Saudi Arabia MEA Diabetes Treatment Market Revenue Share (%), by Country 2024 & 2032
- Figure 38: Saudi Arabia MEA Diabetes Treatment Market Volume Share (%), by Country 2024 & 2032
- Figure 39: Iran MEA Diabetes Treatment Market Revenue (Million), by Product 2024 & 2032
- Figure 40: Iran MEA Diabetes Treatment Market Volume (K Unit), by Product 2024 & 2032
- Figure 41: Iran MEA Diabetes Treatment Market Revenue Share (%), by Product 2024 & 2032
- Figure 42: Iran MEA Diabetes Treatment Market Volume Share (%), by Product 2024 & 2032
- Figure 43: Iran MEA Diabetes Treatment Market Revenue (Million), by Geography 2024 & 2032
- Figure 44: Iran MEA Diabetes Treatment Market Volume (K Unit), by Geography 2024 & 2032
- Figure 45: Iran MEA Diabetes Treatment Market Revenue Share (%), by Geography 2024 & 2032
- Figure 46: Iran MEA Diabetes Treatment Market Volume Share (%), by Geography 2024 & 2032
- Figure 47: Iran MEA Diabetes Treatment Market Revenue (Million), by Country 2024 & 2032
- Figure 48: Iran MEA Diabetes Treatment Market Volume (K Unit), by Country 2024 & 2032
- Figure 49: Iran MEA Diabetes Treatment Market Revenue Share (%), by Country 2024 & 2032
- Figure 50: Iran MEA Diabetes Treatment Market Volume Share (%), by Country 2024 & 2032
- Figure 51: Egypt MEA Diabetes Treatment Market Revenue (Million), by Product 2024 & 2032
- Figure 52: Egypt MEA Diabetes Treatment Market Volume (K Unit), by Product 2024 & 2032
- Figure 53: Egypt MEA Diabetes Treatment Market Revenue Share (%), by Product 2024 & 2032
- Figure 54: Egypt MEA Diabetes Treatment Market Volume Share (%), by Product 2024 & 2032
- Figure 55: Egypt MEA Diabetes Treatment Market Revenue (Million), by Geography 2024 & 2032
- Figure 56: Egypt MEA Diabetes Treatment Market Volume (K Unit), by Geography 2024 & 2032
- Figure 57: Egypt MEA Diabetes Treatment Market Revenue Share (%), by Geography 2024 & 2032
- Figure 58: Egypt MEA Diabetes Treatment Market Volume Share (%), by Geography 2024 & 2032
- Figure 59: Egypt MEA Diabetes Treatment Market Revenue (Million), by Country 2024 & 2032
- Figure 60: Egypt MEA Diabetes Treatment Market Volume (K Unit), by Country 2024 & 2032
- Figure 61: Egypt MEA Diabetes Treatment Market Revenue Share (%), by Country 2024 & 2032
- Figure 62: Egypt MEA Diabetes Treatment Market Volume Share (%), by Country 2024 & 2032
- Figure 63: Oman MEA Diabetes Treatment Market Revenue (Million), by Product 2024 & 2032
- Figure 64: Oman MEA Diabetes Treatment Market Volume (K Unit), by Product 2024 & 2032
- Figure 65: Oman MEA Diabetes Treatment Market Revenue Share (%), by Product 2024 & 2032
- Figure 66: Oman MEA Diabetes Treatment Market Volume Share (%), by Product 2024 & 2032
- Figure 67: Oman MEA Diabetes Treatment Market Revenue (Million), by Geography 2024 & 2032
- Figure 68: Oman MEA Diabetes Treatment Market Volume (K Unit), by Geography 2024 & 2032
- Figure 69: Oman MEA Diabetes Treatment Market Revenue Share (%), by Geography 2024 & 2032
- Figure 70: Oman MEA Diabetes Treatment Market Volume Share (%), by Geography 2024 & 2032
- Figure 71: Oman MEA Diabetes Treatment Market Revenue (Million), by Country 2024 & 2032
- Figure 72: Oman MEA Diabetes Treatment Market Volume (K Unit), by Country 2024 & 2032
- Figure 73: Oman MEA Diabetes Treatment Market Revenue Share (%), by Country 2024 & 2032
- Figure 74: Oman MEA Diabetes Treatment Market Volume Share (%), by Country 2024 & 2032
- Figure 75: South Africa MEA Diabetes Treatment Market Revenue (Million), by Product 2024 & 2032
- Figure 76: South Africa MEA Diabetes Treatment Market Volume (K Unit), by Product 2024 & 2032
- Figure 77: South Africa MEA Diabetes Treatment Market Revenue Share (%), by Product 2024 & 2032
- Figure 78: South Africa MEA Diabetes Treatment Market Volume Share (%), by Product 2024 & 2032
- Figure 79: South Africa MEA Diabetes Treatment Market Revenue (Million), by Geography 2024 & 2032
- Figure 80: South Africa MEA Diabetes Treatment Market Volume (K Unit), by Geography 2024 & 2032
- Figure 81: South Africa MEA Diabetes Treatment Market Revenue Share (%), by Geography 2024 & 2032
- Figure 82: South Africa MEA Diabetes Treatment Market Volume Share (%), by Geography 2024 & 2032
- Figure 83: South Africa MEA Diabetes Treatment Market Revenue (Million), by Country 2024 & 2032
- Figure 84: South Africa MEA Diabetes Treatment Market Volume (K Unit), by Country 2024 & 2032
- Figure 85: South Africa MEA Diabetes Treatment Market Revenue Share (%), by Country 2024 & 2032
- Figure 86: South Africa MEA Diabetes Treatment Market Volume Share (%), by Country 2024 & 2032
- Figure 87: Rest of Middle East and Africa MEA Diabetes Treatment Market Revenue (Million), by Product 2024 & 2032
- Figure 88: Rest of Middle East and Africa MEA Diabetes Treatment Market Volume (K Unit), by Product 2024 & 2032
- Figure 89: Rest of Middle East and Africa MEA Diabetes Treatment Market Revenue Share (%), by Product 2024 & 2032
- Figure 90: Rest of Middle East and Africa MEA Diabetes Treatment Market Volume Share (%), by Product 2024 & 2032
- Figure 91: Rest of Middle East and Africa MEA Diabetes Treatment Market Revenue (Million), by Geography 2024 & 2032
- Figure 92: Rest of Middle East and Africa MEA Diabetes Treatment Market Volume (K Unit), by Geography 2024 & 2032
- Figure 93: Rest of Middle East and Africa MEA Diabetes Treatment Market Revenue Share (%), by Geography 2024 & 2032
- Figure 94: Rest of Middle East and Africa MEA Diabetes Treatment Market Volume Share (%), by Geography 2024 & 2032
- Figure 95: Rest of Middle East and Africa MEA Diabetes Treatment Market Revenue (Million), by Country 2024 & 2032
- Figure 96: Rest of Middle East and Africa MEA Diabetes Treatment Market Volume (K Unit), by Country 2024 & 2032
- Figure 97: Rest of Middle East and Africa MEA Diabetes Treatment Market Revenue Share (%), by Country 2024 & 2032
- Figure 98: Rest of Middle East and Africa MEA Diabetes Treatment Market Volume Share (%), by Country 2024 & 2032
List of Tables
- Table 1: Global MEA Diabetes Treatment Market Revenue Million Forecast, by Region 2019 & 2032
- Table 2: Global MEA Diabetes Treatment Market Volume K Unit Forecast, by Region 2019 & 2032
- Table 3: Global MEA Diabetes Treatment Market Revenue Million Forecast, by Product 2019 & 2032
- Table 4: Global MEA Diabetes Treatment Market Volume K Unit Forecast, by Product 2019 & 2032
- Table 5: Global MEA Diabetes Treatment Market Revenue Million Forecast, by Geography 2019 & 2032
- Table 6: Global MEA Diabetes Treatment Market Volume K Unit Forecast, by Geography 2019 & 2032
- Table 7: Global MEA Diabetes Treatment Market Revenue Million Forecast, by Region 2019 & 2032
- Table 8: Global MEA Diabetes Treatment Market Volume K Unit Forecast, by Region 2019 & 2032
- Table 9: Global MEA Diabetes Treatment Market Revenue Million Forecast, by Country 2019 & 2032
- Table 10: Global MEA Diabetes Treatment Market Volume K Unit Forecast, by Country 2019 & 2032
- Table 11: United States MEA Diabetes Treatment Market Revenue (Million) Forecast, by Application 2019 & 2032
- Table 12: United States MEA Diabetes Treatment Market Volume (K Unit) Forecast, by Application 2019 & 2032
- Table 13: Canada MEA Diabetes Treatment Market Revenue (Million) Forecast, by Application 2019 & 2032
- Table 14: Canada MEA Diabetes Treatment Market Volume (K Unit) Forecast, by Application 2019 & 2032
- Table 15: Mexico MEA Diabetes Treatment Market Revenue (Million) Forecast, by Application 2019 & 2032
- Table 16: Mexico MEA Diabetes Treatment Market Volume (K Unit) Forecast, by Application 2019 & 2032
- Table 17: Global MEA Diabetes Treatment Market Revenue Million Forecast, by Country 2019 & 2032
- Table 18: Global MEA Diabetes Treatment Market Volume K Unit Forecast, by Country 2019 & 2032
- Table 19: Germany MEA Diabetes Treatment Market Revenue (Million) Forecast, by Application 2019 & 2032
- Table 20: Germany MEA Diabetes Treatment Market Volume (K Unit) Forecast, by Application 2019 & 2032
- Table 21: United Kingdom MEA Diabetes Treatment Market Revenue (Million) Forecast, by Application 2019 & 2032
- Table 22: United Kingdom MEA Diabetes Treatment Market Volume (K Unit) Forecast, by Application 2019 & 2032
- Table 23: France MEA Diabetes Treatment Market Revenue (Million) Forecast, by Application 2019 & 2032
- Table 24: France MEA Diabetes Treatment Market Volume (K Unit) Forecast, by Application 2019 & 2032
- Table 25: Spain MEA Diabetes Treatment Market Revenue (Million) Forecast, by Application 2019 & 2032
- Table 26: Spain MEA Diabetes Treatment Market Volume (K Unit) Forecast, by Application 2019 & 2032
- Table 27: Italy MEA Diabetes Treatment Market Revenue (Million) Forecast, by Application 2019 & 2032
- Table 28: Italy MEA Diabetes Treatment Market Volume (K Unit) Forecast, by Application 2019 & 2032
- Table 29: Spain MEA Diabetes Treatment Market Revenue (Million) Forecast, by Application 2019 & 2032
- Table 30: Spain MEA Diabetes Treatment Market Volume (K Unit) Forecast, by Application 2019 & 2032
- Table 31: Belgium MEA Diabetes Treatment Market Revenue (Million) Forecast, by Application 2019 & 2032
- Table 32: Belgium MEA Diabetes Treatment Market Volume (K Unit) Forecast, by Application 2019 & 2032
- Table 33: Netherland MEA Diabetes Treatment Market Revenue (Million) Forecast, by Application 2019 & 2032
- Table 34: Netherland MEA Diabetes Treatment Market Volume (K Unit) Forecast, by Application 2019 & 2032
- Table 35: Nordics MEA Diabetes Treatment Market Revenue (Million) Forecast, by Application 2019 & 2032
- Table 36: Nordics MEA Diabetes Treatment Market Volume (K Unit) Forecast, by Application 2019 & 2032
- Table 37: Rest of Europe MEA Diabetes Treatment Market Revenue (Million) Forecast, by Application 2019 & 2032
- Table 38: Rest of Europe MEA Diabetes Treatment Market Volume (K Unit) Forecast, by Application 2019 & 2032
- Table 39: Global MEA Diabetes Treatment Market Revenue Million Forecast, by Country 2019 & 2032
- Table 40: Global MEA Diabetes Treatment Market Volume K Unit Forecast, by Country 2019 & 2032
- Table 41: China MEA Diabetes Treatment Market Revenue (Million) Forecast, by Application 2019 & 2032
- Table 42: China MEA Diabetes Treatment Market Volume (K Unit) Forecast, by Application 2019 & 2032
- Table 43: Japan MEA Diabetes Treatment Market Revenue (Million) Forecast, by Application 2019 & 2032
- Table 44: Japan MEA Diabetes Treatment Market Volume (K Unit) Forecast, by Application 2019 & 2032
- Table 45: India MEA Diabetes Treatment Market Revenue (Million) Forecast, by Application 2019 & 2032
- Table 46: India MEA Diabetes Treatment Market Volume (K Unit) Forecast, by Application 2019 & 2032
- Table 47: South Korea MEA Diabetes Treatment Market Revenue (Million) Forecast, by Application 2019 & 2032
- Table 48: South Korea MEA Diabetes Treatment Market Volume (K Unit) Forecast, by Application 2019 & 2032
- Table 49: Southeast Asia MEA Diabetes Treatment Market Revenue (Million) Forecast, by Application 2019 & 2032
- Table 50: Southeast Asia MEA Diabetes Treatment Market Volume (K Unit) Forecast, by Application 2019 & 2032
- Table 51: Australia MEA Diabetes Treatment Market Revenue (Million) Forecast, by Application 2019 & 2032
- Table 52: Australia MEA Diabetes Treatment Market Volume (K Unit) Forecast, by Application 2019 & 2032
- Table 53: Indonesia MEA Diabetes Treatment Market Revenue (Million) Forecast, by Application 2019 & 2032
- Table 54: Indonesia MEA Diabetes Treatment Market Volume (K Unit) Forecast, by Application 2019 & 2032
- Table 55: Phillipes MEA Diabetes Treatment Market Revenue (Million) Forecast, by Application 2019 & 2032
- Table 56: Phillipes MEA Diabetes Treatment Market Volume (K Unit) Forecast, by Application 2019 & 2032
- Table 57: Singapore MEA Diabetes Treatment Market Revenue (Million) Forecast, by Application 2019 & 2032
- Table 58: Singapore MEA Diabetes Treatment Market Volume (K Unit) Forecast, by Application 2019 & 2032
- Table 59: Thailandc MEA Diabetes Treatment Market Revenue (Million) Forecast, by Application 2019 & 2032
- Table 60: Thailandc MEA Diabetes Treatment Market Volume (K Unit) Forecast, by Application 2019 & 2032
- Table 61: Rest of Asia Pacific MEA Diabetes Treatment Market Revenue (Million) Forecast, by Application 2019 & 2032
- Table 62: Rest of Asia Pacific MEA Diabetes Treatment Market Volume (K Unit) Forecast, by Application 2019 & 2032
- Table 63: Global MEA Diabetes Treatment Market Revenue Million Forecast, by Country 2019 & 2032
- Table 64: Global MEA Diabetes Treatment Market Volume K Unit Forecast, by Country 2019 & 2032
- Table 65: Brazil MEA Diabetes Treatment Market Revenue (Million) Forecast, by Application 2019 & 2032
- Table 66: Brazil MEA Diabetes Treatment Market Volume (K Unit) Forecast, by Application 2019 & 2032
- Table 67: Argentina MEA Diabetes Treatment Market Revenue (Million) Forecast, by Application 2019 & 2032
- Table 68: Argentina MEA Diabetes Treatment Market Volume (K Unit) Forecast, by Application 2019 & 2032
- Table 69: Peru MEA Diabetes Treatment Market Revenue (Million) Forecast, by Application 2019 & 2032
- Table 70: Peru MEA Diabetes Treatment Market Volume (K Unit) Forecast, by Application 2019 & 2032
- Table 71: Chile MEA Diabetes Treatment Market Revenue (Million) Forecast, by Application 2019 & 2032
- Table 72: Chile MEA Diabetes Treatment Market Volume (K Unit) Forecast, by Application 2019 & 2032
- Table 73: Colombia MEA Diabetes Treatment Market Revenue (Million) Forecast, by Application 2019 & 2032
- Table 74: Colombia MEA Diabetes Treatment Market Volume (K Unit) Forecast, by Application 2019 & 2032
- Table 75: Ecuador MEA Diabetes Treatment Market Revenue (Million) Forecast, by Application 2019 & 2032
- Table 76: Ecuador MEA Diabetes Treatment Market Volume (K Unit) Forecast, by Application 2019 & 2032
- Table 77: Venezuela MEA Diabetes Treatment Market Revenue (Million) Forecast, by Application 2019 & 2032
- Table 78: Venezuela MEA Diabetes Treatment Market Volume (K Unit) Forecast, by Application 2019 & 2032
- Table 79: Rest of South America MEA Diabetes Treatment Market Revenue (Million) Forecast, by Application 2019 & 2032
- Table 80: Rest of South America MEA Diabetes Treatment Market Volume (K Unit) Forecast, by Application 2019 & 2032
- Table 81: Global MEA Diabetes Treatment Market Revenue Million Forecast, by Country 2019 & 2032
- Table 82: Global MEA Diabetes Treatment Market Volume K Unit Forecast, by Country 2019 & 2032
- Table 83: United States MEA Diabetes Treatment Market Revenue (Million) Forecast, by Application 2019 & 2032
- Table 84: United States MEA Diabetes Treatment Market Volume (K Unit) Forecast, by Application 2019 & 2032
- Table 85: Canada MEA Diabetes Treatment Market Revenue (Million) Forecast, by Application 2019 & 2032
- Table 86: Canada MEA Diabetes Treatment Market Volume (K Unit) Forecast, by Application 2019 & 2032
- Table 87: Mexico MEA Diabetes Treatment Market Revenue (Million) Forecast, by Application 2019 & 2032
- Table 88: Mexico MEA Diabetes Treatment Market Volume (K Unit) Forecast, by Application 2019 & 2032
- Table 89: Global MEA Diabetes Treatment Market Revenue Million Forecast, by Country 2019 & 2032
- Table 90: Global MEA Diabetes Treatment Market Volume K Unit Forecast, by Country 2019 & 2032
- Table 91: United Arab Emirates MEA Diabetes Treatment Market Revenue (Million) Forecast, by Application 2019 & 2032
- Table 92: United Arab Emirates MEA Diabetes Treatment Market Volume (K Unit) Forecast, by Application 2019 & 2032
- Table 93: Saudi Arabia MEA Diabetes Treatment Market Revenue (Million) Forecast, by Application 2019 & 2032
- Table 94: Saudi Arabia MEA Diabetes Treatment Market Volume (K Unit) Forecast, by Application 2019 & 2032
- Table 95: South Africa MEA Diabetes Treatment Market Revenue (Million) Forecast, by Application 2019 & 2032
- Table 96: South Africa MEA Diabetes Treatment Market Volume (K Unit) Forecast, by Application 2019 & 2032
- Table 97: Rest of Middle East and Africa MEA Diabetes Treatment Market Revenue (Million) Forecast, by Application 2019 & 2032
- Table 98: Rest of Middle East and Africa MEA Diabetes Treatment Market Volume (K Unit) Forecast, by Application 2019 & 2032
- Table 99: Global MEA Diabetes Treatment Market Revenue Million Forecast, by Product 2019 & 2032
- Table 100: Global MEA Diabetes Treatment Market Volume K Unit Forecast, by Product 2019 & 2032
- Table 101: Global MEA Diabetes Treatment Market Revenue Million Forecast, by Geography 2019 & 2032
- Table 102: Global MEA Diabetes Treatment Market Volume K Unit Forecast, by Geography 2019 & 2032
- Table 103: Global MEA Diabetes Treatment Market Revenue Million Forecast, by Country 2019 & 2032
- Table 104: Global MEA Diabetes Treatment Market Volume K Unit Forecast, by Country 2019 & 2032
- Table 105: Global MEA Diabetes Treatment Market Revenue Million Forecast, by Product 2019 & 2032
- Table 106: Global MEA Diabetes Treatment Market Volume K Unit Forecast, by Product 2019 & 2032
- Table 107: Global MEA Diabetes Treatment Market Revenue Million Forecast, by Geography 2019 & 2032
- Table 108: Global MEA Diabetes Treatment Market Volume K Unit Forecast, by Geography 2019 & 2032
- Table 109: Global MEA Diabetes Treatment Market Revenue Million Forecast, by Country 2019 & 2032
- Table 110: Global MEA Diabetes Treatment Market Volume K Unit Forecast, by Country 2019 & 2032
- Table 111: Global MEA Diabetes Treatment Market Revenue Million Forecast, by Product 2019 & 2032
- Table 112: Global MEA Diabetes Treatment Market Volume K Unit Forecast, by Product 2019 & 2032
- Table 113: Global MEA Diabetes Treatment Market Revenue Million Forecast, by Geography 2019 & 2032
- Table 114: Global MEA Diabetes Treatment Market Volume K Unit Forecast, by Geography 2019 & 2032
- Table 115: Global MEA Diabetes Treatment Market Revenue Million Forecast, by Country 2019 & 2032
- Table 116: Global MEA Diabetes Treatment Market Volume K Unit Forecast, by Country 2019 & 2032
- Table 117: Global MEA Diabetes Treatment Market Revenue Million Forecast, by Product 2019 & 2032
- Table 118: Global MEA Diabetes Treatment Market Volume K Unit Forecast, by Product 2019 & 2032
- Table 119: Global MEA Diabetes Treatment Market Revenue Million Forecast, by Geography 2019 & 2032
- Table 120: Global MEA Diabetes Treatment Market Volume K Unit Forecast, by Geography 2019 & 2032
- Table 121: Global MEA Diabetes Treatment Market Revenue Million Forecast, by Country 2019 & 2032
- Table 122: Global MEA Diabetes Treatment Market Volume K Unit Forecast, by Country 2019 & 2032
- Table 123: Global MEA Diabetes Treatment Market Revenue Million Forecast, by Product 2019 & 2032
- Table 124: Global MEA Diabetes Treatment Market Volume K Unit Forecast, by Product 2019 & 2032
- Table 125: Global MEA Diabetes Treatment Market Revenue Million Forecast, by Geography 2019 & 2032
- Table 126: Global MEA Diabetes Treatment Market Volume K Unit Forecast, by Geography 2019 & 2032
- Table 127: Global MEA Diabetes Treatment Market Revenue Million Forecast, by Country 2019 & 2032
- Table 128: Global MEA Diabetes Treatment Market Volume K Unit Forecast, by Country 2019 & 2032
- Table 129: Global MEA Diabetes Treatment Market Revenue Million Forecast, by Product 2019 & 2032
- Table 130: Global MEA Diabetes Treatment Market Volume K Unit Forecast, by Product 2019 & 2032
- Table 131: Global MEA Diabetes Treatment Market Revenue Million Forecast, by Geography 2019 & 2032
- Table 132: Global MEA Diabetes Treatment Market Volume K Unit Forecast, by Geography 2019 & 2032
- Table 133: Global MEA Diabetes Treatment Market Revenue Million Forecast, by Country 2019 & 2032
- Table 134: Global MEA Diabetes Treatment Market Volume K Unit Forecast, by Country 2019 & 2032
Frequently Asked Questions
1. What is the projected Compound Annual Growth Rate (CAGR) of the MEA Diabetes Treatment Market?
The projected CAGR is approximately 3.78%.
2. Which companies are prominent players in the MEA Diabetes Treatment Market?
Key companies in the market include Pfizer, Novo Nordisk AS, SEDICO, Julphar, Wockhardt, Eli Lilly, Exir, Eli Lilly and Company, Sanofi Aventis, Biocon, Novo Nordisk, Other Company Share Analyse.
3. What are the main segments of the MEA Diabetes Treatment Market?
The market segments include Product, Geography.
4. Can you provide details about the market size?
The market size is estimated to be USD 1.62 Million as of 2022.
5. What are some drivers contributing to market growth?
; The Rise in Global Prevalence of Cases of Obesity due to Modern Sedentary Lifestyles; Rise in Awareness and Disposable Income in Developed Economies.
6. What are the notable trends driving market growth?
Biosimilar Insulin Segment Holds Highest Market Share in Middle-East and Africa Human Insulin Market..
7. Are there any restraints impacting market growth?
; Highly Cost of Branded Products in Emerging Countries; Severe Adverse Associated with Medication Including Seizures. Suicidal Attempts and Even Death; Adoption of Traditional Yoga and Herbal Products.
8. Can you provide examples of recent developments in the market?
February 2023: South Korea-based EOFlow, a provider of wearable drug delivery solutions, received certification from the United Arab Emirate (UAE) Ministry of Health and Prevention (MOHAP) to commercialize its wearable insulin pump 'EOPatch' and its controller 'ADM' as well as its smartphone app 'Narsha'. EOFlow said that this UAE launch marks the first entry of EOPatches in the Middle East. The UAE is EOFlow's second overseas sales region after Europe. It was expected to serve as a bridgehead for exporting wearable insulin pump solutions to Middle East and North Africa (MENA) countries.
9. What pricing options are available for accessing the report?
Pricing options include single-user, multi-user, and enterprise licenses priced at USD 4750, USD 5250, and USD 8750 respectively.
10. Is the market size provided in terms of value or volume?
The market size is provided in terms of value, measured in Million and volume, measured in K Unit.
11. Are there any specific market keywords associated with the report?
Yes, the market keyword associated with the report is "MEA Diabetes Treatment Market," which aids in identifying and referencing the specific market segment covered.
12. How do I determine which pricing option suits my needs best?
The pricing options vary based on user requirements and access needs. Individual users may opt for single-user licenses, while businesses requiring broader access may choose multi-user or enterprise licenses for cost-effective access to the report.
13. Are there any additional resources or data provided in the MEA Diabetes Treatment Market report?
While the report offers comprehensive insights, it's advisable to review the specific contents or supplementary materials provided to ascertain if additional resources or data are available.
14. How can I stay updated on further developments or reports in the MEA Diabetes Treatment Market?
To stay informed about further developments, trends, and reports in the MEA Diabetes Treatment Market, consider subscribing to industry newsletters, following relevant companies and organizations, or regularly checking reputable industry news sources and publications.
Methodology
Step 1 - Identification of Relevant Samples Size from Population Database


Step 2 - Approaches for Defining Global Market Size (Value, Volume* & Price*)

Note*: In applicable scenarios
Step 3 - Data Sources
Primary Research
- Web Analytics
- Survey Reports
- Research Institute
- Latest Research Reports
- Opinion Leaders
Secondary Research
- Annual Reports
- White Paper
- Latest Press Release
- Industry Association
- Paid Database
- Investor Presentations

Step 4 - Data Triangulation
Involves using different sources of information in order to increase the validity of a study
These sources are likely to be stakeholders in a program - participants, other researchers, program staff, other community members, and so on.
Then we put all data in single framework & apply various statistical tools to find out the dynamic on the market.
During the analysis stage, feedback from the stakeholder groups would be compared to determine areas of agreement as well as areas of divergence


