
Key Insights
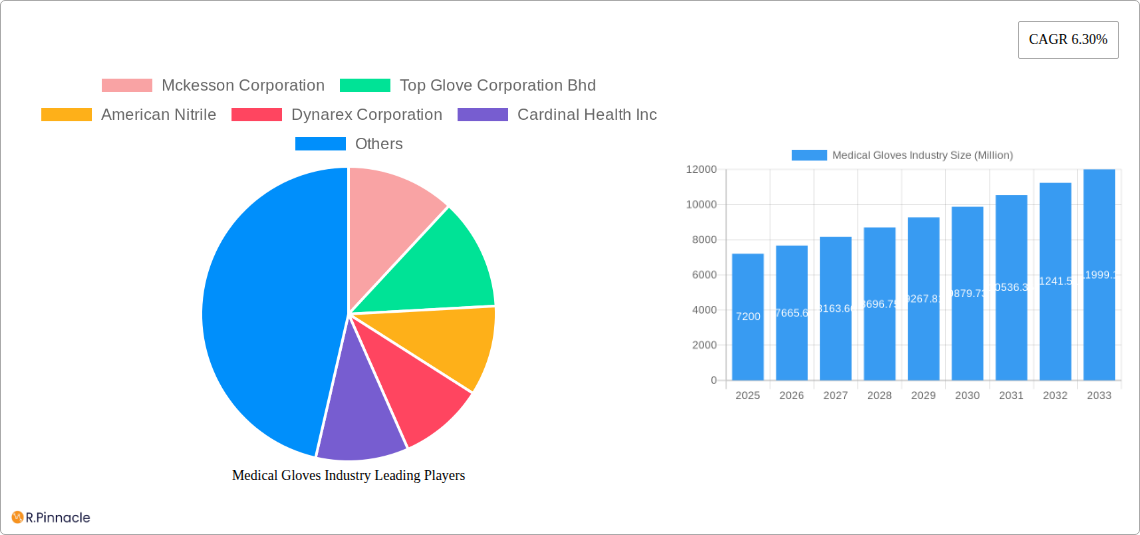
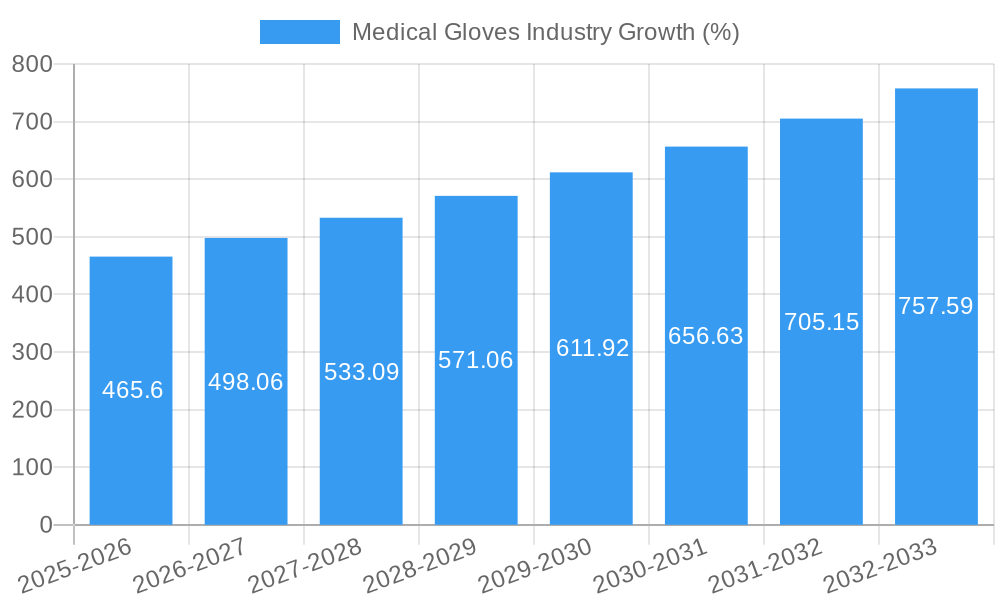
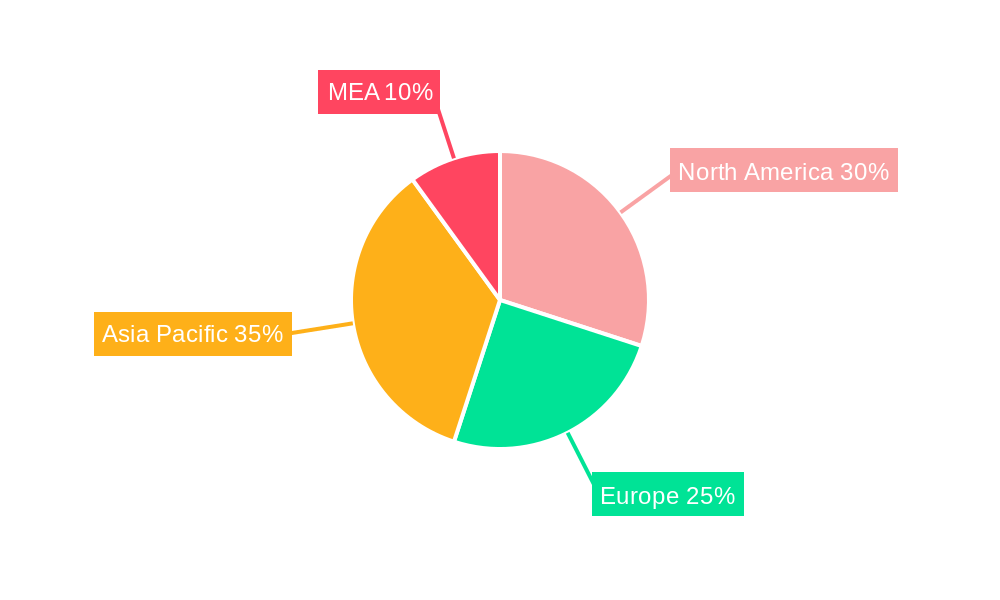
The global medical gloves market, valued at $7.2 billion in 2025, is projected to experience robust growth, driven by a compound annual growth rate (CAGR) of 6.30% from 2025 to 2033. This expansion is fueled by several key factors. The escalating prevalence of infectious diseases, coupled with heightened awareness of infection control protocols within healthcare settings, significantly boosts demand for medical gloves. Furthermore, the increasing number of surgical procedures and minimally invasive surgeries necessitates a substantial supply of sterile and high-quality gloves. Technological advancements in glove manufacturing, leading to improved durability, comfort, and enhanced barrier protection, are also contributing to market growth. The market is segmented by glove type (powdered and non-powdered), material (natural rubber, nitrile, vinyl, and others), and application (medical examination, surgery, chemotherapy, and other applications). Nitrile gloves, known for their superior puncture resistance and hypoallergenic properties, are witnessing particularly strong growth, gradually replacing latex gloves due to allergy concerns. The rise of e-commerce and online distribution channels is enhancing accessibility, while increasing regulatory scrutiny ensures safety standards are maintained. Geographic expansion is also contributing to market growth, with developing economies in Asia-Pacific experiencing rapid growth due to improved healthcare infrastructure.
Major players in the market, including McKesson Corporation, Top Glove Corporation Bhd, and Cardinal Health Inc., are actively involved in innovation, strategic partnerships, and geographic expansion to maintain their market share and capitalize on growth opportunities. The increasing adoption of single-use gloves in various healthcare settings is a significant trend influencing market growth. However, fluctuations in raw material prices and stringent regulatory compliance requirements pose potential challenges to market expansion. The competitive landscape is characterized by both established players and emerging companies competing on factors like product quality, pricing, and innovation. The forecast period (2025-2033) will likely see continued market expansion, driven by the factors mentioned above, with nitrile gloves and the Asia-Pacific region leading the growth trajectory.
Medical Gloves Industry Market Report: 2019-2033
This comprehensive report provides an in-depth analysis of the global medical gloves market, offering valuable insights for industry professionals, investors, and strategic decision-makers. Covering the period from 2019 to 2033, with a focus on 2025, this report meticulously examines market structure, dynamics, key players, and future growth prospects. The study period is 2019–2033, with 2025 as the base and estimated year. The forecast period is 2025–2033, and the historical period is 2019–2024. The market is valued in Millions.
Medical Gloves Industry Market Structure & Innovation Trends
The medical gloves market is characterized by a moderately concentrated structure, with several key players holding significant market share. Mckesson Corporation, Top Glove Corporation Bhd, and Cardinal Health Inc. are among the leading companies, commanding a combined xx% market share in 2024 (estimated). Innovation in this sector is driven by the need for enhanced safety, improved comfort, and reduced healthcare costs. Stringent regulatory frameworks, particularly concerning material safety and manufacturing processes, are crucial in maintaining quality and safety standards. Product substitutes, including alternatives made from different materials or advancements in alternative technologies, present a continuous challenge to established players. End-user demographics play a critical role, with hospitals and clinics representing the largest consumer base. Mergers and acquisitions (M&A) activities have been relatively active, with deal values exceeding xx Million in recent years, reflecting the industry's consolidation and strategic expansion efforts. Notable examples include [insert specific M&A examples with values if available; otherwise state "Specific M&A details are not publicly available."].
- Market Concentration: Moderately concentrated, with top players holding xx% market share.
- Innovation Drivers: Enhanced safety, improved comfort, cost reduction.
- Regulatory Landscape: Stringent regulations on material safety and manufacturing.
- Product Substitutes: Emergence of alternative materials and technologies.
- M&A Activity: Deal values exceeding xx Million in recent years.
Medical Gloves Industry Market Dynamics & Trends
The medical gloves market is experiencing significant growth, driven by several key factors. The rising prevalence of infectious diseases, particularly in the wake of recent pandemics, has dramatically increased the demand for gloves. The expanding healthcare sector globally, coupled with technological advancements leading to improved glove materials and designs, is fuelling market expansion. Consumer preferences are shifting towards more comfortable and durable gloves, particularly non-powdered nitrile options. Competitive dynamics are intense, with companies focusing on product differentiation, cost optimization, and supply chain resilience. The compound annual growth rate (CAGR) from 2025 to 2033 is projected at xx%, with market penetration expected to reach xx% by 2033. This growth is further influenced by increasing awareness of infection control practices and the growing adoption of personal protective equipment (PPE) in various healthcare settings.
Dominant Regions & Segments in Medical Gloves Industry
The [Insert dominant region, e.g., North America or Asia-Pacific] region dominates the global medical gloves market, fueled by strong healthcare infrastructure, high healthcare expenditure, and a large patient pool. Within this region, [Insert dominant country, e.g., the United States or China] exhibits particularly high demand.
Key Drivers:
- Economic Factors: High healthcare expenditure and robust economic growth.
- Infrastructure: Well-developed healthcare systems and robust distribution networks.
- Regulatory Environment: Supportive regulations promoting healthcare safety.
Dominant Segments:
Type: Non-powdered gloves hold the largest market share due to their enhanced safety and hygiene.
Material: Nitrile gloves dominate due to their superior puncture resistance and durability compared to natural rubber and vinyl.
Application: Medical examination and surgery are the major application segments.
The detailed dominance analysis shows that [explain in detail why these segments and regions are dominant, focusing on specific market drivers, trends, and competitive dynamics].
Medical Gloves Industry Product Innovations
Recent advancements in medical glove technology include the development of more comfortable and durable materials, such as advanced polymers and synthetic rubbers, improved designs that reduce hand fatigue, and innovations in glove sterilization and packaging to enhance safety and hygiene. These innovations focus on meeting the growing demand for better protection and user experience, directly addressing market needs and competitive pressures. The incorporation of antimicrobial agents and improved tactile sensitivity also reflects ongoing innovation.
Report Scope & Segmentation Analysis
This report segments the medical gloves market by type (powdered, non-powdered), material (natural rubber, nitrile, vinyl, other), and application (medical examination, surgery, chemotherapy, other). Each segment is analyzed based on its market size, growth projections, and competitive landscape. For example, the non-powdered segment is expected to experience significant growth due to increasing awareness of safety concerns related to powdered gloves, while the nitrile segment continues to dominate due to its superior properties. Similarly, the medical examination and surgery applications drive substantial market demand.
Key Drivers of Medical Gloves Industry Growth
Several factors contribute to the growth of the medical gloves industry. The rising prevalence of infectious diseases, especially in light of recent pandemics, and stringent infection control protocols in healthcare settings significantly boost demand. Technological advancements, including the development of advanced materials and manufacturing processes, are also key drivers. Additionally, favorable regulatory environments and increasing healthcare expenditure across many regions contribute to substantial market expansion.
Challenges in the Medical Gloves Industry Sector
The medical gloves industry faces significant challenges, including fluctuating raw material prices, particularly for natural rubber, impacting production costs and margins. Supply chain disruptions can cause production bottlenecks and shortages. Intense competition amongst market players, with companies vying for market share through pricing strategies and product differentiation, represents another significant hurdle. Regulatory compliance and stringent quality control measures add to the operational complexities and cost burdens.
Emerging Opportunities in Medical Gloves Industry
Emerging opportunities exist in the development and commercialization of specialized gloves for specific applications, such as those designed for chemotherapy or minimally invasive surgery. The increasing demand for eco-friendly and sustainable alternatives to traditional glove materials offers prospects for innovation. The penetration of medical gloves into new markets, such as home healthcare and dental practices, presents further expansion potential.
Leading Players in the Medical Gloves Industry Market
- Mckesson Corporation
- Top Glove Corporation Bhd
- American Nitrile
- Dynarex Corporation
- Cardinal Health Inc
- 3M Company
- Semperit AG Holding
- Hartalega Holdings Berhad
- B Braun Melsungen AG
- Medline Industries Inc
- Honeywell International Inc
- Ansell Limited
Key Developments in Medical Gloves Industry
- November 2022: Vizient Inc. partnered with SafeSource Direct to increase the supply of chemo-rated nitrile gloves.
- January 2023: The Medicom group announced plans to build a nitrile glove factory (ManiKHeir) via its subsidiary Kolmi-Hopen.
Future Outlook for Medical Gloves Industry Market
The medical gloves market is poised for continued growth, driven by long-term trends such as the aging global population, the increasing prevalence of chronic diseases, and the persistent need for infection control in healthcare settings. The focus on innovation, including the development of advanced materials and specialized glove designs, presents significant opportunities for market expansion. Strategic partnerships and investments in enhancing supply chain resilience will be crucial for maintaining market leadership and meeting future demand.
Medical Gloves Industry Segmentation
-
1. Type
- 1.1. Powdered
- 1.2. Non-powdered
-
2. Material
- 2.1. Natural Rubber Gloves
- 2.2. Nitrile Gloves
- 2.3. Vinyl Gloves
- 2.4. Other Materials
-
3. Application
- 3.1. Medical Examination
- 3.2. Surgery
- 3.3. Chemotherapy
- 3.4. Other Applications
Medical Gloves Industry Segmentation By Geography
-
1. North America
- 1.1. United States
- 1.2. Canada
- 1.3. Mexico
-
2. Europe
- 2.1. Germany
- 2.2. United Kingdom
- 2.3. France
- 2.4. Italy
- 2.5. Spain
- 2.6. Rest of Europe
-
3. Asia Pacific
- 3.1. China
- 3.2. Japan
- 3.3. India
- 3.4. Australia
- 3.5. South Korea
- 3.6. Rest of Asia Pacific
- 4. Middle East
-
5. GCC
- 5.1. South Africa
- 5.2. Rest of Middle East
-
6. South America
- 6.1. Brazil
- 6.2. Argentina
- 6.3. Rest of South America
Medical Gloves Industry REPORT HIGHLIGHTS
| Aspects | Details |
|---|---|
| Study Period | 2019-2033 |
| Base Year | 2024 |
| Estimated Year | 2025 |
| Forecast Period | 2025-2033 |
| Historical Period | 2019-2024 |
| Growth Rate | CAGR of 6.30% from 2019-2033 |
| Segmentation |
|
Table of Contents
- 1. Introduction
- 1.1. Research Scope
- 1.2. Market Segmentation
- 1.3. Research Methodology
- 1.4. Definitions and Assumptions
- 2. Executive Summary
- 2.1. Introduction
- 3. Market Dynamics
- 3.1. Introduction
- 3.2. Market Drivers
- 3.2.1 Growing awareness about hygiene standards and infection control in healthcare settings has increased the demand for medical gloves. Healthcare professionals rely on gloves for protection against infectious diseases and contaminants during examinations
- 3.2.2 surgeries
- 3.2.3 and patient care
- 3.3. Market Restrains
- 3.3.1 The cost of raw materials
- 3.3.2 particularly latex and nitrile
- 3.3.3 fluctuates based on market demand and supply. This can impact the production cost and pricing of medical gloves
- 3.4. Market Trends
- 3.4.1 Automation in glove production will improve manufacturing efficiency
- 3.4.2 reduce costs
- 3.4.3 and ensure consistent product quality. This trend is likely to grow as demand continues to increase globally
- 4. Market Factor Analysis
- 4.1. Porters Five Forces
- 4.2. Supply/Value Chain
- 4.3. PESTEL analysis
- 4.4. Market Entropy
- 4.5. Patent/Trademark Analysis
- 5. Global Medical Gloves Industry Analysis, Insights and Forecast, 2019-2031
- 5.1. Market Analysis, Insights and Forecast - by Type
- 5.1.1. Powdered
- 5.1.2. Non-powdered
- 5.2. Market Analysis, Insights and Forecast - by Material
- 5.2.1. Natural Rubber Gloves
- 5.2.2. Nitrile Gloves
- 5.2.3. Vinyl Gloves
- 5.2.4. Other Materials
- 5.3. Market Analysis, Insights and Forecast - by Application
- 5.3.1. Medical Examination
- 5.3.2. Surgery
- 5.3.3. Chemotherapy
- 5.3.4. Other Applications
- 5.4. Market Analysis, Insights and Forecast - by Region
- 5.4.1. North America
- 5.4.2. Europe
- 5.4.3. Asia Pacific
- 5.4.4. Middle East
- 5.4.5. GCC
- 5.4.6. South America
- 5.1. Market Analysis, Insights and Forecast - by Type
- 6. North America Medical Gloves Industry Analysis, Insights and Forecast, 2019-2031
- 6.1. Market Analysis, Insights and Forecast - by Type
- 6.1.1. Powdered
- 6.1.2. Non-powdered
- 6.2. Market Analysis, Insights and Forecast - by Material
- 6.2.1. Natural Rubber Gloves
- 6.2.2. Nitrile Gloves
- 6.2.3. Vinyl Gloves
- 6.2.4. Other Materials
- 6.3. Market Analysis, Insights and Forecast - by Application
- 6.3.1. Medical Examination
- 6.3.2. Surgery
- 6.3.3. Chemotherapy
- 6.3.4. Other Applications
- 6.1. Market Analysis, Insights and Forecast - by Type
- 7. Europe Medical Gloves Industry Analysis, Insights and Forecast, 2019-2031
- 7.1. Market Analysis, Insights and Forecast - by Type
- 7.1.1. Powdered
- 7.1.2. Non-powdered
- 7.2. Market Analysis, Insights and Forecast - by Material
- 7.2.1. Natural Rubber Gloves
- 7.2.2. Nitrile Gloves
- 7.2.3. Vinyl Gloves
- 7.2.4. Other Materials
- 7.3. Market Analysis, Insights and Forecast - by Application
- 7.3.1. Medical Examination
- 7.3.2. Surgery
- 7.3.3. Chemotherapy
- 7.3.4. Other Applications
- 7.1. Market Analysis, Insights and Forecast - by Type
- 8. Asia Pacific Medical Gloves Industry Analysis, Insights and Forecast, 2019-2031
- 8.1. Market Analysis, Insights and Forecast - by Type
- 8.1.1. Powdered
- 8.1.2. Non-powdered
- 8.2. Market Analysis, Insights and Forecast - by Material
- 8.2.1. Natural Rubber Gloves
- 8.2.2. Nitrile Gloves
- 8.2.3. Vinyl Gloves
- 8.2.4. Other Materials
- 8.3. Market Analysis, Insights and Forecast - by Application
- 8.3.1. Medical Examination
- 8.3.2. Surgery
- 8.3.3. Chemotherapy
- 8.3.4. Other Applications
- 8.1. Market Analysis, Insights and Forecast - by Type
- 9. Middle East Medical Gloves Industry Analysis, Insights and Forecast, 2019-2031
- 9.1. Market Analysis, Insights and Forecast - by Type
- 9.1.1. Powdered
- 9.1.2. Non-powdered
- 9.2. Market Analysis, Insights and Forecast - by Material
- 9.2.1. Natural Rubber Gloves
- 9.2.2. Nitrile Gloves
- 9.2.3. Vinyl Gloves
- 9.2.4. Other Materials
- 9.3. Market Analysis, Insights and Forecast - by Application
- 9.3.1. Medical Examination
- 9.3.2. Surgery
- 9.3.3. Chemotherapy
- 9.3.4. Other Applications
- 9.1. Market Analysis, Insights and Forecast - by Type
- 10. GCC Medical Gloves Industry Analysis, Insights and Forecast, 2019-2031
- 10.1. Market Analysis, Insights and Forecast - by Type
- 10.1.1. Powdered
- 10.1.2. Non-powdered
- 10.2. Market Analysis, Insights and Forecast - by Material
- 10.2.1. Natural Rubber Gloves
- 10.2.2. Nitrile Gloves
- 10.2.3. Vinyl Gloves
- 10.2.4. Other Materials
- 10.3. Market Analysis, Insights and Forecast - by Application
- 10.3.1. Medical Examination
- 10.3.2. Surgery
- 10.3.3. Chemotherapy
- 10.3.4. Other Applications
- 10.1. Market Analysis, Insights and Forecast - by Type
- 11. South America Medical Gloves Industry Analysis, Insights and Forecast, 2019-2031
- 11.1. Market Analysis, Insights and Forecast - by Type
- 11.1.1. Powdered
- 11.1.2. Non-powdered
- 11.2. Market Analysis, Insights and Forecast - by Material
- 11.2.1. Natural Rubber Gloves
- 11.2.2. Nitrile Gloves
- 11.2.3. Vinyl Gloves
- 11.2.4. Other Materials
- 11.3. Market Analysis, Insights and Forecast - by Application
- 11.3.1. Medical Examination
- 11.3.2. Surgery
- 11.3.3. Chemotherapy
- 11.3.4. Other Applications
- 11.1. Market Analysis, Insights and Forecast - by Type
- 12. North America Medical Gloves Industry Analysis, Insights and Forecast, 2019-2031
- 12.1. Market Analysis, Insights and Forecast - By Country/Sub-region
- 12.1.1 United States
- 12.1.2 Canada
- 12.1.3 Mexico
- 13. South America Medical Gloves Industry Analysis, Insights and Forecast, 2019-2031
- 13.1. Market Analysis, Insights and Forecast - By Country/Sub-region
- 13.1.1 Brazil
- 13.1.2 Mexico
- 13.1.3 Rest of South America
- 14. Europe Medical Gloves Industry Analysis, Insights and Forecast, 2019-2031
- 14.1. Market Analysis, Insights and Forecast - By Country/Sub-region
- 14.1.1 United Kingdom
- 14.1.2 Germany
- 14.1.3 France
- 14.1.4 Italy
- 14.1.5 Spain
- 14.1.6 Russia
- 14.1.7 Rest of Europe
- 15. Asia Pacific Medical Gloves Industry Analysis, Insights and Forecast, 2019-2031
- 15.1. Market Analysis, Insights and Forecast - By Country/Sub-region
- 15.1.1 China
- 15.1.2 Japan
- 15.1.3 India
- 15.1.4 South Korea
- 15.1.5 Taiwan
- 15.1.6 Australia
- 15.1.7 Rest of Asia-Pacific
- 16. MEA Medical Gloves Industry Analysis, Insights and Forecast, 2019-2031
- 16.1. Market Analysis, Insights and Forecast - By Country/Sub-region
- 16.1.1 Middle East
- 16.1.2 Africa
- 17. Competitive Analysis
- 17.1. Global Market Share Analysis 2024
- 17.2. Company Profiles
- 17.2.1 Mckesson Corporation
- 17.2.1.1. Overview
- 17.2.1.2. Products
- 17.2.1.3. SWOT Analysis
- 17.2.1.4. Recent Developments
- 17.2.1.5. Financials (Based on Availability)
- 17.2.2 Top Glove Corporation Bhd
- 17.2.2.1. Overview
- 17.2.2.2. Products
- 17.2.2.3. SWOT Analysis
- 17.2.2.4. Recent Developments
- 17.2.2.5. Financials (Based on Availability)
- 17.2.3 American Nitrile
- 17.2.3.1. Overview
- 17.2.3.2. Products
- 17.2.3.3. SWOT Analysis
- 17.2.3.4. Recent Developments
- 17.2.3.5. Financials (Based on Availability)
- 17.2.4 Dynarex Corporation
- 17.2.4.1. Overview
- 17.2.4.2. Products
- 17.2.4.3. SWOT Analysis
- 17.2.4.4. Recent Developments
- 17.2.4.5. Financials (Based on Availability)
- 17.2.5 Cardinal Health Inc
- 17.2.5.1. Overview
- 17.2.5.2. Products
- 17.2.5.3. SWOT Analysis
- 17.2.5.4. Recent Developments
- 17.2.5.5. Financials (Based on Availability)
- 17.2.6 3M Company
- 17.2.6.1. Overview
- 17.2.6.2. Products
- 17.2.6.3. SWOT Analysis
- 17.2.6.4. Recent Developments
- 17.2.6.5. Financials (Based on Availability)
- 17.2.7 Semperit AG Holding
- 17.2.7.1. Overview
- 17.2.7.2. Products
- 17.2.7.3. SWOT Analysis
- 17.2.7.4. Recent Developments
- 17.2.7.5. Financials (Based on Availability)
- 17.2.8 Hartalega Holdings Berhad
- 17.2.8.1. Overview
- 17.2.8.2. Products
- 17.2.8.3. SWOT Analysis
- 17.2.8.4. Recent Developments
- 17.2.8.5. Financials (Based on Availability)
- 17.2.9 B Braun Melsungen AG
- 17.2.9.1. Overview
- 17.2.9.2. Products
- 17.2.9.3. SWOT Analysis
- 17.2.9.4. Recent Developments
- 17.2.9.5. Financials (Based on Availability)
- 17.2.10 Medline Industries Inc
- 17.2.10.1. Overview
- 17.2.10.2. Products
- 17.2.10.3. SWOT Analysis
- 17.2.10.4. Recent Developments
- 17.2.10.5. Financials (Based on Availability)
- 17.2.11 Honeywell International Inc
- 17.2.11.1. Overview
- 17.2.11.2. Products
- 17.2.11.3. SWOT Analysis
- 17.2.11.4. Recent Developments
- 17.2.11.5. Financials (Based on Availability)
- 17.2.12 Ansell Limited
- 17.2.12.1. Overview
- 17.2.12.2. Products
- 17.2.12.3. SWOT Analysis
- 17.2.12.4. Recent Developments
- 17.2.12.5. Financials (Based on Availability)
- 17.2.1 Mckesson Corporation
List of Figures
- Figure 1: Global Medical Gloves Industry Revenue Breakdown (Million, %) by Region 2024 & 2032
- Figure 2: Global Medical Gloves Industry Volume Breakdown (K Units, %) by Region 2024 & 2032
- Figure 3: North America Medical Gloves Industry Revenue (Million), by Country 2024 & 2032
- Figure 4: North America Medical Gloves Industry Volume (K Units), by Country 2024 & 2032
- Figure 5: North America Medical Gloves Industry Revenue Share (%), by Country 2024 & 2032
- Figure 6: North America Medical Gloves Industry Volume Share (%), by Country 2024 & 2032
- Figure 7: South America Medical Gloves Industry Revenue (Million), by Country 2024 & 2032
- Figure 8: South America Medical Gloves Industry Volume (K Units), by Country 2024 & 2032
- Figure 9: South America Medical Gloves Industry Revenue Share (%), by Country 2024 & 2032
- Figure 10: South America Medical Gloves Industry Volume Share (%), by Country 2024 & 2032
- Figure 11: Europe Medical Gloves Industry Revenue (Million), by Country 2024 & 2032
- Figure 12: Europe Medical Gloves Industry Volume (K Units), by Country 2024 & 2032
- Figure 13: Europe Medical Gloves Industry Revenue Share (%), by Country 2024 & 2032
- Figure 14: Europe Medical Gloves Industry Volume Share (%), by Country 2024 & 2032
- Figure 15: Asia Pacific Medical Gloves Industry Revenue (Million), by Country 2024 & 2032
- Figure 16: Asia Pacific Medical Gloves Industry Volume (K Units), by Country 2024 & 2032
- Figure 17: Asia Pacific Medical Gloves Industry Revenue Share (%), by Country 2024 & 2032
- Figure 18: Asia Pacific Medical Gloves Industry Volume Share (%), by Country 2024 & 2032
- Figure 19: MEA Medical Gloves Industry Revenue (Million), by Country 2024 & 2032
- Figure 20: MEA Medical Gloves Industry Volume (K Units), by Country 2024 & 2032
- Figure 21: MEA Medical Gloves Industry Revenue Share (%), by Country 2024 & 2032
- Figure 22: MEA Medical Gloves Industry Volume Share (%), by Country 2024 & 2032
- Figure 23: North America Medical Gloves Industry Revenue (Million), by Type 2024 & 2032
- Figure 24: North America Medical Gloves Industry Volume (K Units), by Type 2024 & 2032
- Figure 25: North America Medical Gloves Industry Revenue Share (%), by Type 2024 & 2032
- Figure 26: North America Medical Gloves Industry Volume Share (%), by Type 2024 & 2032
- Figure 27: North America Medical Gloves Industry Revenue (Million), by Material 2024 & 2032
- Figure 28: North America Medical Gloves Industry Volume (K Units), by Material 2024 & 2032
- Figure 29: North America Medical Gloves Industry Revenue Share (%), by Material 2024 & 2032
- Figure 30: North America Medical Gloves Industry Volume Share (%), by Material 2024 & 2032
- Figure 31: North America Medical Gloves Industry Revenue (Million), by Application 2024 & 2032
- Figure 32: North America Medical Gloves Industry Volume (K Units), by Application 2024 & 2032
- Figure 33: North America Medical Gloves Industry Revenue Share (%), by Application 2024 & 2032
- Figure 34: North America Medical Gloves Industry Volume Share (%), by Application 2024 & 2032
- Figure 35: North America Medical Gloves Industry Revenue (Million), by Country 2024 & 2032
- Figure 36: North America Medical Gloves Industry Volume (K Units), by Country 2024 & 2032
- Figure 37: North America Medical Gloves Industry Revenue Share (%), by Country 2024 & 2032
- Figure 38: North America Medical Gloves Industry Volume Share (%), by Country 2024 & 2032
- Figure 39: Europe Medical Gloves Industry Revenue (Million), by Type 2024 & 2032
- Figure 40: Europe Medical Gloves Industry Volume (K Units), by Type 2024 & 2032
- Figure 41: Europe Medical Gloves Industry Revenue Share (%), by Type 2024 & 2032
- Figure 42: Europe Medical Gloves Industry Volume Share (%), by Type 2024 & 2032
- Figure 43: Europe Medical Gloves Industry Revenue (Million), by Material 2024 & 2032
- Figure 44: Europe Medical Gloves Industry Volume (K Units), by Material 2024 & 2032
- Figure 45: Europe Medical Gloves Industry Revenue Share (%), by Material 2024 & 2032
- Figure 46: Europe Medical Gloves Industry Volume Share (%), by Material 2024 & 2032
- Figure 47: Europe Medical Gloves Industry Revenue (Million), by Application 2024 & 2032
- Figure 48: Europe Medical Gloves Industry Volume (K Units), by Application 2024 & 2032
- Figure 49: Europe Medical Gloves Industry Revenue Share (%), by Application 2024 & 2032
- Figure 50: Europe Medical Gloves Industry Volume Share (%), by Application 2024 & 2032
- Figure 51: Europe Medical Gloves Industry Revenue (Million), by Country 2024 & 2032
- Figure 52: Europe Medical Gloves Industry Volume (K Units), by Country 2024 & 2032
- Figure 53: Europe Medical Gloves Industry Revenue Share (%), by Country 2024 & 2032
- Figure 54: Europe Medical Gloves Industry Volume Share (%), by Country 2024 & 2032
- Figure 55: Asia Pacific Medical Gloves Industry Revenue (Million), by Type 2024 & 2032
- Figure 56: Asia Pacific Medical Gloves Industry Volume (K Units), by Type 2024 & 2032
- Figure 57: Asia Pacific Medical Gloves Industry Revenue Share (%), by Type 2024 & 2032
- Figure 58: Asia Pacific Medical Gloves Industry Volume Share (%), by Type 2024 & 2032
- Figure 59: Asia Pacific Medical Gloves Industry Revenue (Million), by Material 2024 & 2032
- Figure 60: Asia Pacific Medical Gloves Industry Volume (K Units), by Material 2024 & 2032
- Figure 61: Asia Pacific Medical Gloves Industry Revenue Share (%), by Material 2024 & 2032
- Figure 62: Asia Pacific Medical Gloves Industry Volume Share (%), by Material 2024 & 2032
- Figure 63: Asia Pacific Medical Gloves Industry Revenue (Million), by Application 2024 & 2032
- Figure 64: Asia Pacific Medical Gloves Industry Volume (K Units), by Application 2024 & 2032
- Figure 65: Asia Pacific Medical Gloves Industry Revenue Share (%), by Application 2024 & 2032
- Figure 66: Asia Pacific Medical Gloves Industry Volume Share (%), by Application 2024 & 2032
- Figure 67: Asia Pacific Medical Gloves Industry Revenue (Million), by Country 2024 & 2032
- Figure 68: Asia Pacific Medical Gloves Industry Volume (K Units), by Country 2024 & 2032
- Figure 69: Asia Pacific Medical Gloves Industry Revenue Share (%), by Country 2024 & 2032
- Figure 70: Asia Pacific Medical Gloves Industry Volume Share (%), by Country 2024 & 2032
- Figure 71: Middle East Medical Gloves Industry Revenue (Million), by Type 2024 & 2032
- Figure 72: Middle East Medical Gloves Industry Volume (K Units), by Type 2024 & 2032
- Figure 73: Middle East Medical Gloves Industry Revenue Share (%), by Type 2024 & 2032
- Figure 74: Middle East Medical Gloves Industry Volume Share (%), by Type 2024 & 2032
- Figure 75: Middle East Medical Gloves Industry Revenue (Million), by Material 2024 & 2032
- Figure 76: Middle East Medical Gloves Industry Volume (K Units), by Material 2024 & 2032
- Figure 77: Middle East Medical Gloves Industry Revenue Share (%), by Material 2024 & 2032
- Figure 78: Middle East Medical Gloves Industry Volume Share (%), by Material 2024 & 2032
- Figure 79: Middle East Medical Gloves Industry Revenue (Million), by Application 2024 & 2032
- Figure 80: Middle East Medical Gloves Industry Volume (K Units), by Application 2024 & 2032
- Figure 81: Middle East Medical Gloves Industry Revenue Share (%), by Application 2024 & 2032
- Figure 82: Middle East Medical Gloves Industry Volume Share (%), by Application 2024 & 2032
- Figure 83: Middle East Medical Gloves Industry Revenue (Million), by Country 2024 & 2032
- Figure 84: Middle East Medical Gloves Industry Volume (K Units), by Country 2024 & 2032
- Figure 85: Middle East Medical Gloves Industry Revenue Share (%), by Country 2024 & 2032
- Figure 86: Middle East Medical Gloves Industry Volume Share (%), by Country 2024 & 2032
- Figure 87: GCC Medical Gloves Industry Revenue (Million), by Type 2024 & 2032
- Figure 88: GCC Medical Gloves Industry Volume (K Units), by Type 2024 & 2032
- Figure 89: GCC Medical Gloves Industry Revenue Share (%), by Type 2024 & 2032
- Figure 90: GCC Medical Gloves Industry Volume Share (%), by Type 2024 & 2032
- Figure 91: GCC Medical Gloves Industry Revenue (Million), by Material 2024 & 2032
- Figure 92: GCC Medical Gloves Industry Volume (K Units), by Material 2024 & 2032
- Figure 93: GCC Medical Gloves Industry Revenue Share (%), by Material 2024 & 2032
- Figure 94: GCC Medical Gloves Industry Volume Share (%), by Material 2024 & 2032
- Figure 95: GCC Medical Gloves Industry Revenue (Million), by Application 2024 & 2032
- Figure 96: GCC Medical Gloves Industry Volume (K Units), by Application 2024 & 2032
- Figure 97: GCC Medical Gloves Industry Revenue Share (%), by Application 2024 & 2032
- Figure 98: GCC Medical Gloves Industry Volume Share (%), by Application 2024 & 2032
- Figure 99: GCC Medical Gloves Industry Revenue (Million), by Country 2024 & 2032
- Figure 100: GCC Medical Gloves Industry Volume (K Units), by Country 2024 & 2032
- Figure 101: GCC Medical Gloves Industry Revenue Share (%), by Country 2024 & 2032
- Figure 102: GCC Medical Gloves Industry Volume Share (%), by Country 2024 & 2032
- Figure 103: South America Medical Gloves Industry Revenue (Million), by Type 2024 & 2032
- Figure 104: South America Medical Gloves Industry Volume (K Units), by Type 2024 & 2032
- Figure 105: South America Medical Gloves Industry Revenue Share (%), by Type 2024 & 2032
- Figure 106: South America Medical Gloves Industry Volume Share (%), by Type 2024 & 2032
- Figure 107: South America Medical Gloves Industry Revenue (Million), by Material 2024 & 2032
- Figure 108: South America Medical Gloves Industry Volume (K Units), by Material 2024 & 2032
- Figure 109: South America Medical Gloves Industry Revenue Share (%), by Material 2024 & 2032
- Figure 110: South America Medical Gloves Industry Volume Share (%), by Material 2024 & 2032
- Figure 111: South America Medical Gloves Industry Revenue (Million), by Application 2024 & 2032
- Figure 112: South America Medical Gloves Industry Volume (K Units), by Application 2024 & 2032
- Figure 113: South America Medical Gloves Industry Revenue Share (%), by Application 2024 & 2032
- Figure 114: South America Medical Gloves Industry Volume Share (%), by Application 2024 & 2032
- Figure 115: South America Medical Gloves Industry Revenue (Million), by Country 2024 & 2032
- Figure 116: South America Medical Gloves Industry Volume (K Units), by Country 2024 & 2032
- Figure 117: South America Medical Gloves Industry Revenue Share (%), by Country 2024 & 2032
- Figure 118: South America Medical Gloves Industry Volume Share (%), by Country 2024 & 2032
List of Tables
- Table 1: Global Medical Gloves Industry Revenue Million Forecast, by Region 2019 & 2032
- Table 2: Global Medical Gloves Industry Volume K Units Forecast, by Region 2019 & 2032
- Table 3: Global Medical Gloves Industry Revenue Million Forecast, by Type 2019 & 2032
- Table 4: Global Medical Gloves Industry Volume K Units Forecast, by Type 2019 & 2032
- Table 5: Global Medical Gloves Industry Revenue Million Forecast, by Material 2019 & 2032
- Table 6: Global Medical Gloves Industry Volume K Units Forecast, by Material 2019 & 2032
- Table 7: Global Medical Gloves Industry Revenue Million Forecast, by Application 2019 & 2032
- Table 8: Global Medical Gloves Industry Volume K Units Forecast, by Application 2019 & 2032
- Table 9: Global Medical Gloves Industry Revenue Million Forecast, by Region 2019 & 2032
- Table 10: Global Medical Gloves Industry Volume K Units Forecast, by Region 2019 & 2032
- Table 11: Global Medical Gloves Industry Revenue Million Forecast, by Country 2019 & 2032
- Table 12: Global Medical Gloves Industry Volume K Units Forecast, by Country 2019 & 2032
- Table 13: United States Medical Gloves Industry Revenue (Million) Forecast, by Application 2019 & 2032
- Table 14: United States Medical Gloves Industry Volume (K Units) Forecast, by Application 2019 & 2032
- Table 15: Canada Medical Gloves Industry Revenue (Million) Forecast, by Application 2019 & 2032
- Table 16: Canada Medical Gloves Industry Volume (K Units) Forecast, by Application 2019 & 2032
- Table 17: Mexico Medical Gloves Industry Revenue (Million) Forecast, by Application 2019 & 2032
- Table 18: Mexico Medical Gloves Industry Volume (K Units) Forecast, by Application 2019 & 2032
- Table 19: Global Medical Gloves Industry Revenue Million Forecast, by Country 2019 & 2032
- Table 20: Global Medical Gloves Industry Volume K Units Forecast, by Country 2019 & 2032
- Table 21: Brazil Medical Gloves Industry Revenue (Million) Forecast, by Application 2019 & 2032
- Table 22: Brazil Medical Gloves Industry Volume (K Units) Forecast, by Application 2019 & 2032
- Table 23: Mexico Medical Gloves Industry Revenue (Million) Forecast, by Application 2019 & 2032
- Table 24: Mexico Medical Gloves Industry Volume (K Units) Forecast, by Application 2019 & 2032
- Table 25: Rest of South America Medical Gloves Industry Revenue (Million) Forecast, by Application 2019 & 2032
- Table 26: Rest of South America Medical Gloves Industry Volume (K Units) Forecast, by Application 2019 & 2032
- Table 27: Global Medical Gloves Industry Revenue Million Forecast, by Country 2019 & 2032
- Table 28: Global Medical Gloves Industry Volume K Units Forecast, by Country 2019 & 2032
- Table 29: United Kingdom Medical Gloves Industry Revenue (Million) Forecast, by Application 2019 & 2032
- Table 30: United Kingdom Medical Gloves Industry Volume (K Units) Forecast, by Application 2019 & 2032
- Table 31: Germany Medical Gloves Industry Revenue (Million) Forecast, by Application 2019 & 2032
- Table 32: Germany Medical Gloves Industry Volume (K Units) Forecast, by Application 2019 & 2032
- Table 33: France Medical Gloves Industry Revenue (Million) Forecast, by Application 2019 & 2032
- Table 34: France Medical Gloves Industry Volume (K Units) Forecast, by Application 2019 & 2032
- Table 35: Italy Medical Gloves Industry Revenue (Million) Forecast, by Application 2019 & 2032
- Table 36: Italy Medical Gloves Industry Volume (K Units) Forecast, by Application 2019 & 2032
- Table 37: Spain Medical Gloves Industry Revenue (Million) Forecast, by Application 2019 & 2032
- Table 38: Spain Medical Gloves Industry Volume (K Units) Forecast, by Application 2019 & 2032
- Table 39: Russia Medical Gloves Industry Revenue (Million) Forecast, by Application 2019 & 2032
- Table 40: Russia Medical Gloves Industry Volume (K Units) Forecast, by Application 2019 & 2032
- Table 41: Rest of Europe Medical Gloves Industry Revenue (Million) Forecast, by Application 2019 & 2032
- Table 42: Rest of Europe Medical Gloves Industry Volume (K Units) Forecast, by Application 2019 & 2032
- Table 43: Global Medical Gloves Industry Revenue Million Forecast, by Country 2019 & 2032
- Table 44: Global Medical Gloves Industry Volume K Units Forecast, by Country 2019 & 2032
- Table 45: China Medical Gloves Industry Revenue (Million) Forecast, by Application 2019 & 2032
- Table 46: China Medical Gloves Industry Volume (K Units) Forecast, by Application 2019 & 2032
- Table 47: Japan Medical Gloves Industry Revenue (Million) Forecast, by Application 2019 & 2032
- Table 48: Japan Medical Gloves Industry Volume (K Units) Forecast, by Application 2019 & 2032
- Table 49: India Medical Gloves Industry Revenue (Million) Forecast, by Application 2019 & 2032
- Table 50: India Medical Gloves Industry Volume (K Units) Forecast, by Application 2019 & 2032
- Table 51: South Korea Medical Gloves Industry Revenue (Million) Forecast, by Application 2019 & 2032
- Table 52: South Korea Medical Gloves Industry Volume (K Units) Forecast, by Application 2019 & 2032
- Table 53: Taiwan Medical Gloves Industry Revenue (Million) Forecast, by Application 2019 & 2032
- Table 54: Taiwan Medical Gloves Industry Volume (K Units) Forecast, by Application 2019 & 2032
- Table 55: Australia Medical Gloves Industry Revenue (Million) Forecast, by Application 2019 & 2032
- Table 56: Australia Medical Gloves Industry Volume (K Units) Forecast, by Application 2019 & 2032
- Table 57: Rest of Asia-Pacific Medical Gloves Industry Revenue (Million) Forecast, by Application 2019 & 2032
- Table 58: Rest of Asia-Pacific Medical Gloves Industry Volume (K Units) Forecast, by Application 2019 & 2032
- Table 59: Global Medical Gloves Industry Revenue Million Forecast, by Country 2019 & 2032
- Table 60: Global Medical Gloves Industry Volume K Units Forecast, by Country 2019 & 2032
- Table 61: Middle East Medical Gloves Industry Revenue (Million) Forecast, by Application 2019 & 2032
- Table 62: Middle East Medical Gloves Industry Volume (K Units) Forecast, by Application 2019 & 2032
- Table 63: Africa Medical Gloves Industry Revenue (Million) Forecast, by Application 2019 & 2032
- Table 64: Africa Medical Gloves Industry Volume (K Units) Forecast, by Application 2019 & 2032
- Table 65: Global Medical Gloves Industry Revenue Million Forecast, by Type 2019 & 2032
- Table 66: Global Medical Gloves Industry Volume K Units Forecast, by Type 2019 & 2032
- Table 67: Global Medical Gloves Industry Revenue Million Forecast, by Material 2019 & 2032
- Table 68: Global Medical Gloves Industry Volume K Units Forecast, by Material 2019 & 2032
- Table 69: Global Medical Gloves Industry Revenue Million Forecast, by Application 2019 & 2032
- Table 70: Global Medical Gloves Industry Volume K Units Forecast, by Application 2019 & 2032
- Table 71: Global Medical Gloves Industry Revenue Million Forecast, by Country 2019 & 2032
- Table 72: Global Medical Gloves Industry Volume K Units Forecast, by Country 2019 & 2032
- Table 73: United States Medical Gloves Industry Revenue (Million) Forecast, by Application 2019 & 2032
- Table 74: United States Medical Gloves Industry Volume (K Units) Forecast, by Application 2019 & 2032
- Table 75: Canada Medical Gloves Industry Revenue (Million) Forecast, by Application 2019 & 2032
- Table 76: Canada Medical Gloves Industry Volume (K Units) Forecast, by Application 2019 & 2032
- Table 77: Mexico Medical Gloves Industry Revenue (Million) Forecast, by Application 2019 & 2032
- Table 78: Mexico Medical Gloves Industry Volume (K Units) Forecast, by Application 2019 & 2032
- Table 79: Global Medical Gloves Industry Revenue Million Forecast, by Type 2019 & 2032
- Table 80: Global Medical Gloves Industry Volume K Units Forecast, by Type 2019 & 2032
- Table 81: Global Medical Gloves Industry Revenue Million Forecast, by Material 2019 & 2032
- Table 82: Global Medical Gloves Industry Volume K Units Forecast, by Material 2019 & 2032
- Table 83: Global Medical Gloves Industry Revenue Million Forecast, by Application 2019 & 2032
- Table 84: Global Medical Gloves Industry Volume K Units Forecast, by Application 2019 & 2032
- Table 85: Global Medical Gloves Industry Revenue Million Forecast, by Country 2019 & 2032
- Table 86: Global Medical Gloves Industry Volume K Units Forecast, by Country 2019 & 2032
- Table 87: Germany Medical Gloves Industry Revenue (Million) Forecast, by Application 2019 & 2032
- Table 88: Germany Medical Gloves Industry Volume (K Units) Forecast, by Application 2019 & 2032
- Table 89: United Kingdom Medical Gloves Industry Revenue (Million) Forecast, by Application 2019 & 2032
- Table 90: United Kingdom Medical Gloves Industry Volume (K Units) Forecast, by Application 2019 & 2032
- Table 91: France Medical Gloves Industry Revenue (Million) Forecast, by Application 2019 & 2032
- Table 92: France Medical Gloves Industry Volume (K Units) Forecast, by Application 2019 & 2032
- Table 93: Italy Medical Gloves Industry Revenue (Million) Forecast, by Application 2019 & 2032
- Table 94: Italy Medical Gloves Industry Volume (K Units) Forecast, by Application 2019 & 2032
- Table 95: Spain Medical Gloves Industry Revenue (Million) Forecast, by Application 2019 & 2032
- Table 96: Spain Medical Gloves Industry Volume (K Units) Forecast, by Application 2019 & 2032
- Table 97: Rest of Europe Medical Gloves Industry Revenue (Million) Forecast, by Application 2019 & 2032
- Table 98: Rest of Europe Medical Gloves Industry Volume (K Units) Forecast, by Application 2019 & 2032
- Table 99: Global Medical Gloves Industry Revenue Million Forecast, by Type 2019 & 2032
- Table 100: Global Medical Gloves Industry Volume K Units Forecast, by Type 2019 & 2032
- Table 101: Global Medical Gloves Industry Revenue Million Forecast, by Material 2019 & 2032
- Table 102: Global Medical Gloves Industry Volume K Units Forecast, by Material 2019 & 2032
- Table 103: Global Medical Gloves Industry Revenue Million Forecast, by Application 2019 & 2032
- Table 104: Global Medical Gloves Industry Volume K Units Forecast, by Application 2019 & 2032
- Table 105: Global Medical Gloves Industry Revenue Million Forecast, by Country 2019 & 2032
- Table 106: Global Medical Gloves Industry Volume K Units Forecast, by Country 2019 & 2032
- Table 107: China Medical Gloves Industry Revenue (Million) Forecast, by Application 2019 & 2032
- Table 108: China Medical Gloves Industry Volume (K Units) Forecast, by Application 2019 & 2032
- Table 109: Japan Medical Gloves Industry Revenue (Million) Forecast, by Application 2019 & 2032
- Table 110: Japan Medical Gloves Industry Volume (K Units) Forecast, by Application 2019 & 2032
- Table 111: India Medical Gloves Industry Revenue (Million) Forecast, by Application 2019 & 2032
- Table 112: India Medical Gloves Industry Volume (K Units) Forecast, by Application 2019 & 2032
- Table 113: Australia Medical Gloves Industry Revenue (Million) Forecast, by Application 2019 & 2032
- Table 114: Australia Medical Gloves Industry Volume (K Units) Forecast, by Application 2019 & 2032
- Table 115: South Korea Medical Gloves Industry Revenue (Million) Forecast, by Application 2019 & 2032
- Table 116: South Korea Medical Gloves Industry Volume (K Units) Forecast, by Application 2019 & 2032
- Table 117: Rest of Asia Pacific Medical Gloves Industry Revenue (Million) Forecast, by Application 2019 & 2032
- Table 118: Rest of Asia Pacific Medical Gloves Industry Volume (K Units) Forecast, by Application 2019 & 2032
- Table 119: Global Medical Gloves Industry Revenue Million Forecast, by Type 2019 & 2032
- Table 120: Global Medical Gloves Industry Volume K Units Forecast, by Type 2019 & 2032
- Table 121: Global Medical Gloves Industry Revenue Million Forecast, by Material 2019 & 2032
- Table 122: Global Medical Gloves Industry Volume K Units Forecast, by Material 2019 & 2032
- Table 123: Global Medical Gloves Industry Revenue Million Forecast, by Application 2019 & 2032
- Table 124: Global Medical Gloves Industry Volume K Units Forecast, by Application 2019 & 2032
- Table 125: Global Medical Gloves Industry Revenue Million Forecast, by Country 2019 & 2032
- Table 126: Global Medical Gloves Industry Volume K Units Forecast, by Country 2019 & 2032
- Table 127: Global Medical Gloves Industry Revenue Million Forecast, by Type 2019 & 2032
- Table 128: Global Medical Gloves Industry Volume K Units Forecast, by Type 2019 & 2032
- Table 129: Global Medical Gloves Industry Revenue Million Forecast, by Material 2019 & 2032
- Table 130: Global Medical Gloves Industry Volume K Units Forecast, by Material 2019 & 2032
- Table 131: Global Medical Gloves Industry Revenue Million Forecast, by Application 2019 & 2032
- Table 132: Global Medical Gloves Industry Volume K Units Forecast, by Application 2019 & 2032
- Table 133: Global Medical Gloves Industry Revenue Million Forecast, by Country 2019 & 2032
- Table 134: Global Medical Gloves Industry Volume K Units Forecast, by Country 2019 & 2032
- Table 135: South Africa Medical Gloves Industry Revenue (Million) Forecast, by Application 2019 & 2032
- Table 136: South Africa Medical Gloves Industry Volume (K Units) Forecast, by Application 2019 & 2032
- Table 137: Rest of Middle East Medical Gloves Industry Revenue (Million) Forecast, by Application 2019 & 2032
- Table 138: Rest of Middle East Medical Gloves Industry Volume (K Units) Forecast, by Application 2019 & 2032
- Table 139: Global Medical Gloves Industry Revenue Million Forecast, by Type 2019 & 2032
- Table 140: Global Medical Gloves Industry Volume K Units Forecast, by Type 2019 & 2032
- Table 141: Global Medical Gloves Industry Revenue Million Forecast, by Material 2019 & 2032
- Table 142: Global Medical Gloves Industry Volume K Units Forecast, by Material 2019 & 2032
- Table 143: Global Medical Gloves Industry Revenue Million Forecast, by Application 2019 & 2032
- Table 144: Global Medical Gloves Industry Volume K Units Forecast, by Application 2019 & 2032
- Table 145: Global Medical Gloves Industry Revenue Million Forecast, by Country 2019 & 2032
- Table 146: Global Medical Gloves Industry Volume K Units Forecast, by Country 2019 & 2032
- Table 147: Brazil Medical Gloves Industry Revenue (Million) Forecast, by Application 2019 & 2032
- Table 148: Brazil Medical Gloves Industry Volume (K Units) Forecast, by Application 2019 & 2032
- Table 149: Argentina Medical Gloves Industry Revenue (Million) Forecast, by Application 2019 & 2032
- Table 150: Argentina Medical Gloves Industry Volume (K Units) Forecast, by Application 2019 & 2032
- Table 151: Rest of South America Medical Gloves Industry Revenue (Million) Forecast, by Application 2019 & 2032
- Table 152: Rest of South America Medical Gloves Industry Volume (K Units) Forecast, by Application 2019 & 2032
Frequently Asked Questions
1. What is the projected Compound Annual Growth Rate (CAGR) of the Medical Gloves Industry?
The projected CAGR is approximately 6.30%.
2. Which companies are prominent players in the Medical Gloves Industry?
Key companies in the market include Mckesson Corporation, Top Glove Corporation Bhd, American Nitrile, Dynarex Corporation, Cardinal Health Inc, 3M Company, Semperit AG Holding, Hartalega Holdings Berhad, B Braun Melsungen AG, Medline Industries Inc, Honeywell International Inc , Ansell Limited.
3. What are the main segments of the Medical Gloves Industry?
The market segments include Type, Material, Application.
4. Can you provide details about the market size?
The market size is estimated to be USD 7.2 Million as of 2022.
5. What are some drivers contributing to market growth?
Growing awareness about hygiene standards and infection control in healthcare settings has increased the demand for medical gloves. Healthcare professionals rely on gloves for protection against infectious diseases and contaminants during examinations. surgeries. and patient care.
6. What are the notable trends driving market growth?
Automation in glove production will improve manufacturing efficiency. reduce costs. and ensure consistent product quality. This trend is likely to grow as demand continues to increase globally.
7. Are there any restraints impacting market growth?
The cost of raw materials. particularly latex and nitrile. fluctuates based on market demand and supply. This can impact the production cost and pricing of medical gloves.
8. Can you provide examples of recent developments in the market?
January 2023: The Medicom group announced that it had planned to build a nitrile glove factory called ManiKHeir, via its subsidiary Kolmi-Hopen which specializes in the manufacture of single-use medical devices
9. What pricing options are available for accessing the report?
Pricing options include single-user, multi-user, and enterprise licenses priced at USD 4750, USD 5250, and USD 8750 respectively.
10. Is the market size provided in terms of value or volume?
The market size is provided in terms of value, measured in Million and volume, measured in K Units.
11. Are there any specific market keywords associated with the report?
Yes, the market keyword associated with the report is "Medical Gloves Industry," which aids in identifying and referencing the specific market segment covered.
12. How do I determine which pricing option suits my needs best?
The pricing options vary based on user requirements and access needs. Individual users may opt for single-user licenses, while businesses requiring broader access may choose multi-user or enterprise licenses for cost-effective access to the report.
13. Are there any additional resources or data provided in the Medical Gloves Industry report?
While the report offers comprehensive insights, it's advisable to review the specific contents or supplementary materials provided to ascertain if additional resources or data are available.
14. How can I stay updated on further developments or reports in the Medical Gloves Industry?
To stay informed about further developments, trends, and reports in the Medical Gloves Industry, consider subscribing to industry newsletters, following relevant companies and organizations, or regularly checking reputable industry news sources and publications.
Methodology
Step 1 - Identification of Relevant Samples Size from Population Database


Step 2 - Approaches for Defining Global Market Size (Value, Volume* & Price*)

Note*: In applicable scenarios
Step 3 - Data Sources
Primary Research
- Web Analytics
- Survey Reports
- Research Institute
- Latest Research Reports
- Opinion Leaders
Secondary Research
- Annual Reports
- White Paper
- Latest Press Release
- Industry Association
- Paid Database
- Investor Presentations

Step 4 - Data Triangulation
Involves using different sources of information in order to increase the validity of a study
These sources are likely to be stakeholders in a program - participants, other researchers, program staff, other community members, and so on.
Then we put all data in single framework & apply various statistical tools to find out the dynamic on the market.
During the analysis stage, feedback from the stakeholder groups would be compared to determine areas of agreement as well as areas of divergence


