
Key Insights
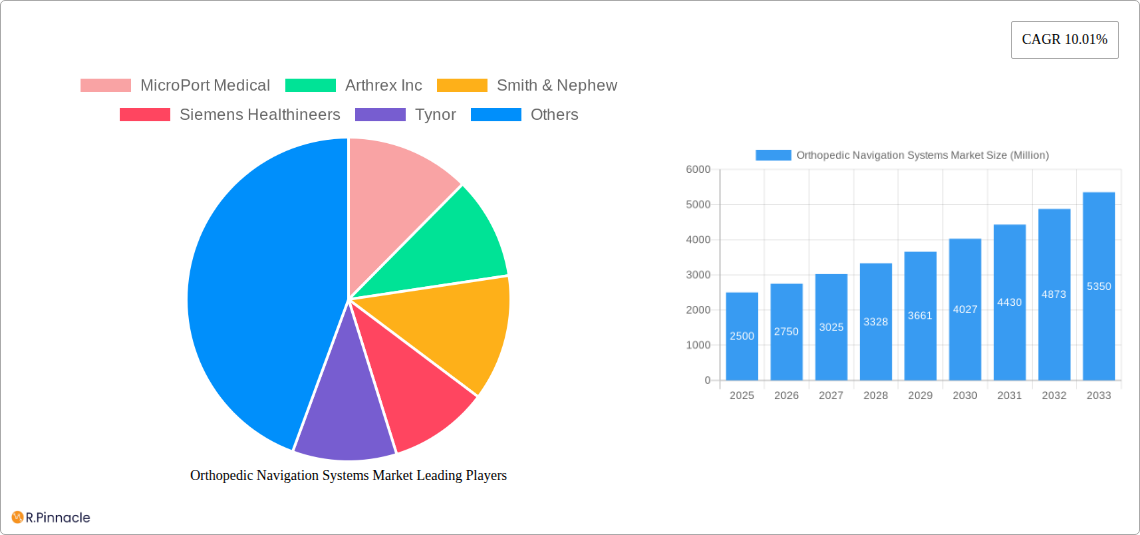
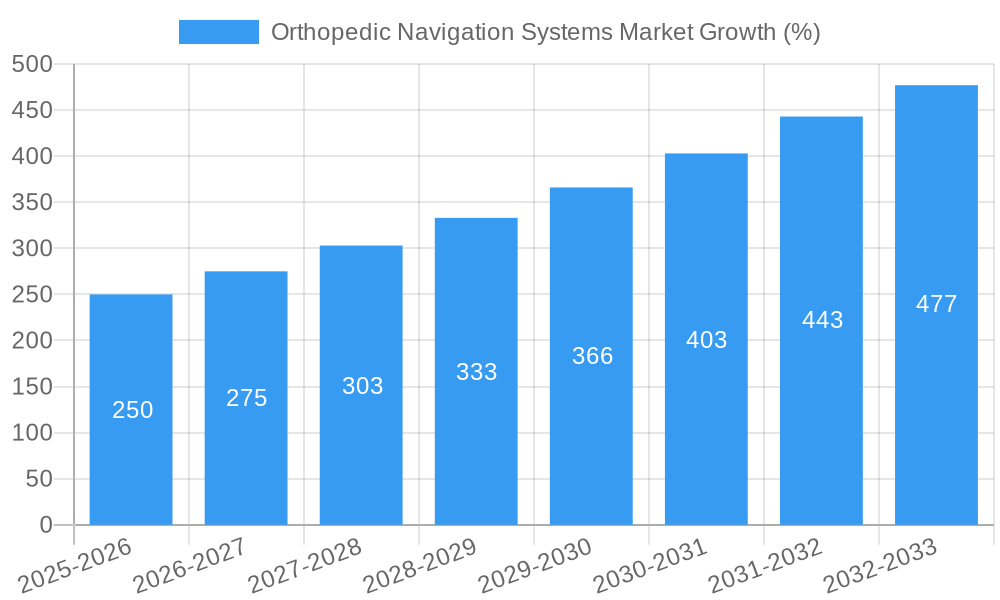
The orthopedic navigation systems market is experiencing robust growth, driven by an aging global population necessitating more joint replacement surgeries and a rising prevalence of spinal disorders. The market's Compound Annual Growth Rate (CAGR) of 10.01% from 2019-2033 indicates significant expansion, fueled by technological advancements in image-guided surgery and increasing demand for minimally invasive procedures. Key drivers include improved accuracy and precision in orthopedic surgeries, reduced surgical time and complications, faster patient recovery times, and enhanced patient outcomes. The market is segmented by application (knee, spine, hip, and other surgeries), end-user (hospitals, ambulatory surgical centers), and technology (electromagnetic localizers, optical tracking, fluoroscopy, MRI, and others). North America currently holds a dominant market share due to high healthcare expenditure and technological adoption, but the Asia-Pacific region is projected to witness significant growth in the coming years, driven by increasing disposable incomes and rising healthcare infrastructure development in countries like India and China. Growth will be tempered by factors like high initial investment costs associated with the technology and the availability of skilled surgeons trained in navigation system usage. Nevertheless, continuous innovation in navigation systems, including the integration of AI and machine learning, is expected to further propel market expansion.
The competitive landscape is marked by the presence of established players such as Medtronic PLC, Stryker, Zimmer Biomet, and Smith & Nephew, alongside smaller, innovative companies. These companies are focusing on strategic collaborations, product launches, and acquisitions to strengthen their market positions. The increasing integration of advanced imaging technologies, such as augmented reality (AR) and virtual reality (VR), within navigation systems, promises to revolutionize surgical planning and execution. This trend, along with the growing adoption of robotic-assisted surgery, will further contribute to the market's expansion in the coming decade. The forecast period of 2025-2033 anticipates sustained growth, with a projected market value significantly exceeding the 2025 baseline. The continued focus on improving surgical precision, minimizing invasiveness, and enhancing patient care will be instrumental in driving the long-term growth of this crucial sector in the medical device industry.
Orthopedic Navigation Systems Market Report: 2019-2033
This comprehensive report provides a detailed analysis of the Orthopedic Navigation Systems Market, offering actionable insights for industry professionals, investors, and stakeholders. The study period spans from 2019 to 2033, with 2025 serving as the base and estimated year. The report forecasts market trends from 2025 to 2033, leveraging data from the historical period of 2019-2024. The market is projected to reach xx Million by 2033, exhibiting a CAGR of xx% during the forecast period.
Orthopedic Navigation Systems Market Structure & Innovation Trends
The Orthopedic Navigation Systems Market is characterized by a moderately concentrated structure, with key players like Medtronic PLC, Stryker, Zimmer Biomet, and Smith & Nephew holding significant market share. The market is estimated to be valued at xx Million in 2025. However, the presence of several smaller, specialized companies fosters competition and innovation. Market share dynamics are influenced by factors including technological advancements, regulatory approvals, and strategic partnerships.
- Innovation Drivers: Miniaturization of devices, AI integration for improved precision, and development of image-guided systems are key innovation drivers.
- Regulatory Framework: Stringent regulatory approvals (e.g., FDA clearance) impact market entry and growth.
- Product Substitutes: Traditional surgical techniques pose a competitive challenge, although navigation systems are gaining preference for their enhanced accuracy and minimally invasive capabilities.
- End-User Demographics: The aging global population and increasing prevalence of orthopedic conditions are significant market growth drivers.
- M&A Activities: Several M&A activities in recent years, with deal values ranging from xx Million to xx Million, indicate industry consolidation and a push for technological advancement. These activities have resulted in a xx% increase in market concentration.
Orthopedic Navigation Systems Market Dynamics & Trends
The Orthopedic Navigation Systems Market is experiencing robust growth fueled by multiple factors. Technological advancements, such as the integration of AI and machine learning, are improving the accuracy and efficiency of surgical procedures. This, coupled with an increasing demand for minimally invasive surgeries, is driving market penetration. The market is witnessing increased adoption in ambulatory surgical centers, further boosting growth. Consumer preferences are shifting towards advanced technologies that offer improved patient outcomes and faster recovery times. However, high initial investment costs and the need for specialized training can impede market growth in certain regions. The market is characterized by intense competitive dynamics, with key players focusing on product innovation and strategic partnerships to gain market share.
Dominant Regions & Segments in Orthopedic Navigation Systems Market
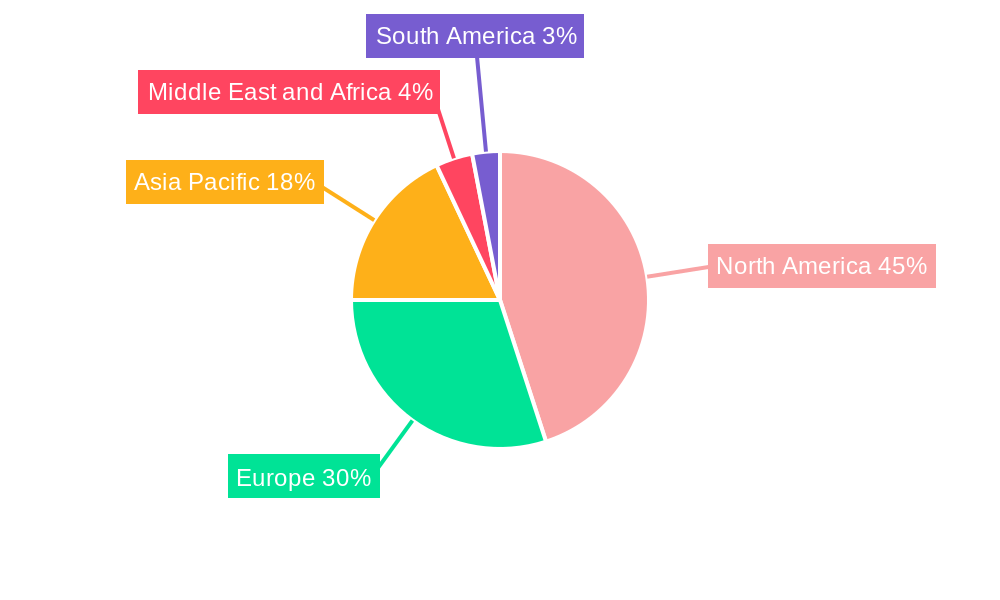
North America currently dominates the Orthopedic Navigation Systems Market, driven by factors such as high healthcare expenditure, technological advancements, and a substantial number of surgical procedures. Within this region, the United States holds the largest market share. Europe follows as a significant regional market.
By Application: Knee surgery holds the largest segment due to its high prevalence and demand for improved surgical outcomes. Spine surgery is another significant application area.
By End User: Hospitals are the primary end-users, accounting for a large majority of the market share. However, Ambulatory Surgical Centers are showing substantial growth.
By Technology: Electromagnetic localizers are widely used, although optical tracking and image-guided technologies are gaining traction. MRI-based systems cater to complex cases and are a niche segment.
Key Drivers in North America:
- Robust healthcare infrastructure
- High adoption rate of advanced technologies
- Favorable regulatory environment
- Significant investments in research & development
Orthopedic Navigation Systems Market Product Innovations
Recent innovations focus on enhancing accuracy, reducing invasiveness, and integrating advanced imaging technologies. The integration of AI and machine learning is significantly improving the accuracy of implant placement and reducing surgical time. Companies are also focusing on developing user-friendly interfaces and integrating the systems with existing hospital infrastructure for seamless integration. The market is witnessing the emergence of systems with improved image quality and advanced visualization capabilities, better addressing the needs of surgeons performing complex procedures.
Report Scope & Segmentation Analysis
This report segments the Orthopedic Navigation Systems Market based on application (knee surgery, spine surgery, hip surgery, other applications), end-user (hospitals, ambulatory surgical centers, other end-users), and technology (electromagnetic localizers, optical tracking, fluoroscopy, MRI, other technologies). Each segment's growth trajectory, market size, and competitive landscape are analyzed. The report also provides detailed regional breakdowns with growth projections and market sizes.
Key Drivers of Orthopedic Navigation Systems Market Growth
Technological advancements, particularly in image-guided surgery and AI-powered systems, are major drivers. The aging global population leading to a higher incidence of orthopedic conditions is another key factor. Growing adoption in ambulatory surgical centers reduces procedure costs and increases accessibility. Stringent regulatory approvals ensure improved product safety and efficacy, enhancing market confidence. Rising healthcare expenditure in developed countries and increased investments in medical technology further accelerate market growth.
Challenges in the Orthopedic Navigation Systems Market Sector
High initial investment costs can hinder adoption, especially in resource-constrained settings. The need for specialized training and expertise to operate these systems also poses a barrier. Competition among established players and the entry of new market participants creates dynamic and potentially disruptive competitive pressures. Furthermore, the stringent regulatory environment and complexities in securing approvals can delay market entry and adoption of new technologies. Supply chain issues can also impact the availability and cost of these systems.
Emerging Opportunities in Orthopedic Navigation Systems Market
Emerging markets in Asia and Latin America present substantial growth opportunities. The development of more compact, portable, and cost-effective navigation systems enhances accessibility. Integration with augmented reality (AR) and virtual reality (VR) technologies could further improve surgical planning and precision. Focus on minimally invasive procedures and personalized medicine applications will drive future growth. Development of systems for use in robotic-assisted surgery is an additional significant opportunity.
Leading Players in the Orthopedic Navigation Systems Market Market
- MicroPort Medical
- Arthrex Inc
- Smith & Nephew
- Siemens Healthineers
- Tynor
- Medtronic PLC
- Stryker
- NuVasive
- Brainlab
- Zimmer Biomet
- B Braun SE
Key Developments in Orthopedic Navigation Systems Market Industry
- December 2022: SeaSpine Holdings Corporation announced the placement of its 100th 7D FLASH navigation system globally. This signifies growing acceptance and efficacy of their technology within the market.
- February 2022: Smith+Nephew launched the CORI surgical navigation system in Japan, expanding its reach and enhancing its market position in knee arthroplasty.
Future Outlook for Orthopedic Navigation Systems Market Market
The Orthopedic Navigation Systems Market is poised for continued robust growth, driven by advancements in technology, increasing demand for minimally invasive surgeries, and the growing prevalence of orthopedic conditions globally. Strategic partnerships, technological innovations, and expansion into new markets will further propel market growth. The focus on improving patient outcomes, reducing surgical time, and enhancing the overall surgical experience will continue to shape the market's trajectory in the coming years.
Orthopedic Navigation Systems Market Segmentation
-
1. Technology
- 1.1. Electromagnetic Localizers
- 1.2. Optical Tracking
- 1.3. Fluoroscopy
- 1.4. MRI
- 1.5. Other Technologies
-
2. Application
- 2.1. Knee surgery
- 2.2. Spine surgery
- 2.3. Hip surgery
- 2.4. Other Applications
-
3. End User
- 3.1. Hospitals
- 3.2. Ambulatory Surgical Centers
- 3.3. Other End Users
Orthopedic Navigation Systems Market Segmentation By Geography
-
1. North America
- 1.1. United States
- 1.2. Canada
- 1.3. Mexico
-
2. Europe
- 2.1. United Kingdom
- 2.2. France
- 2.3. Germany
- 2.4. Italy
- 2.5. Spain
- 2.6. Rest of Europe
-
3. Asia Pacific
- 3.1. India
- 3.2. China
- 3.3. Japan
- 3.4. Australia
- 3.5. South Korea
- 3.6. Rest of Asia Pacific
- 4. Middle East
-
5. GCC
- 5.1. South Africa
- 5.2. Rest of Middle East
-
6. South America
- 6.1. Brazil
- 6.2. Argentina
- 6.3. Rest of South America
Orthopedic Navigation Systems Market REPORT HIGHLIGHTS
| Aspects | Details |
|---|---|
| Study Period | 2019-2033 |
| Base Year | 2024 |
| Estimated Year | 2025 |
| Forecast Period | 2025-2033 |
| Historical Period | 2019-2024 |
| Growth Rate | CAGR of 10.01% from 2019-2033 |
| Segmentation |
|
Table of Contents
- 1. Introduction
- 1.1. Research Scope
- 1.2. Market Segmentation
- 1.3. Research Methodology
- 1.4. Definitions and Assumptions
- 2. Executive Summary
- 2.1. Introduction
- 3. Market Dynamics
- 3.1. Introduction
- 3.2. Market Drivers
- 3.2.1. Associated Advantages of Computer-Assisted Surgeries (CAS); Increasing Adoption of Minimally Invasive Surgical Procedures; Increasing Incidence of Orthopedic Conditions
- 3.3. Market Restrains
- 3.3.1. Increased Procedural Complications and Regulatory Processes for Approval; High Cost of Surgical Navigation Systems and Product
- 3.4. Market Trends
- 3.4.1. Knee Surgery Segmentation is Expected to Hold a Significant Market Share During the Forecast Period
- 4. Market Factor Analysis
- 4.1. Porters Five Forces
- 4.2. Supply/Value Chain
- 4.3. PESTEL analysis
- 4.4. Market Entropy
- 4.5. Patent/Trademark Analysis
- 5. Global Orthopedic Navigation Systems Market Analysis, Insights and Forecast, 2019-2031
- 5.1. Market Analysis, Insights and Forecast - by Technology
- 5.1.1. Electromagnetic Localizers
- 5.1.2. Optical Tracking
- 5.1.3. Fluoroscopy
- 5.1.4. MRI
- 5.1.5. Other Technologies
- 5.2. Market Analysis, Insights and Forecast - by Application
- 5.2.1. Knee surgery
- 5.2.2. Spine surgery
- 5.2.3. Hip surgery
- 5.2.4. Other Applications
- 5.3. Market Analysis, Insights and Forecast - by End User
- 5.3.1. Hospitals
- 5.3.2. Ambulatory Surgical Centers
- 5.3.3. Other End Users
- 5.4. Market Analysis, Insights and Forecast - by Region
- 5.4.1. North America
- 5.4.2. Europe
- 5.4.3. Asia Pacific
- 5.4.4. Middle East
- 5.4.5. GCC
- 5.4.6. South America
- 5.1. Market Analysis, Insights and Forecast - by Technology
- 6. North America Orthopedic Navigation Systems Market Analysis, Insights and Forecast, 2019-2031
- 6.1. Market Analysis, Insights and Forecast - by Technology
- 6.1.1. Electromagnetic Localizers
- 6.1.2. Optical Tracking
- 6.1.3. Fluoroscopy
- 6.1.4. MRI
- 6.1.5. Other Technologies
- 6.2. Market Analysis, Insights and Forecast - by Application
- 6.2.1. Knee surgery
- 6.2.2. Spine surgery
- 6.2.3. Hip surgery
- 6.2.4. Other Applications
- 6.3. Market Analysis, Insights and Forecast - by End User
- 6.3.1. Hospitals
- 6.3.2. Ambulatory Surgical Centers
- 6.3.3. Other End Users
- 6.1. Market Analysis, Insights and Forecast - by Technology
- 7. Europe Orthopedic Navigation Systems Market Analysis, Insights and Forecast, 2019-2031
- 7.1. Market Analysis, Insights and Forecast - by Technology
- 7.1.1. Electromagnetic Localizers
- 7.1.2. Optical Tracking
- 7.1.3. Fluoroscopy
- 7.1.4. MRI
- 7.1.5. Other Technologies
- 7.2. Market Analysis, Insights and Forecast - by Application
- 7.2.1. Knee surgery
- 7.2.2. Spine surgery
- 7.2.3. Hip surgery
- 7.2.4. Other Applications
- 7.3. Market Analysis, Insights and Forecast - by End User
- 7.3.1. Hospitals
- 7.3.2. Ambulatory Surgical Centers
- 7.3.3. Other End Users
- 7.1. Market Analysis, Insights and Forecast - by Technology
- 8. Asia Pacific Orthopedic Navigation Systems Market Analysis, Insights and Forecast, 2019-2031
- 8.1. Market Analysis, Insights and Forecast - by Technology
- 8.1.1. Electromagnetic Localizers
- 8.1.2. Optical Tracking
- 8.1.3. Fluoroscopy
- 8.1.4. MRI
- 8.1.5. Other Technologies
- 8.2. Market Analysis, Insights and Forecast - by Application
- 8.2.1. Knee surgery
- 8.2.2. Spine surgery
- 8.2.3. Hip surgery
- 8.2.4. Other Applications
- 8.3. Market Analysis, Insights and Forecast - by End User
- 8.3.1. Hospitals
- 8.3.2. Ambulatory Surgical Centers
- 8.3.3. Other End Users
- 8.1. Market Analysis, Insights and Forecast - by Technology
- 9. Middle East Orthopedic Navigation Systems Market Analysis, Insights and Forecast, 2019-2031
- 9.1. Market Analysis, Insights and Forecast - by Technology
- 9.1.1. Electromagnetic Localizers
- 9.1.2. Optical Tracking
- 9.1.3. Fluoroscopy
- 9.1.4. MRI
- 9.1.5. Other Technologies
- 9.2. Market Analysis, Insights and Forecast - by Application
- 9.2.1. Knee surgery
- 9.2.2. Spine surgery
- 9.2.3. Hip surgery
- 9.2.4. Other Applications
- 9.3. Market Analysis, Insights and Forecast - by End User
- 9.3.1. Hospitals
- 9.3.2. Ambulatory Surgical Centers
- 9.3.3. Other End Users
- 9.1. Market Analysis, Insights and Forecast - by Technology
- 10. GCC Orthopedic Navigation Systems Market Analysis, Insights and Forecast, 2019-2031
- 10.1. Market Analysis, Insights and Forecast - by Technology
- 10.1.1. Electromagnetic Localizers
- 10.1.2. Optical Tracking
- 10.1.3. Fluoroscopy
- 10.1.4. MRI
- 10.1.5. Other Technologies
- 10.2. Market Analysis, Insights and Forecast - by Application
- 10.2.1. Knee surgery
- 10.2.2. Spine surgery
- 10.2.3. Hip surgery
- 10.2.4. Other Applications
- 10.3. Market Analysis, Insights and Forecast - by End User
- 10.3.1. Hospitals
- 10.3.2. Ambulatory Surgical Centers
- 10.3.3. Other End Users
- 10.1. Market Analysis, Insights and Forecast - by Technology
- 11. South America Orthopedic Navigation Systems Market Analysis, Insights and Forecast, 2019-2031
- 11.1. Market Analysis, Insights and Forecast - by Technology
- 11.1.1. Electromagnetic Localizers
- 11.1.2. Optical Tracking
- 11.1.3. Fluoroscopy
- 11.1.4. MRI
- 11.1.5. Other Technologies
- 11.2. Market Analysis, Insights and Forecast - by Application
- 11.2.1. Knee surgery
- 11.2.2. Spine surgery
- 11.2.3. Hip surgery
- 11.2.4. Other Applications
- 11.3. Market Analysis, Insights and Forecast - by End User
- 11.3.1. Hospitals
- 11.3.2. Ambulatory Surgical Centers
- 11.3.3. Other End Users
- 11.1. Market Analysis, Insights and Forecast - by Technology
- 12. North America Orthopedic Navigation Systems Market Analysis, Insights and Forecast, 2019-2031
- 12.1. Market Analysis, Insights and Forecast - By Country/Sub-region
- 12.1.1 United States
- 12.1.2 Canada
- 12.1.3 Mexico
- 13. Europe Orthopedic Navigation Systems Market Analysis, Insights and Forecast, 2019-2031
- 13.1. Market Analysis, Insights and Forecast - By Country/Sub-region
- 13.1.1 United Kingdom
- 13.1.2 France
- 13.1.3 Germany
- 13.1.4 Italy
- 13.1.5 Spain
- 13.1.6 Rest of Europe
- 14. Asia Pacific Orthopedic Navigation Systems Market Analysis, Insights and Forecast, 2019-2031
- 14.1. Market Analysis, Insights and Forecast - By Country/Sub-region
- 14.1.1 India
- 14.1.2 China
- 14.1.3 Japan
- 14.1.4 Australia
- 14.1.5 South Korea
- 14.1.6 Rest of Asia Pacific
- 15. Middle East and Africa Orthopedic Navigation Systems Market Analysis, Insights and Forecast, 2019-2031
- 15.1. Market Analysis, Insights and Forecast - By Country/Sub-region
- 15.1.1 GCC
- 15.1.2 South Africa
- 15.1.3 Rest of Middle East and Africa
- 16. South America Orthopedic Navigation Systems Market Analysis, Insights and Forecast, 2019-2031
- 16.1. Market Analysis, Insights and Forecast - By Country/Sub-region
- 16.1.1 Brazil
- 16.1.2 Argentina
- 16.1.3 Rest of South America
- 17. Competitive Analysis
- 17.1. Global Market Share Analysis 2024
- 17.2. Company Profiles
- 17.2.1 MicroPort Medical
- 17.2.1.1. Overview
- 17.2.1.2. Products
- 17.2.1.3. SWOT Analysis
- 17.2.1.4. Recent Developments
- 17.2.1.5. Financials (Based on Availability)
- 17.2.2 Arthrex Inc
- 17.2.2.1. Overview
- 17.2.2.2. Products
- 17.2.2.3. SWOT Analysis
- 17.2.2.4. Recent Developments
- 17.2.2.5. Financials (Based on Availability)
- 17.2.3 Smith & Nephew
- 17.2.3.1. Overview
- 17.2.3.2. Products
- 17.2.3.3. SWOT Analysis
- 17.2.3.4. Recent Developments
- 17.2.3.5. Financials (Based on Availability)
- 17.2.4 Siemens Healthineers
- 17.2.4.1. Overview
- 17.2.4.2. Products
- 17.2.4.3. SWOT Analysis
- 17.2.4.4. Recent Developments
- 17.2.4.5. Financials (Based on Availability)
- 17.2.5 Tynor
- 17.2.5.1. Overview
- 17.2.5.2. Products
- 17.2.5.3. SWOT Analysis
- 17.2.5.4. Recent Developments
- 17.2.5.5. Financials (Based on Availability)
- 17.2.6 Medtronic PLC
- 17.2.6.1. Overview
- 17.2.6.2. Products
- 17.2.6.3. SWOT Analysis
- 17.2.6.4. Recent Developments
- 17.2.6.5. Financials (Based on Availability)
- 17.2.7 Stryker
- 17.2.7.1. Overview
- 17.2.7.2. Products
- 17.2.7.3. SWOT Analysis
- 17.2.7.4. Recent Developments
- 17.2.7.5. Financials (Based on Availability)
- 17.2.8 NuVasive
- 17.2.8.1. Overview
- 17.2.8.2. Products
- 17.2.8.3. SWOT Analysis
- 17.2.8.4. Recent Developments
- 17.2.8.5. Financials (Based on Availability)
- 17.2.9 Brainlab
- 17.2.9.1. Overview
- 17.2.9.2. Products
- 17.2.9.3. SWOT Analysis
- 17.2.9.4. Recent Developments
- 17.2.9.5. Financials (Based on Availability)
- 17.2.10 Zimmer Biomet
- 17.2.10.1. Overview
- 17.2.10.2. Products
- 17.2.10.3. SWOT Analysis
- 17.2.10.4. Recent Developments
- 17.2.10.5. Financials (Based on Availability)
- 17.2.11 B Braun SE
- 17.2.11.1. Overview
- 17.2.11.2. Products
- 17.2.11.3. SWOT Analysis
- 17.2.11.4. Recent Developments
- 17.2.11.5. Financials (Based on Availability)
- 17.2.1 MicroPort Medical
List of Figures
- Figure 1: Global Orthopedic Navigation Systems Market Revenue Breakdown (Million, %) by Region 2024 & 2032
- Figure 2: North America Orthopedic Navigation Systems Market Revenue (Million), by Country 2024 & 2032
- Figure 3: North America Orthopedic Navigation Systems Market Revenue Share (%), by Country 2024 & 2032
- Figure 4: Europe Orthopedic Navigation Systems Market Revenue (Million), by Country 2024 & 2032
- Figure 5: Europe Orthopedic Navigation Systems Market Revenue Share (%), by Country 2024 & 2032
- Figure 6: Asia Pacific Orthopedic Navigation Systems Market Revenue (Million), by Country 2024 & 2032
- Figure 7: Asia Pacific Orthopedic Navigation Systems Market Revenue Share (%), by Country 2024 & 2032
- Figure 8: Middle East and Africa Orthopedic Navigation Systems Market Revenue (Million), by Country 2024 & 2032
- Figure 9: Middle East and Africa Orthopedic Navigation Systems Market Revenue Share (%), by Country 2024 & 2032
- Figure 10: South America Orthopedic Navigation Systems Market Revenue (Million), by Country 2024 & 2032
- Figure 11: South America Orthopedic Navigation Systems Market Revenue Share (%), by Country 2024 & 2032
- Figure 12: North America Orthopedic Navigation Systems Market Revenue (Million), by Technology 2024 & 2032
- Figure 13: North America Orthopedic Navigation Systems Market Revenue Share (%), by Technology 2024 & 2032
- Figure 14: North America Orthopedic Navigation Systems Market Revenue (Million), by Application 2024 & 2032
- Figure 15: North America Orthopedic Navigation Systems Market Revenue Share (%), by Application 2024 & 2032
- Figure 16: North America Orthopedic Navigation Systems Market Revenue (Million), by End User 2024 & 2032
- Figure 17: North America Orthopedic Navigation Systems Market Revenue Share (%), by End User 2024 & 2032
- Figure 18: North America Orthopedic Navigation Systems Market Revenue (Million), by Country 2024 & 2032
- Figure 19: North America Orthopedic Navigation Systems Market Revenue Share (%), by Country 2024 & 2032
- Figure 20: Europe Orthopedic Navigation Systems Market Revenue (Million), by Technology 2024 & 2032
- Figure 21: Europe Orthopedic Navigation Systems Market Revenue Share (%), by Technology 2024 & 2032
- Figure 22: Europe Orthopedic Navigation Systems Market Revenue (Million), by Application 2024 & 2032
- Figure 23: Europe Orthopedic Navigation Systems Market Revenue Share (%), by Application 2024 & 2032
- Figure 24: Europe Orthopedic Navigation Systems Market Revenue (Million), by End User 2024 & 2032
- Figure 25: Europe Orthopedic Navigation Systems Market Revenue Share (%), by End User 2024 & 2032
- Figure 26: Europe Orthopedic Navigation Systems Market Revenue (Million), by Country 2024 & 2032
- Figure 27: Europe Orthopedic Navigation Systems Market Revenue Share (%), by Country 2024 & 2032
- Figure 28: Asia Pacific Orthopedic Navigation Systems Market Revenue (Million), by Technology 2024 & 2032
- Figure 29: Asia Pacific Orthopedic Navigation Systems Market Revenue Share (%), by Technology 2024 & 2032
- Figure 30: Asia Pacific Orthopedic Navigation Systems Market Revenue (Million), by Application 2024 & 2032
- Figure 31: Asia Pacific Orthopedic Navigation Systems Market Revenue Share (%), by Application 2024 & 2032
- Figure 32: Asia Pacific Orthopedic Navigation Systems Market Revenue (Million), by End User 2024 & 2032
- Figure 33: Asia Pacific Orthopedic Navigation Systems Market Revenue Share (%), by End User 2024 & 2032
- Figure 34: Asia Pacific Orthopedic Navigation Systems Market Revenue (Million), by Country 2024 & 2032
- Figure 35: Asia Pacific Orthopedic Navigation Systems Market Revenue Share (%), by Country 2024 & 2032
- Figure 36: Middle East Orthopedic Navigation Systems Market Revenue (Million), by Technology 2024 & 2032
- Figure 37: Middle East Orthopedic Navigation Systems Market Revenue Share (%), by Technology 2024 & 2032
- Figure 38: Middle East Orthopedic Navigation Systems Market Revenue (Million), by Application 2024 & 2032
- Figure 39: Middle East Orthopedic Navigation Systems Market Revenue Share (%), by Application 2024 & 2032
- Figure 40: Middle East Orthopedic Navigation Systems Market Revenue (Million), by End User 2024 & 2032
- Figure 41: Middle East Orthopedic Navigation Systems Market Revenue Share (%), by End User 2024 & 2032
- Figure 42: Middle East Orthopedic Navigation Systems Market Revenue (Million), by Country 2024 & 2032
- Figure 43: Middle East Orthopedic Navigation Systems Market Revenue Share (%), by Country 2024 & 2032
- Figure 44: GCC Orthopedic Navigation Systems Market Revenue (Million), by Technology 2024 & 2032
- Figure 45: GCC Orthopedic Navigation Systems Market Revenue Share (%), by Technology 2024 & 2032
- Figure 46: GCC Orthopedic Navigation Systems Market Revenue (Million), by Application 2024 & 2032
- Figure 47: GCC Orthopedic Navigation Systems Market Revenue Share (%), by Application 2024 & 2032
- Figure 48: GCC Orthopedic Navigation Systems Market Revenue (Million), by End User 2024 & 2032
- Figure 49: GCC Orthopedic Navigation Systems Market Revenue Share (%), by End User 2024 & 2032
- Figure 50: GCC Orthopedic Navigation Systems Market Revenue (Million), by Country 2024 & 2032
- Figure 51: GCC Orthopedic Navigation Systems Market Revenue Share (%), by Country 2024 & 2032
- Figure 52: South America Orthopedic Navigation Systems Market Revenue (Million), by Technology 2024 & 2032
- Figure 53: South America Orthopedic Navigation Systems Market Revenue Share (%), by Technology 2024 & 2032
- Figure 54: South America Orthopedic Navigation Systems Market Revenue (Million), by Application 2024 & 2032
- Figure 55: South America Orthopedic Navigation Systems Market Revenue Share (%), by Application 2024 & 2032
- Figure 56: South America Orthopedic Navigation Systems Market Revenue (Million), by End User 2024 & 2032
- Figure 57: South America Orthopedic Navigation Systems Market Revenue Share (%), by End User 2024 & 2032
- Figure 58: South America Orthopedic Navigation Systems Market Revenue (Million), by Country 2024 & 2032
- Figure 59: South America Orthopedic Navigation Systems Market Revenue Share (%), by Country 2024 & 2032
List of Tables
- Table 1: Global Orthopedic Navigation Systems Market Revenue Million Forecast, by Region 2019 & 2032
- Table 2: Global Orthopedic Navigation Systems Market Revenue Million Forecast, by Technology 2019 & 2032
- Table 3: Global Orthopedic Navigation Systems Market Revenue Million Forecast, by Application 2019 & 2032
- Table 4: Global Orthopedic Navigation Systems Market Revenue Million Forecast, by End User 2019 & 2032
- Table 5: Global Orthopedic Navigation Systems Market Revenue Million Forecast, by Region 2019 & 2032
- Table 6: Global Orthopedic Navigation Systems Market Revenue Million Forecast, by Country 2019 & 2032
- Table 7: United States Orthopedic Navigation Systems Market Revenue (Million) Forecast, by Application 2019 & 2032
- Table 8: Canada Orthopedic Navigation Systems Market Revenue (Million) Forecast, by Application 2019 & 2032
- Table 9: Mexico Orthopedic Navigation Systems Market Revenue (Million) Forecast, by Application 2019 & 2032
- Table 10: Global Orthopedic Navigation Systems Market Revenue Million Forecast, by Country 2019 & 2032
- Table 11: United Kingdom Orthopedic Navigation Systems Market Revenue (Million) Forecast, by Application 2019 & 2032
- Table 12: France Orthopedic Navigation Systems Market Revenue (Million) Forecast, by Application 2019 & 2032
- Table 13: Germany Orthopedic Navigation Systems Market Revenue (Million) Forecast, by Application 2019 & 2032
- Table 14: Italy Orthopedic Navigation Systems Market Revenue (Million) Forecast, by Application 2019 & 2032
- Table 15: Spain Orthopedic Navigation Systems Market Revenue (Million) Forecast, by Application 2019 & 2032
- Table 16: Rest of Europe Orthopedic Navigation Systems Market Revenue (Million) Forecast, by Application 2019 & 2032
- Table 17: Global Orthopedic Navigation Systems Market Revenue Million Forecast, by Country 2019 & 2032
- Table 18: India Orthopedic Navigation Systems Market Revenue (Million) Forecast, by Application 2019 & 2032
- Table 19: China Orthopedic Navigation Systems Market Revenue (Million) Forecast, by Application 2019 & 2032
- Table 20: Japan Orthopedic Navigation Systems Market Revenue (Million) Forecast, by Application 2019 & 2032
- Table 21: Australia Orthopedic Navigation Systems Market Revenue (Million) Forecast, by Application 2019 & 2032
- Table 22: South Korea Orthopedic Navigation Systems Market Revenue (Million) Forecast, by Application 2019 & 2032
- Table 23: Rest of Asia Pacific Orthopedic Navigation Systems Market Revenue (Million) Forecast, by Application 2019 & 2032
- Table 24: Global Orthopedic Navigation Systems Market Revenue Million Forecast, by Country 2019 & 2032
- Table 25: GCC Orthopedic Navigation Systems Market Revenue (Million) Forecast, by Application 2019 & 2032
- Table 26: South Africa Orthopedic Navigation Systems Market Revenue (Million) Forecast, by Application 2019 & 2032
- Table 27: Rest of Middle East and Africa Orthopedic Navigation Systems Market Revenue (Million) Forecast, by Application 2019 & 2032
- Table 28: Global Orthopedic Navigation Systems Market Revenue Million Forecast, by Country 2019 & 2032
- Table 29: Brazil Orthopedic Navigation Systems Market Revenue (Million) Forecast, by Application 2019 & 2032
- Table 30: Argentina Orthopedic Navigation Systems Market Revenue (Million) Forecast, by Application 2019 & 2032
- Table 31: Rest of South America Orthopedic Navigation Systems Market Revenue (Million) Forecast, by Application 2019 & 2032
- Table 32: Global Orthopedic Navigation Systems Market Revenue Million Forecast, by Technology 2019 & 2032
- Table 33: Global Orthopedic Navigation Systems Market Revenue Million Forecast, by Application 2019 & 2032
- Table 34: Global Orthopedic Navigation Systems Market Revenue Million Forecast, by End User 2019 & 2032
- Table 35: Global Orthopedic Navigation Systems Market Revenue Million Forecast, by Country 2019 & 2032
- Table 36: United States Orthopedic Navigation Systems Market Revenue (Million) Forecast, by Application 2019 & 2032
- Table 37: Canada Orthopedic Navigation Systems Market Revenue (Million) Forecast, by Application 2019 & 2032
- Table 38: Mexico Orthopedic Navigation Systems Market Revenue (Million) Forecast, by Application 2019 & 2032
- Table 39: Global Orthopedic Navigation Systems Market Revenue Million Forecast, by Technology 2019 & 2032
- Table 40: Global Orthopedic Navigation Systems Market Revenue Million Forecast, by Application 2019 & 2032
- Table 41: Global Orthopedic Navigation Systems Market Revenue Million Forecast, by End User 2019 & 2032
- Table 42: Global Orthopedic Navigation Systems Market Revenue Million Forecast, by Country 2019 & 2032
- Table 43: United Kingdom Orthopedic Navigation Systems Market Revenue (Million) Forecast, by Application 2019 & 2032
- Table 44: France Orthopedic Navigation Systems Market Revenue (Million) Forecast, by Application 2019 & 2032
- Table 45: Germany Orthopedic Navigation Systems Market Revenue (Million) Forecast, by Application 2019 & 2032
- Table 46: Italy Orthopedic Navigation Systems Market Revenue (Million) Forecast, by Application 2019 & 2032
- Table 47: Spain Orthopedic Navigation Systems Market Revenue (Million) Forecast, by Application 2019 & 2032
- Table 48: Rest of Europe Orthopedic Navigation Systems Market Revenue (Million) Forecast, by Application 2019 & 2032
- Table 49: Global Orthopedic Navigation Systems Market Revenue Million Forecast, by Technology 2019 & 2032
- Table 50: Global Orthopedic Navigation Systems Market Revenue Million Forecast, by Application 2019 & 2032
- Table 51: Global Orthopedic Navigation Systems Market Revenue Million Forecast, by End User 2019 & 2032
- Table 52: Global Orthopedic Navigation Systems Market Revenue Million Forecast, by Country 2019 & 2032
- Table 53: India Orthopedic Navigation Systems Market Revenue (Million) Forecast, by Application 2019 & 2032
- Table 54: China Orthopedic Navigation Systems Market Revenue (Million) Forecast, by Application 2019 & 2032
- Table 55: Japan Orthopedic Navigation Systems Market Revenue (Million) Forecast, by Application 2019 & 2032
- Table 56: Australia Orthopedic Navigation Systems Market Revenue (Million) Forecast, by Application 2019 & 2032
- Table 57: South Korea Orthopedic Navigation Systems Market Revenue (Million) Forecast, by Application 2019 & 2032
- Table 58: Rest of Asia Pacific Orthopedic Navigation Systems Market Revenue (Million) Forecast, by Application 2019 & 2032
- Table 59: Global Orthopedic Navigation Systems Market Revenue Million Forecast, by Technology 2019 & 2032
- Table 60: Global Orthopedic Navigation Systems Market Revenue Million Forecast, by Application 2019 & 2032
- Table 61: Global Orthopedic Navigation Systems Market Revenue Million Forecast, by End User 2019 & 2032
- Table 62: Global Orthopedic Navigation Systems Market Revenue Million Forecast, by Country 2019 & 2032
- Table 63: Global Orthopedic Navigation Systems Market Revenue Million Forecast, by Technology 2019 & 2032
- Table 64: Global Orthopedic Navigation Systems Market Revenue Million Forecast, by Application 2019 & 2032
- Table 65: Global Orthopedic Navigation Systems Market Revenue Million Forecast, by End User 2019 & 2032
- Table 66: Global Orthopedic Navigation Systems Market Revenue Million Forecast, by Country 2019 & 2032
- Table 67: South Africa Orthopedic Navigation Systems Market Revenue (Million) Forecast, by Application 2019 & 2032
- Table 68: Rest of Middle East Orthopedic Navigation Systems Market Revenue (Million) Forecast, by Application 2019 & 2032
- Table 69: Global Orthopedic Navigation Systems Market Revenue Million Forecast, by Technology 2019 & 2032
- Table 70: Global Orthopedic Navigation Systems Market Revenue Million Forecast, by Application 2019 & 2032
- Table 71: Global Orthopedic Navigation Systems Market Revenue Million Forecast, by End User 2019 & 2032
- Table 72: Global Orthopedic Navigation Systems Market Revenue Million Forecast, by Country 2019 & 2032
- Table 73: Brazil Orthopedic Navigation Systems Market Revenue (Million) Forecast, by Application 2019 & 2032
- Table 74: Argentina Orthopedic Navigation Systems Market Revenue (Million) Forecast, by Application 2019 & 2032
- Table 75: Rest of South America Orthopedic Navigation Systems Market Revenue (Million) Forecast, by Application 2019 & 2032
Frequently Asked Questions
1. What is the projected Compound Annual Growth Rate (CAGR) of the Orthopedic Navigation Systems Market?
The projected CAGR is approximately 10.01%.
2. Which companies are prominent players in the Orthopedic Navigation Systems Market?
Key companies in the market include MicroPort Medical, Arthrex Inc, Smith & Nephew, Siemens Healthineers, Tynor, Medtronic PLC, Stryker, NuVasive, Brainlab, Zimmer Biomet, B Braun SE.
3. What are the main segments of the Orthopedic Navigation Systems Market?
The market segments include Technology, Application, End User.
4. Can you provide details about the market size?
The market size is estimated to be USD XX Million as of 2022.
5. What are some drivers contributing to market growth?
Associated Advantages of Computer-Assisted Surgeries (CAS); Increasing Adoption of Minimally Invasive Surgical Procedures; Increasing Incidence of Orthopedic Conditions.
6. What are the notable trends driving market growth?
Knee Surgery Segmentation is Expected to Hold a Significant Market Share During the Forecast Period.
7. Are there any restraints impacting market growth?
Increased Procedural Complications and Regulatory Processes for Approval; High Cost of Surgical Navigation Systems and Product.
8. Can you provide examples of recent developments in the market?
In December 2022, SeaSpine Holdings Corporation announced the placement of its 100th 7D FLASH navigation system globally.
9. What pricing options are available for accessing the report?
Pricing options include single-user, multi-user, and enterprise licenses priced at USD 4750, USD 5250, and USD 8750 respectively.
10. Is the market size provided in terms of value or volume?
The market size is provided in terms of value, measured in Million.
11. Are there any specific market keywords associated with the report?
Yes, the market keyword associated with the report is "Orthopedic Navigation Systems Market," which aids in identifying and referencing the specific market segment covered.
12. How do I determine which pricing option suits my needs best?
The pricing options vary based on user requirements and access needs. Individual users may opt for single-user licenses, while businesses requiring broader access may choose multi-user or enterprise licenses for cost-effective access to the report.
13. Are there any additional resources or data provided in the Orthopedic Navigation Systems Market report?
While the report offers comprehensive insights, it's advisable to review the specific contents or supplementary materials provided to ascertain if additional resources or data are available.
14. How can I stay updated on further developments or reports in the Orthopedic Navigation Systems Market?
To stay informed about further developments, trends, and reports in the Orthopedic Navigation Systems Market, consider subscribing to industry newsletters, following relevant companies and organizations, or regularly checking reputable industry news sources and publications.
Methodology
Step 1 - Identification of Relevant Samples Size from Population Database


Step 2 - Approaches for Defining Global Market Size (Value, Volume* & Price*)

Note*: In applicable scenarios
Step 3 - Data Sources
Primary Research
- Web Analytics
- Survey Reports
- Research Institute
- Latest Research Reports
- Opinion Leaders
Secondary Research
- Annual Reports
- White Paper
- Latest Press Release
- Industry Association
- Paid Database
- Investor Presentations

Step 4 - Data Triangulation
Involves using different sources of information in order to increase the validity of a study
These sources are likely to be stakeholders in a program - participants, other researchers, program staff, other community members, and so on.
Then we put all data in single framework & apply various statistical tools to find out the dynamic on the market.
During the analysis stage, feedback from the stakeholder groups would be compared to determine areas of agreement as well as areas of divergence


