
Key Insights
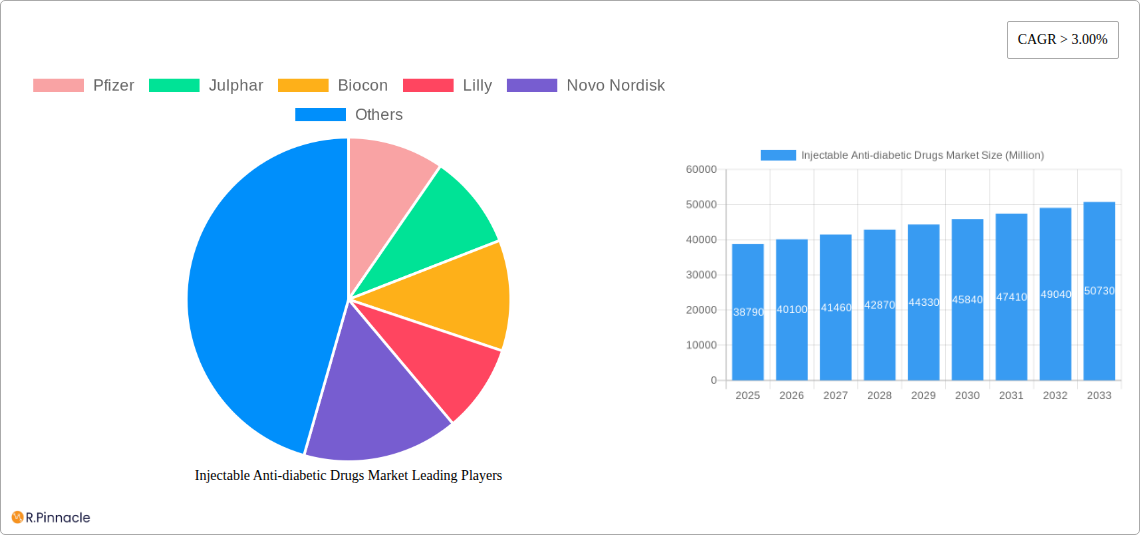
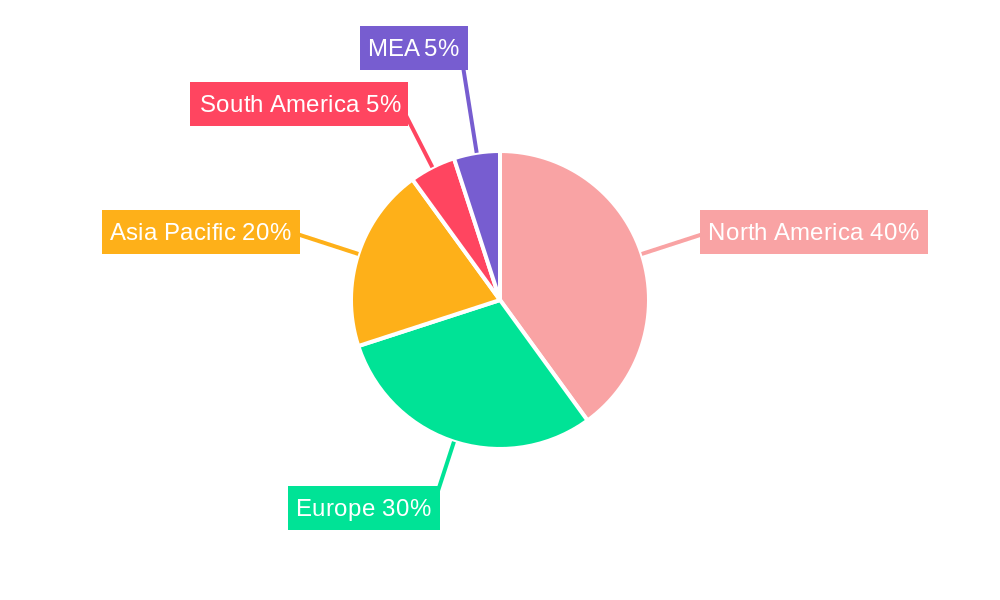
The injectable anti-diabetic drugs market, valued at $38.79 billion in 2025, is projected to experience robust growth, driven by rising prevalence of type 1 and type 2 diabetes globally. This growth is fueled by several factors, including increasing geriatric populations susceptible to diabetes, rising healthcare expenditure, and the growing adoption of advanced insulin therapies like GLP-1 agonists. The market is segmented into various insulin types (basal/long-acting, bolus/fast-acting, human insulins, combination insulins, biosimilars) and GLP-1 agonists (dulaglutide, exenatide, liraglutide, lixisenatide, semaglutide). The increasing preference for convenient and effective GLP-1 receptor agonists is expected to significantly contribute to market expansion. Competition among major pharmaceutical players like Novo Nordisk, Sanofi, Lilly, and Pfizer further intensifies innovation and availability of these drugs. While the market faces constraints such as high drug costs and potential side effects associated with certain injectables, ongoing research and development in this sector aims to address these limitations and improve treatment outcomes. Geographical variations in market share are expected, with North America and Europe holding significant shares due to higher healthcare spending and awareness levels, while Asia Pacific exhibits substantial growth potential given its increasing diabetic population and rising disposable incomes.
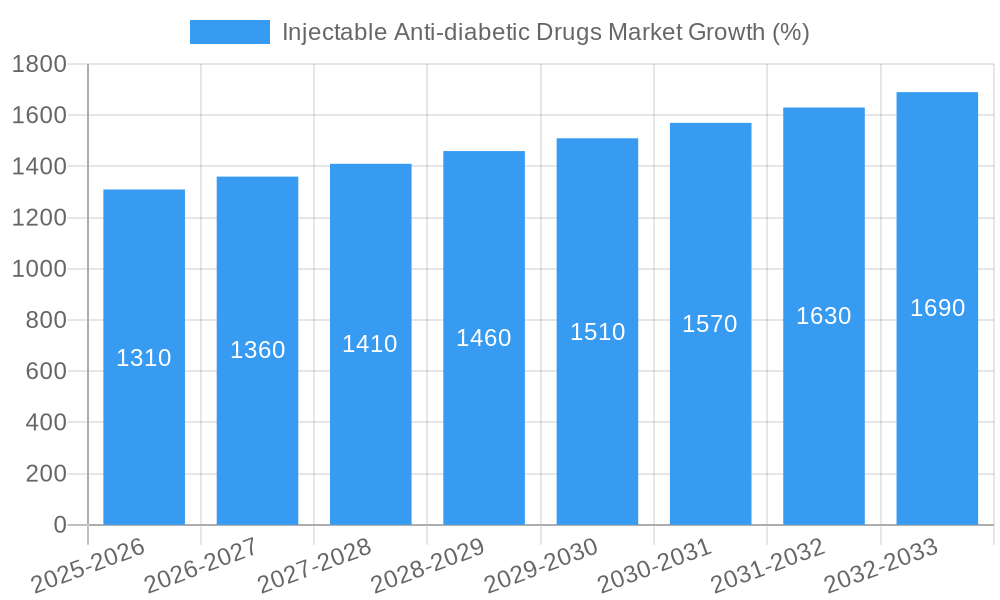
The forecast period (2025-2033) anticipates a sustained CAGR exceeding 3.00%, indicating continuous market expansion. This growth will likely be influenced by factors such as the introduction of newer, more effective injectable anti-diabetic medications, the expansion of healthcare infrastructure in emerging economies, and increasing government initiatives to improve diabetes management. The market's competitive landscape will remain dynamic, with companies focusing on product diversification, strategic partnerships, and research & development to maintain their market positions. However, challenges such as regulatory hurdles, intellectual property issues, and the need for improved patient education and adherence will continue to influence market trajectories. This detailed understanding of market drivers, restraints, and trends will be crucial for stakeholders to make informed strategic decisions.
Injectable Anti-diabetic Drugs Market: A Comprehensive Report (2019-2033)
This in-depth report provides a comprehensive analysis of the Injectable Anti-diabetic Drugs Market, offering invaluable insights for industry professionals, investors, and strategic decision-makers. Covering the period from 2019 to 2033, with a focus on 2025, this report meticulously examines market dynamics, competitive landscapes, and future growth potential. The market is projected to reach xx Million by 2033, showcasing significant growth opportunities.
Injectable Anti-diabetic Drugs Market Market Structure & Innovation Trends
This section analyzes the market structure, highlighting key players, their market share, and the innovative forces shaping the industry. The report delves into the competitive landscape, exploring mergers and acquisitions (M&A) activities and their impact on market consolidation. Regulatory frameworks, product substitutes, and end-user demographics are also examined, providing a holistic view of the market’s structure and future trajectory.
- Market Concentration: The market exhibits a moderately concentrated structure, with key players like Novo Nordisk, Sanofi, and Lilly holding significant market share. The exact percentages are detailed within the full report.
- Innovation Drivers: Continuous R&D efforts focused on developing novel insulin analogs, GLP-1 receptor agonists, and combination therapies are driving market innovation.
- Regulatory Frameworks: Stringent regulatory approvals and pricing policies significantly influence market access and growth. The report analyzes the impact of these regulations across various geographies.
- Product Substitutes: Oral anti-diabetic medications and lifestyle interventions pose competitive challenges to injectable drugs.
- M&A Activities: The report details significant M&A activities in the sector, including deal values and their impact on market dynamics. For example, the xx Million acquisition of Company X by Company Y in 2022 fundamentally reshaped the competitive landscape.
- End-User Demographics: The increasing prevalence of diabetes, especially type 2 diabetes, amongst aging populations globally is a primary driver of market growth.
Injectable Anti-diabetic Drugs Market Market Dynamics & Trends
This section explores the key factors influencing market growth, including technological advancements, evolving consumer preferences, and the competitive dynamics among major players. The report provides a detailed analysis of the market's Compound Annual Growth Rate (CAGR) and market penetration rates across various segments. Specific trends like the rise of biosimilar insulins and the increasing adoption of GLP-1 agonists are meticulously examined. The analysis considers the impact of factors such as changing treatment guidelines, increasing healthcare expenditure, and the growing awareness of diabetes management. The report also explores the impact of technological disruptions, such as advancements in drug delivery systems and personalized medicine, on market dynamics. The CAGR for the forecast period (2025-2033) is estimated to be xx%.
Dominant Regions & Segments in Injectable Anti-diabetic Drugs Market
This section identifies the leading geographical regions and market segments within the injectable anti-diabetic drugs market. The analysis includes a detailed breakdown of each segment – Insulin (Basal/Long-acting, Bolus/Fast-acting, Traditional Human, Combination, Biosimilar) and GLP-1 agonists (Dulaglutide, Exenatide, Liraglutide, Lixisenatide, Semaglutide) – highlighting key growth drivers and dominance analysis.
Key Drivers:
- North America: High prevalence of diabetes, advanced healthcare infrastructure, and high healthcare expenditure contribute to its dominance.
- Europe: Established healthcare systems and increasing adoption of innovative therapies fuel market growth.
- Asia Pacific: Rapidly growing diabetic population and increasing healthcare awareness drive significant growth potential.
Segment Dominance:
- GLP-1 Agonists: This segment demonstrates significant growth due to its efficacy in weight management and improved glycemic control. Semaglutide's recent approval for weight loss further accelerates growth.
- Insulin: While a mature market, the increasing prevalence of diabetes continues to drive demand for various insulin formulations, especially long-acting insulins and biosimilars. The report provides a detailed comparative analysis of each insulin segment. Detailed market size projections for each segment are available in the full report.
Injectable Anti-diabetic Drugs Market Product Innovations
The market witnesses continuous innovation in the development of new and improved injectable anti-diabetic drugs. Recent advancements focus on optimizing drug delivery systems, enhancing efficacy and safety profiles, and reducing side effects. This includes the development of novel insulin analogs with improved pharmacokinetic profiles and long-acting GLP-1 receptor agonists with once-weekly or even monthly administration options. The competitive advantages of these innovations are evaluated based on their efficacy, safety, and convenience for patients.
Report Scope & Segmentation Analysis
This report provides a comprehensive segmentation of the injectable anti-diabetic drugs market, analyzing each segment's growth projections, market size, and competitive dynamics. The report includes detailed analysis of:
- Insulin: Each sub-segment (Basal/Long-acting, Bolus/Fast-acting, Traditional Human, Combination, Biosimilar) is analyzed with specific market size and growth projections.
- GLP-1 Agonists: Detailed analysis of each drug (Dulaglutide, Exenatide, Liraglutide, Lixisenatide, Semaglutide) is provided, including market size and competitive landscape. The report quantifies the competitive intensity within each segment.
Key Drivers of Injectable Anti-diabetic Drugs Market Growth
The market's growth is fueled by several key factors, including the rising prevalence of diabetes worldwide, technological advancements in drug delivery systems and formulations, favorable regulatory environment in some regions, and increasing investments in R&D. The increasing awareness of diabetes management and the rising adoption of innovative therapies further propel market growth.
Challenges in the Injectable Anti-diabetic Drugs Market Sector
The market faces several challenges, including high drug prices leading to affordability issues, stringent regulatory approvals and pricing policies, potential side effects associated with certain drugs, and intense competition among established and emerging players. Supply chain disruptions and increasing generic competition also pose significant challenges. These challenges are quantified in terms of their impact on market growth.
Emerging Opportunities in Injectable Anti-diabetic Drugs Market
The market presents significant opportunities, including the development of novel combination therapies, advancements in personalized medicine, the expansion into emerging markets, and growing interest in digital health technologies for diabetes management. The increasing focus on weight management and the potential for GLP-1 agonists in this area represent significant growth avenues.
Leading Players in the Injectable Anti-diabetic Drugs Market Market
Key Developments in Injectable Anti-diabetic Drugs Market Industry
- March 2023: Novo Nordisk announced a significant price reduction (75% for NovoLog and other brands, 65% for some others) for its insulin products in the United States, effective January 1, 2024. This development is expected to significantly impact market dynamics and accessibility.
- March 2023: The NHS approved Wegovy (semaglutide) for weight loss, expanding the market for GLP-1 agonists and potentially increasing demand. This approval highlights the expanding therapeutic use of GLP-1 receptor agonists beyond diabetes management.
Future Outlook for Injectable Anti-diabetic Drugs Market Market
The Injectable Anti-diabetic Drugs Market is poised for continued growth driven by technological advancements, increasing prevalence of diabetes, and the expansion of therapeutic applications for existing drugs. The development of novel combination therapies and personalized medicine approaches will further accelerate market growth. Strategic partnerships and collaborations between pharmaceutical companies and technology firms will play a key role in shaping the market's future.
Injectable Anti-diabetic Drugs Market Segmentation
-
1. Insulin
- 1.1. Basal or Long-acting Insulins
- 1.2. Bolus or Fast-acting Insulins
- 1.3. Traditional Human Insulins
- 1.4. Combination Insulins
- 1.5. Biosimilar Insulins
-
2. Glucagon-like peptide-1 (GLP-1) agonists drugs
- 2.1. Dulaglutide
- 2.2. Exenatide
- 2.3. Liraglutide
- 2.4. Lixisenatide
- 2.5. Semaglutide
Injectable Anti-diabetic Drugs Market Segmentation By Geography
-
1. North America
- 1.1. United States
- 1.2. Canada
- 1.3. Rest of North America
-
2. Europe
- 2.1. Germany
- 2.2. Spain
- 2.3. Italy
- 2.4. France
- 2.5. United Kingdom
- 2.6. Russia
- 2.7. Rest of Europe
-
3. Asia Pacific
- 3.1. Japan
- 3.2. China
- 3.3. Australia
- 3.4. India
- 3.5. South Korea
- 3.6. Malaysia
- 3.7. Indonesia
- 3.8. Thailand
- 3.9. Philippines
- 3.10. Vietnam
- 3.11. Rest of Asia Pacific
-
4. Latin America
- 4.1. Brazil
- 4.2. Mexico
- 4.3. Rest of Latin America
-
5. Middle East and Africa
- 5.1. South Africa
- 5.2. Saudi Arabia
- 5.3. Oman
- 5.4. Egypt
- 5.5. Iran
- 5.6. Rest of Middle East and Africa
Injectable Anti-diabetic Drugs Market REPORT HIGHLIGHTS
| Aspects | Details |
|---|---|
| Study Period | 2019-2033 |
| Base Year | 2024 |
| Estimated Year | 2025 |
| Forecast Period | 2025-2033 |
| Historical Period | 2019-2024 |
| Growth Rate | CAGR of > 3.00% from 2019-2033 |
| Segmentation |
|
Table of Contents
- 1. Introduction
- 1.1. Research Scope
- 1.2. Market Segmentation
- 1.3. Research Methodology
- 1.4. Definitions and Assumptions
- 2. Executive Summary
- 2.1. Introduction
- 3. Market Dynamics
- 3.1. Introduction
- 3.2. Market Drivers
- 3.2.1. Rising R&D Focus on the Development of Biotechnology-engineered Anti-cancer Drugs; Rapid Growth in the Usage of Pre-filled Syringes for Biologics; Increased Outsourcing Activities Across Value Chain Expected to Boost Supply of Injectable Products
- 3.3. Market Restrains
- 3.3.1. High Expenses Associated with Inventory Management; Availability of Alternate Drug Delivery Methods
- 3.4. Market Trends
- 3.4.1. Dulaglutide Segment Occupied the Highest Market Share in the Injectable Anti-diabetic Drugs Market in the current year
- 4. Market Factor Analysis
- 4.1. Porters Five Forces
- 4.2. Supply/Value Chain
- 4.3. PESTEL analysis
- 4.4. Market Entropy
- 4.5. Patent/Trademark Analysis
- 5. Global Injectable Anti-diabetic Drugs Market Analysis, Insights and Forecast, 2019-2031
- 5.1. Market Analysis, Insights and Forecast - by Insulin
- 5.1.1. Basal or Long-acting Insulins
- 5.1.2. Bolus or Fast-acting Insulins
- 5.1.3. Traditional Human Insulins
- 5.1.4. Combination Insulins
- 5.1.5. Biosimilar Insulins
- 5.2. Market Analysis, Insights and Forecast - by Glucagon-like peptide-1 (GLP-1) agonists drugs
- 5.2.1. Dulaglutide
- 5.2.2. Exenatide
- 5.2.3. Liraglutide
- 5.2.4. Lixisenatide
- 5.2.5. Semaglutide
- 5.3. Market Analysis, Insights and Forecast - by Region
- 5.3.1. North America
- 5.3.2. Europe
- 5.3.3. Asia Pacific
- 5.3.4. Latin America
- 5.3.5. Middle East and Africa
- 5.1. Market Analysis, Insights and Forecast - by Insulin
- 6. North America Injectable Anti-diabetic Drugs Market Analysis, Insights and Forecast, 2019-2031
- 6.1. Market Analysis, Insights and Forecast - by Insulin
- 6.1.1. Basal or Long-acting Insulins
- 6.1.2. Bolus or Fast-acting Insulins
- 6.1.3. Traditional Human Insulins
- 6.1.4. Combination Insulins
- 6.1.5. Biosimilar Insulins
- 6.2. Market Analysis, Insights and Forecast - by Glucagon-like peptide-1 (GLP-1) agonists drugs
- 6.2.1. Dulaglutide
- 6.2.2. Exenatide
- 6.2.3. Liraglutide
- 6.2.4. Lixisenatide
- 6.2.5. Semaglutide
- 6.1. Market Analysis, Insights and Forecast - by Insulin
- 7. Europe Injectable Anti-diabetic Drugs Market Analysis, Insights and Forecast, 2019-2031
- 7.1. Market Analysis, Insights and Forecast - by Insulin
- 7.1.1. Basal or Long-acting Insulins
- 7.1.2. Bolus or Fast-acting Insulins
- 7.1.3. Traditional Human Insulins
- 7.1.4. Combination Insulins
- 7.1.5. Biosimilar Insulins
- 7.2. Market Analysis, Insights and Forecast - by Glucagon-like peptide-1 (GLP-1) agonists drugs
- 7.2.1. Dulaglutide
- 7.2.2. Exenatide
- 7.2.3. Liraglutide
- 7.2.4. Lixisenatide
- 7.2.5. Semaglutide
- 7.1. Market Analysis, Insights and Forecast - by Insulin
- 8. Asia Pacific Injectable Anti-diabetic Drugs Market Analysis, Insights and Forecast, 2019-2031
- 8.1. Market Analysis, Insights and Forecast - by Insulin
- 8.1.1. Basal or Long-acting Insulins
- 8.1.2. Bolus or Fast-acting Insulins
- 8.1.3. Traditional Human Insulins
- 8.1.4. Combination Insulins
- 8.1.5. Biosimilar Insulins
- 8.2. Market Analysis, Insights and Forecast - by Glucagon-like peptide-1 (GLP-1) agonists drugs
- 8.2.1. Dulaglutide
- 8.2.2. Exenatide
- 8.2.3. Liraglutide
- 8.2.4. Lixisenatide
- 8.2.5. Semaglutide
- 8.1. Market Analysis, Insights and Forecast - by Insulin
- 9. Latin America Injectable Anti-diabetic Drugs Market Analysis, Insights and Forecast, 2019-2031
- 9.1. Market Analysis, Insights and Forecast - by Insulin
- 9.1.1. Basal or Long-acting Insulins
- 9.1.2. Bolus or Fast-acting Insulins
- 9.1.3. Traditional Human Insulins
- 9.1.4. Combination Insulins
- 9.1.5. Biosimilar Insulins
- 9.2. Market Analysis, Insights and Forecast - by Glucagon-like peptide-1 (GLP-1) agonists drugs
- 9.2.1. Dulaglutide
- 9.2.2. Exenatide
- 9.2.3. Liraglutide
- 9.2.4. Lixisenatide
- 9.2.5. Semaglutide
- 9.1. Market Analysis, Insights and Forecast - by Insulin
- 10. Middle East and Africa Injectable Anti-diabetic Drugs Market Analysis, Insights and Forecast, 2019-2031
- 10.1. Market Analysis, Insights and Forecast - by Insulin
- 10.1.1. Basal or Long-acting Insulins
- 10.1.2. Bolus or Fast-acting Insulins
- 10.1.3. Traditional Human Insulins
- 10.1.4. Combination Insulins
- 10.1.5. Biosimilar Insulins
- 10.2. Market Analysis, Insights and Forecast - by Glucagon-like peptide-1 (GLP-1) agonists drugs
- 10.2.1. Dulaglutide
- 10.2.2. Exenatide
- 10.2.3. Liraglutide
- 10.2.4. Lixisenatide
- 10.2.5. Semaglutide
- 10.1. Market Analysis, Insights and Forecast - by Insulin
- 11. North America Injectable Anti-diabetic Drugs Market Analysis, Insights and Forecast, 2019-2031
- 11.1. Market Analysis, Insights and Forecast - By Country/Sub-region
- 11.1.1 United States
- 11.1.2 Canada
- 11.1.3 Mexico
- 12. Europe Injectable Anti-diabetic Drugs Market Analysis, Insights and Forecast, 2019-2031
- 12.1. Market Analysis, Insights and Forecast - By Country/Sub-region
- 12.1.1 Germany
- 12.1.2 United Kingdom
- 12.1.3 France
- 12.1.4 Spain
- 12.1.5 Italy
- 12.1.6 Spain
- 12.1.7 Belgium
- 12.1.8 Netherland
- 12.1.9 Nordics
- 12.1.10 Rest of Europe
- 13. Asia Pacific Injectable Anti-diabetic Drugs Market Analysis, Insights and Forecast, 2019-2031
- 13.1. Market Analysis, Insights and Forecast - By Country/Sub-region
- 13.1.1 China
- 13.1.2 Japan
- 13.1.3 India
- 13.1.4 South Korea
- 13.1.5 Southeast Asia
- 13.1.6 Australia
- 13.1.7 Indonesia
- 13.1.8 Phillipes
- 13.1.9 Singapore
- 13.1.10 Thailandc
- 13.1.11 Rest of Asia Pacific
- 14. South America Injectable Anti-diabetic Drugs Market Analysis, Insights and Forecast, 2019-2031
- 14.1. Market Analysis, Insights and Forecast - By Country/Sub-region
- 14.1.1 Brazil
- 14.1.2 Argentina
- 14.1.3 Peru
- 14.1.4 Chile
- 14.1.5 Colombia
- 14.1.6 Ecuador
- 14.1.7 Venezuela
- 14.1.8 Rest of South America
- 15. North America Injectable Anti-diabetic Drugs Market Analysis, Insights and Forecast, 2019-2031
- 15.1. Market Analysis, Insights and Forecast - By Country/Sub-region
- 15.1.1 United States
- 15.1.2 Canada
- 15.1.3 Mexico
- 16. MEA Injectable Anti-diabetic Drugs Market Analysis, Insights and Forecast, 2019-2031
- 16.1. Market Analysis, Insights and Forecast - By Country/Sub-region
- 16.1.1 United Arab Emirates
- 16.1.2 Saudi Arabia
- 16.1.3 South Africa
- 16.1.4 Rest of Middle East and Africa
- 17. Competitive Analysis
- 17.1. Global Market Share Analysis 2024
- 17.2. Company Profiles
- 17.2.1 Pfizer
- 17.2.1.1. Overview
- 17.2.1.2. Products
- 17.2.1.3. SWOT Analysis
- 17.2.1.4. Recent Developments
- 17.2.1.5. Financials (Based on Availability)
- 17.2.2 Julphar
- 17.2.2.1. Overview
- 17.2.2.2. Products
- 17.2.2.3. SWOT Analysis
- 17.2.2.4. Recent Developments
- 17.2.2.5. Financials (Based on Availability)
- 17.2.3 Biocon
- 17.2.3.1. Overview
- 17.2.3.2. Products
- 17.2.3.3. SWOT Analysis
- 17.2.3.4. Recent Developments
- 17.2.3.5. Financials (Based on Availability)
- 17.2.4 Lilly
- 17.2.4.1. Overview
- 17.2.4.2. Products
- 17.2.4.3. SWOT Analysis
- 17.2.4.4. Recent Developments
- 17.2.4.5. Financials (Based on Availability)
- 17.2.5 Novo Nordisk
- 17.2.5.1. Overview
- 17.2.5.2. Products
- 17.2.5.3. SWOT Analysis
- 17.2.5.4. Recent Developments
- 17.2.5.5. Financials (Based on Availability)
- 17.2.6 Sanofi
- 17.2.6.1. Overview
- 17.2.6.2. Products
- 17.2.6.3. SWOT Analysis
- 17.2.6.4. Recent Developments
- 17.2.6.5. Financials (Based on Availability)
- 17.2.1 Pfizer
List of Figures
- Figure 1: Global Injectable Anti-diabetic Drugs Market Revenue Breakdown (Million, %) by Region 2024 & 2032
- Figure 2: Global Injectable Anti-diabetic Drugs Market Volume Breakdown (K Unit, %) by Region 2024 & 2032
- Figure 3: North America Injectable Anti-diabetic Drugs Market Revenue (Million), by Country 2024 & 2032
- Figure 4: North America Injectable Anti-diabetic Drugs Market Volume (K Unit), by Country 2024 & 2032
- Figure 5: North America Injectable Anti-diabetic Drugs Market Revenue Share (%), by Country 2024 & 2032
- Figure 6: North America Injectable Anti-diabetic Drugs Market Volume Share (%), by Country 2024 & 2032
- Figure 7: Europe Injectable Anti-diabetic Drugs Market Revenue (Million), by Country 2024 & 2032
- Figure 8: Europe Injectable Anti-diabetic Drugs Market Volume (K Unit), by Country 2024 & 2032
- Figure 9: Europe Injectable Anti-diabetic Drugs Market Revenue Share (%), by Country 2024 & 2032
- Figure 10: Europe Injectable Anti-diabetic Drugs Market Volume Share (%), by Country 2024 & 2032
- Figure 11: Asia Pacific Injectable Anti-diabetic Drugs Market Revenue (Million), by Country 2024 & 2032
- Figure 12: Asia Pacific Injectable Anti-diabetic Drugs Market Volume (K Unit), by Country 2024 & 2032
- Figure 13: Asia Pacific Injectable Anti-diabetic Drugs Market Revenue Share (%), by Country 2024 & 2032
- Figure 14: Asia Pacific Injectable Anti-diabetic Drugs Market Volume Share (%), by Country 2024 & 2032
- Figure 15: South America Injectable Anti-diabetic Drugs Market Revenue (Million), by Country 2024 & 2032
- Figure 16: South America Injectable Anti-diabetic Drugs Market Volume (K Unit), by Country 2024 & 2032
- Figure 17: South America Injectable Anti-diabetic Drugs Market Revenue Share (%), by Country 2024 & 2032
- Figure 18: South America Injectable Anti-diabetic Drugs Market Volume Share (%), by Country 2024 & 2032
- Figure 19: North America Injectable Anti-diabetic Drugs Market Revenue (Million), by Country 2024 & 2032
- Figure 20: North America Injectable Anti-diabetic Drugs Market Volume (K Unit), by Country 2024 & 2032
- Figure 21: North America Injectable Anti-diabetic Drugs Market Revenue Share (%), by Country 2024 & 2032
- Figure 22: North America Injectable Anti-diabetic Drugs Market Volume Share (%), by Country 2024 & 2032
- Figure 23: MEA Injectable Anti-diabetic Drugs Market Revenue (Million), by Country 2024 & 2032
- Figure 24: MEA Injectable Anti-diabetic Drugs Market Volume (K Unit), by Country 2024 & 2032
- Figure 25: MEA Injectable Anti-diabetic Drugs Market Revenue Share (%), by Country 2024 & 2032
- Figure 26: MEA Injectable Anti-diabetic Drugs Market Volume Share (%), by Country 2024 & 2032
- Figure 27: North America Injectable Anti-diabetic Drugs Market Revenue (Million), by Insulin 2024 & 2032
- Figure 28: North America Injectable Anti-diabetic Drugs Market Volume (K Unit), by Insulin 2024 & 2032
- Figure 29: North America Injectable Anti-diabetic Drugs Market Revenue Share (%), by Insulin 2024 & 2032
- Figure 30: North America Injectable Anti-diabetic Drugs Market Volume Share (%), by Insulin 2024 & 2032
- Figure 31: North America Injectable Anti-diabetic Drugs Market Revenue (Million), by Glucagon-like peptide-1 (GLP-1) agonists drugs 2024 & 2032
- Figure 32: North America Injectable Anti-diabetic Drugs Market Volume (K Unit), by Glucagon-like peptide-1 (GLP-1) agonists drugs 2024 & 2032
- Figure 33: North America Injectable Anti-diabetic Drugs Market Revenue Share (%), by Glucagon-like peptide-1 (GLP-1) agonists drugs 2024 & 2032
- Figure 34: North America Injectable Anti-diabetic Drugs Market Volume Share (%), by Glucagon-like peptide-1 (GLP-1) agonists drugs 2024 & 2032
- Figure 35: North America Injectable Anti-diabetic Drugs Market Revenue (Million), by Country 2024 & 2032
- Figure 36: North America Injectable Anti-diabetic Drugs Market Volume (K Unit), by Country 2024 & 2032
- Figure 37: North America Injectable Anti-diabetic Drugs Market Revenue Share (%), by Country 2024 & 2032
- Figure 38: North America Injectable Anti-diabetic Drugs Market Volume Share (%), by Country 2024 & 2032
- Figure 39: Europe Injectable Anti-diabetic Drugs Market Revenue (Million), by Insulin 2024 & 2032
- Figure 40: Europe Injectable Anti-diabetic Drugs Market Volume (K Unit), by Insulin 2024 & 2032
- Figure 41: Europe Injectable Anti-diabetic Drugs Market Revenue Share (%), by Insulin 2024 & 2032
- Figure 42: Europe Injectable Anti-diabetic Drugs Market Volume Share (%), by Insulin 2024 & 2032
- Figure 43: Europe Injectable Anti-diabetic Drugs Market Revenue (Million), by Glucagon-like peptide-1 (GLP-1) agonists drugs 2024 & 2032
- Figure 44: Europe Injectable Anti-diabetic Drugs Market Volume (K Unit), by Glucagon-like peptide-1 (GLP-1) agonists drugs 2024 & 2032
- Figure 45: Europe Injectable Anti-diabetic Drugs Market Revenue Share (%), by Glucagon-like peptide-1 (GLP-1) agonists drugs 2024 & 2032
- Figure 46: Europe Injectable Anti-diabetic Drugs Market Volume Share (%), by Glucagon-like peptide-1 (GLP-1) agonists drugs 2024 & 2032
- Figure 47: Europe Injectable Anti-diabetic Drugs Market Revenue (Million), by Country 2024 & 2032
- Figure 48: Europe Injectable Anti-diabetic Drugs Market Volume (K Unit), by Country 2024 & 2032
- Figure 49: Europe Injectable Anti-diabetic Drugs Market Revenue Share (%), by Country 2024 & 2032
- Figure 50: Europe Injectable Anti-diabetic Drugs Market Volume Share (%), by Country 2024 & 2032
- Figure 51: Asia Pacific Injectable Anti-diabetic Drugs Market Revenue (Million), by Insulin 2024 & 2032
- Figure 52: Asia Pacific Injectable Anti-diabetic Drugs Market Volume (K Unit), by Insulin 2024 & 2032
- Figure 53: Asia Pacific Injectable Anti-diabetic Drugs Market Revenue Share (%), by Insulin 2024 & 2032
- Figure 54: Asia Pacific Injectable Anti-diabetic Drugs Market Volume Share (%), by Insulin 2024 & 2032
- Figure 55: Asia Pacific Injectable Anti-diabetic Drugs Market Revenue (Million), by Glucagon-like peptide-1 (GLP-1) agonists drugs 2024 & 2032
- Figure 56: Asia Pacific Injectable Anti-diabetic Drugs Market Volume (K Unit), by Glucagon-like peptide-1 (GLP-1) agonists drugs 2024 & 2032
- Figure 57: Asia Pacific Injectable Anti-diabetic Drugs Market Revenue Share (%), by Glucagon-like peptide-1 (GLP-1) agonists drugs 2024 & 2032
- Figure 58: Asia Pacific Injectable Anti-diabetic Drugs Market Volume Share (%), by Glucagon-like peptide-1 (GLP-1) agonists drugs 2024 & 2032
- Figure 59: Asia Pacific Injectable Anti-diabetic Drugs Market Revenue (Million), by Country 2024 & 2032
- Figure 60: Asia Pacific Injectable Anti-diabetic Drugs Market Volume (K Unit), by Country 2024 & 2032
- Figure 61: Asia Pacific Injectable Anti-diabetic Drugs Market Revenue Share (%), by Country 2024 & 2032
- Figure 62: Asia Pacific Injectable Anti-diabetic Drugs Market Volume Share (%), by Country 2024 & 2032
- Figure 63: Latin America Injectable Anti-diabetic Drugs Market Revenue (Million), by Insulin 2024 & 2032
- Figure 64: Latin America Injectable Anti-diabetic Drugs Market Volume (K Unit), by Insulin 2024 & 2032
- Figure 65: Latin America Injectable Anti-diabetic Drugs Market Revenue Share (%), by Insulin 2024 & 2032
- Figure 66: Latin America Injectable Anti-diabetic Drugs Market Volume Share (%), by Insulin 2024 & 2032
- Figure 67: Latin America Injectable Anti-diabetic Drugs Market Revenue (Million), by Glucagon-like peptide-1 (GLP-1) agonists drugs 2024 & 2032
- Figure 68: Latin America Injectable Anti-diabetic Drugs Market Volume (K Unit), by Glucagon-like peptide-1 (GLP-1) agonists drugs 2024 & 2032
- Figure 69: Latin America Injectable Anti-diabetic Drugs Market Revenue Share (%), by Glucagon-like peptide-1 (GLP-1) agonists drugs 2024 & 2032
- Figure 70: Latin America Injectable Anti-diabetic Drugs Market Volume Share (%), by Glucagon-like peptide-1 (GLP-1) agonists drugs 2024 & 2032
- Figure 71: Latin America Injectable Anti-diabetic Drugs Market Revenue (Million), by Country 2024 & 2032
- Figure 72: Latin America Injectable Anti-diabetic Drugs Market Volume (K Unit), by Country 2024 & 2032
- Figure 73: Latin America Injectable Anti-diabetic Drugs Market Revenue Share (%), by Country 2024 & 2032
- Figure 74: Latin America Injectable Anti-diabetic Drugs Market Volume Share (%), by Country 2024 & 2032
- Figure 75: Middle East and Africa Injectable Anti-diabetic Drugs Market Revenue (Million), by Insulin 2024 & 2032
- Figure 76: Middle East and Africa Injectable Anti-diabetic Drugs Market Volume (K Unit), by Insulin 2024 & 2032
- Figure 77: Middle East and Africa Injectable Anti-diabetic Drugs Market Revenue Share (%), by Insulin 2024 & 2032
- Figure 78: Middle East and Africa Injectable Anti-diabetic Drugs Market Volume Share (%), by Insulin 2024 & 2032
- Figure 79: Middle East and Africa Injectable Anti-diabetic Drugs Market Revenue (Million), by Glucagon-like peptide-1 (GLP-1) agonists drugs 2024 & 2032
- Figure 80: Middle East and Africa Injectable Anti-diabetic Drugs Market Volume (K Unit), by Glucagon-like peptide-1 (GLP-1) agonists drugs 2024 & 2032
- Figure 81: Middle East and Africa Injectable Anti-diabetic Drugs Market Revenue Share (%), by Glucagon-like peptide-1 (GLP-1) agonists drugs 2024 & 2032
- Figure 82: Middle East and Africa Injectable Anti-diabetic Drugs Market Volume Share (%), by Glucagon-like peptide-1 (GLP-1) agonists drugs 2024 & 2032
- Figure 83: Middle East and Africa Injectable Anti-diabetic Drugs Market Revenue (Million), by Country 2024 & 2032
- Figure 84: Middle East and Africa Injectable Anti-diabetic Drugs Market Volume (K Unit), by Country 2024 & 2032
- Figure 85: Middle East and Africa Injectable Anti-diabetic Drugs Market Revenue Share (%), by Country 2024 & 2032
- Figure 86: Middle East and Africa Injectable Anti-diabetic Drugs Market Volume Share (%), by Country 2024 & 2032
List of Tables
- Table 1: Global Injectable Anti-diabetic Drugs Market Revenue Million Forecast, by Region 2019 & 2032
- Table 2: Global Injectable Anti-diabetic Drugs Market Volume K Unit Forecast, by Region 2019 & 2032
- Table 3: Global Injectable Anti-diabetic Drugs Market Revenue Million Forecast, by Insulin 2019 & 2032
- Table 4: Global Injectable Anti-diabetic Drugs Market Volume K Unit Forecast, by Insulin 2019 & 2032
- Table 5: Global Injectable Anti-diabetic Drugs Market Revenue Million Forecast, by Glucagon-like peptide-1 (GLP-1) agonists drugs 2019 & 2032
- Table 6: Global Injectable Anti-diabetic Drugs Market Volume K Unit Forecast, by Glucagon-like peptide-1 (GLP-1) agonists drugs 2019 & 2032
- Table 7: Global Injectable Anti-diabetic Drugs Market Revenue Million Forecast, by Region 2019 & 2032
- Table 8: Global Injectable Anti-diabetic Drugs Market Volume K Unit Forecast, by Region 2019 & 2032
- Table 9: Global Injectable Anti-diabetic Drugs Market Revenue Million Forecast, by Country 2019 & 2032
- Table 10: Global Injectable Anti-diabetic Drugs Market Volume K Unit Forecast, by Country 2019 & 2032
- Table 11: United States Injectable Anti-diabetic Drugs Market Revenue (Million) Forecast, by Application 2019 & 2032
- Table 12: United States Injectable Anti-diabetic Drugs Market Volume (K Unit) Forecast, by Application 2019 & 2032
- Table 13: Canada Injectable Anti-diabetic Drugs Market Revenue (Million) Forecast, by Application 2019 & 2032
- Table 14: Canada Injectable Anti-diabetic Drugs Market Volume (K Unit) Forecast, by Application 2019 & 2032
- Table 15: Mexico Injectable Anti-diabetic Drugs Market Revenue (Million) Forecast, by Application 2019 & 2032
- Table 16: Mexico Injectable Anti-diabetic Drugs Market Volume (K Unit) Forecast, by Application 2019 & 2032
- Table 17: Global Injectable Anti-diabetic Drugs Market Revenue Million Forecast, by Country 2019 & 2032
- Table 18: Global Injectable Anti-diabetic Drugs Market Volume K Unit Forecast, by Country 2019 & 2032
- Table 19: Germany Injectable Anti-diabetic Drugs Market Revenue (Million) Forecast, by Application 2019 & 2032
- Table 20: Germany Injectable Anti-diabetic Drugs Market Volume (K Unit) Forecast, by Application 2019 & 2032
- Table 21: United Kingdom Injectable Anti-diabetic Drugs Market Revenue (Million) Forecast, by Application 2019 & 2032
- Table 22: United Kingdom Injectable Anti-diabetic Drugs Market Volume (K Unit) Forecast, by Application 2019 & 2032
- Table 23: France Injectable Anti-diabetic Drugs Market Revenue (Million) Forecast, by Application 2019 & 2032
- Table 24: France Injectable Anti-diabetic Drugs Market Volume (K Unit) Forecast, by Application 2019 & 2032
- Table 25: Spain Injectable Anti-diabetic Drugs Market Revenue (Million) Forecast, by Application 2019 & 2032
- Table 26: Spain Injectable Anti-diabetic Drugs Market Volume (K Unit) Forecast, by Application 2019 & 2032
- Table 27: Italy Injectable Anti-diabetic Drugs Market Revenue (Million) Forecast, by Application 2019 & 2032
- Table 28: Italy Injectable Anti-diabetic Drugs Market Volume (K Unit) Forecast, by Application 2019 & 2032
- Table 29: Spain Injectable Anti-diabetic Drugs Market Revenue (Million) Forecast, by Application 2019 & 2032
- Table 30: Spain Injectable Anti-diabetic Drugs Market Volume (K Unit) Forecast, by Application 2019 & 2032
- Table 31: Belgium Injectable Anti-diabetic Drugs Market Revenue (Million) Forecast, by Application 2019 & 2032
- Table 32: Belgium Injectable Anti-diabetic Drugs Market Volume (K Unit) Forecast, by Application 2019 & 2032
- Table 33: Netherland Injectable Anti-diabetic Drugs Market Revenue (Million) Forecast, by Application 2019 & 2032
- Table 34: Netherland Injectable Anti-diabetic Drugs Market Volume (K Unit) Forecast, by Application 2019 & 2032
- Table 35: Nordics Injectable Anti-diabetic Drugs Market Revenue (Million) Forecast, by Application 2019 & 2032
- Table 36: Nordics Injectable Anti-diabetic Drugs Market Volume (K Unit) Forecast, by Application 2019 & 2032
- Table 37: Rest of Europe Injectable Anti-diabetic Drugs Market Revenue (Million) Forecast, by Application 2019 & 2032
- Table 38: Rest of Europe Injectable Anti-diabetic Drugs Market Volume (K Unit) Forecast, by Application 2019 & 2032
- Table 39: Global Injectable Anti-diabetic Drugs Market Revenue Million Forecast, by Country 2019 & 2032
- Table 40: Global Injectable Anti-diabetic Drugs Market Volume K Unit Forecast, by Country 2019 & 2032
- Table 41: China Injectable Anti-diabetic Drugs Market Revenue (Million) Forecast, by Application 2019 & 2032
- Table 42: China Injectable Anti-diabetic Drugs Market Volume (K Unit) Forecast, by Application 2019 & 2032
- Table 43: Japan Injectable Anti-diabetic Drugs Market Revenue (Million) Forecast, by Application 2019 & 2032
- Table 44: Japan Injectable Anti-diabetic Drugs Market Volume (K Unit) Forecast, by Application 2019 & 2032
- Table 45: India Injectable Anti-diabetic Drugs Market Revenue (Million) Forecast, by Application 2019 & 2032
- Table 46: India Injectable Anti-diabetic Drugs Market Volume (K Unit) Forecast, by Application 2019 & 2032
- Table 47: South Korea Injectable Anti-diabetic Drugs Market Revenue (Million) Forecast, by Application 2019 & 2032
- Table 48: South Korea Injectable Anti-diabetic Drugs Market Volume (K Unit) Forecast, by Application 2019 & 2032
- Table 49: Southeast Asia Injectable Anti-diabetic Drugs Market Revenue (Million) Forecast, by Application 2019 & 2032
- Table 50: Southeast Asia Injectable Anti-diabetic Drugs Market Volume (K Unit) Forecast, by Application 2019 & 2032
- Table 51: Australia Injectable Anti-diabetic Drugs Market Revenue (Million) Forecast, by Application 2019 & 2032
- Table 52: Australia Injectable Anti-diabetic Drugs Market Volume (K Unit) Forecast, by Application 2019 & 2032
- Table 53: Indonesia Injectable Anti-diabetic Drugs Market Revenue (Million) Forecast, by Application 2019 & 2032
- Table 54: Indonesia Injectable Anti-diabetic Drugs Market Volume (K Unit) Forecast, by Application 2019 & 2032
- Table 55: Phillipes Injectable Anti-diabetic Drugs Market Revenue (Million) Forecast, by Application 2019 & 2032
- Table 56: Phillipes Injectable Anti-diabetic Drugs Market Volume (K Unit) Forecast, by Application 2019 & 2032
- Table 57: Singapore Injectable Anti-diabetic Drugs Market Revenue (Million) Forecast, by Application 2019 & 2032
- Table 58: Singapore Injectable Anti-diabetic Drugs Market Volume (K Unit) Forecast, by Application 2019 & 2032
- Table 59: Thailandc Injectable Anti-diabetic Drugs Market Revenue (Million) Forecast, by Application 2019 & 2032
- Table 60: Thailandc Injectable Anti-diabetic Drugs Market Volume (K Unit) Forecast, by Application 2019 & 2032
- Table 61: Rest of Asia Pacific Injectable Anti-diabetic Drugs Market Revenue (Million) Forecast, by Application 2019 & 2032
- Table 62: Rest of Asia Pacific Injectable Anti-diabetic Drugs Market Volume (K Unit) Forecast, by Application 2019 & 2032
- Table 63: Global Injectable Anti-diabetic Drugs Market Revenue Million Forecast, by Country 2019 & 2032
- Table 64: Global Injectable Anti-diabetic Drugs Market Volume K Unit Forecast, by Country 2019 & 2032
- Table 65: Brazil Injectable Anti-diabetic Drugs Market Revenue (Million) Forecast, by Application 2019 & 2032
- Table 66: Brazil Injectable Anti-diabetic Drugs Market Volume (K Unit) Forecast, by Application 2019 & 2032
- Table 67: Argentina Injectable Anti-diabetic Drugs Market Revenue (Million) Forecast, by Application 2019 & 2032
- Table 68: Argentina Injectable Anti-diabetic Drugs Market Volume (K Unit) Forecast, by Application 2019 & 2032
- Table 69: Peru Injectable Anti-diabetic Drugs Market Revenue (Million) Forecast, by Application 2019 & 2032
- Table 70: Peru Injectable Anti-diabetic Drugs Market Volume (K Unit) Forecast, by Application 2019 & 2032
- Table 71: Chile Injectable Anti-diabetic Drugs Market Revenue (Million) Forecast, by Application 2019 & 2032
- Table 72: Chile Injectable Anti-diabetic Drugs Market Volume (K Unit) Forecast, by Application 2019 & 2032
- Table 73: Colombia Injectable Anti-diabetic Drugs Market Revenue (Million) Forecast, by Application 2019 & 2032
- Table 74: Colombia Injectable Anti-diabetic Drugs Market Volume (K Unit) Forecast, by Application 2019 & 2032
- Table 75: Ecuador Injectable Anti-diabetic Drugs Market Revenue (Million) Forecast, by Application 2019 & 2032
- Table 76: Ecuador Injectable Anti-diabetic Drugs Market Volume (K Unit) Forecast, by Application 2019 & 2032
- Table 77: Venezuela Injectable Anti-diabetic Drugs Market Revenue (Million) Forecast, by Application 2019 & 2032
- Table 78: Venezuela Injectable Anti-diabetic Drugs Market Volume (K Unit) Forecast, by Application 2019 & 2032
- Table 79: Rest of South America Injectable Anti-diabetic Drugs Market Revenue (Million) Forecast, by Application 2019 & 2032
- Table 80: Rest of South America Injectable Anti-diabetic Drugs Market Volume (K Unit) Forecast, by Application 2019 & 2032
- Table 81: Global Injectable Anti-diabetic Drugs Market Revenue Million Forecast, by Country 2019 & 2032
- Table 82: Global Injectable Anti-diabetic Drugs Market Volume K Unit Forecast, by Country 2019 & 2032
- Table 83: United States Injectable Anti-diabetic Drugs Market Revenue (Million) Forecast, by Application 2019 & 2032
- Table 84: United States Injectable Anti-diabetic Drugs Market Volume (K Unit) Forecast, by Application 2019 & 2032
- Table 85: Canada Injectable Anti-diabetic Drugs Market Revenue (Million) Forecast, by Application 2019 & 2032
- Table 86: Canada Injectable Anti-diabetic Drugs Market Volume (K Unit) Forecast, by Application 2019 & 2032
- Table 87: Mexico Injectable Anti-diabetic Drugs Market Revenue (Million) Forecast, by Application 2019 & 2032
- Table 88: Mexico Injectable Anti-diabetic Drugs Market Volume (K Unit) Forecast, by Application 2019 & 2032
- Table 89: Global Injectable Anti-diabetic Drugs Market Revenue Million Forecast, by Country 2019 & 2032
- Table 90: Global Injectable Anti-diabetic Drugs Market Volume K Unit Forecast, by Country 2019 & 2032
- Table 91: United Arab Emirates Injectable Anti-diabetic Drugs Market Revenue (Million) Forecast, by Application 2019 & 2032
- Table 92: United Arab Emirates Injectable Anti-diabetic Drugs Market Volume (K Unit) Forecast, by Application 2019 & 2032
- Table 93: Saudi Arabia Injectable Anti-diabetic Drugs Market Revenue (Million) Forecast, by Application 2019 & 2032
- Table 94: Saudi Arabia Injectable Anti-diabetic Drugs Market Volume (K Unit) Forecast, by Application 2019 & 2032
- Table 95: South Africa Injectable Anti-diabetic Drugs Market Revenue (Million) Forecast, by Application 2019 & 2032
- Table 96: South Africa Injectable Anti-diabetic Drugs Market Volume (K Unit) Forecast, by Application 2019 & 2032
- Table 97: Rest of Middle East and Africa Injectable Anti-diabetic Drugs Market Revenue (Million) Forecast, by Application 2019 & 2032
- Table 98: Rest of Middle East and Africa Injectable Anti-diabetic Drugs Market Volume (K Unit) Forecast, by Application 2019 & 2032
- Table 99: Global Injectable Anti-diabetic Drugs Market Revenue Million Forecast, by Insulin 2019 & 2032
- Table 100: Global Injectable Anti-diabetic Drugs Market Volume K Unit Forecast, by Insulin 2019 & 2032
- Table 101: Global Injectable Anti-diabetic Drugs Market Revenue Million Forecast, by Glucagon-like peptide-1 (GLP-1) agonists drugs 2019 & 2032
- Table 102: Global Injectable Anti-diabetic Drugs Market Volume K Unit Forecast, by Glucagon-like peptide-1 (GLP-1) agonists drugs 2019 & 2032
- Table 103: Global Injectable Anti-diabetic Drugs Market Revenue Million Forecast, by Country 2019 & 2032
- Table 104: Global Injectable Anti-diabetic Drugs Market Volume K Unit Forecast, by Country 2019 & 2032
- Table 105: United States Injectable Anti-diabetic Drugs Market Revenue (Million) Forecast, by Application 2019 & 2032
- Table 106: United States Injectable Anti-diabetic Drugs Market Volume (K Unit) Forecast, by Application 2019 & 2032
- Table 107: Canada Injectable Anti-diabetic Drugs Market Revenue (Million) Forecast, by Application 2019 & 2032
- Table 108: Canada Injectable Anti-diabetic Drugs Market Volume (K Unit) Forecast, by Application 2019 & 2032
- Table 109: Rest of North America Injectable Anti-diabetic Drugs Market Revenue (Million) Forecast, by Application 2019 & 2032
- Table 110: Rest of North America Injectable Anti-diabetic Drugs Market Volume (K Unit) Forecast, by Application 2019 & 2032
- Table 111: Global Injectable Anti-diabetic Drugs Market Revenue Million Forecast, by Insulin 2019 & 2032
- Table 112: Global Injectable Anti-diabetic Drugs Market Volume K Unit Forecast, by Insulin 2019 & 2032
- Table 113: Global Injectable Anti-diabetic Drugs Market Revenue Million Forecast, by Glucagon-like peptide-1 (GLP-1) agonists drugs 2019 & 2032
- Table 114: Global Injectable Anti-diabetic Drugs Market Volume K Unit Forecast, by Glucagon-like peptide-1 (GLP-1) agonists drugs 2019 & 2032
- Table 115: Global Injectable Anti-diabetic Drugs Market Revenue Million Forecast, by Country 2019 & 2032
- Table 116: Global Injectable Anti-diabetic Drugs Market Volume K Unit Forecast, by Country 2019 & 2032
- Table 117: Germany Injectable Anti-diabetic Drugs Market Revenue (Million) Forecast, by Application 2019 & 2032
- Table 118: Germany Injectable Anti-diabetic Drugs Market Volume (K Unit) Forecast, by Application 2019 & 2032
- Table 119: Spain Injectable Anti-diabetic Drugs Market Revenue (Million) Forecast, by Application 2019 & 2032
- Table 120: Spain Injectable Anti-diabetic Drugs Market Volume (K Unit) Forecast, by Application 2019 & 2032
- Table 121: Italy Injectable Anti-diabetic Drugs Market Revenue (Million) Forecast, by Application 2019 & 2032
- Table 122: Italy Injectable Anti-diabetic Drugs Market Volume (K Unit) Forecast, by Application 2019 & 2032
- Table 123: France Injectable Anti-diabetic Drugs Market Revenue (Million) Forecast, by Application 2019 & 2032
- Table 124: France Injectable Anti-diabetic Drugs Market Volume (K Unit) Forecast, by Application 2019 & 2032
- Table 125: United Kingdom Injectable Anti-diabetic Drugs Market Revenue (Million) Forecast, by Application 2019 & 2032
- Table 126: United Kingdom Injectable Anti-diabetic Drugs Market Volume (K Unit) Forecast, by Application 2019 & 2032
- Table 127: Russia Injectable Anti-diabetic Drugs Market Revenue (Million) Forecast, by Application 2019 & 2032
- Table 128: Russia Injectable Anti-diabetic Drugs Market Volume (K Unit) Forecast, by Application 2019 & 2032
- Table 129: Rest of Europe Injectable Anti-diabetic Drugs Market Revenue (Million) Forecast, by Application 2019 & 2032
- Table 130: Rest of Europe Injectable Anti-diabetic Drugs Market Volume (K Unit) Forecast, by Application 2019 & 2032
- Table 131: Global Injectable Anti-diabetic Drugs Market Revenue Million Forecast, by Insulin 2019 & 2032
- Table 132: Global Injectable Anti-diabetic Drugs Market Volume K Unit Forecast, by Insulin 2019 & 2032
- Table 133: Global Injectable Anti-diabetic Drugs Market Revenue Million Forecast, by Glucagon-like peptide-1 (GLP-1) agonists drugs 2019 & 2032
- Table 134: Global Injectable Anti-diabetic Drugs Market Volume K Unit Forecast, by Glucagon-like peptide-1 (GLP-1) agonists drugs 2019 & 2032
- Table 135: Global Injectable Anti-diabetic Drugs Market Revenue Million Forecast, by Country 2019 & 2032
- Table 136: Global Injectable Anti-diabetic Drugs Market Volume K Unit Forecast, by Country 2019 & 2032
- Table 137: Japan Injectable Anti-diabetic Drugs Market Revenue (Million) Forecast, by Application 2019 & 2032
- Table 138: Japan Injectable Anti-diabetic Drugs Market Volume (K Unit) Forecast, by Application 2019 & 2032
- Table 139: China Injectable Anti-diabetic Drugs Market Revenue (Million) Forecast, by Application 2019 & 2032
- Table 140: China Injectable Anti-diabetic Drugs Market Volume (K Unit) Forecast, by Application 2019 & 2032
- Table 141: Australia Injectable Anti-diabetic Drugs Market Revenue (Million) Forecast, by Application 2019 & 2032
- Table 142: Australia Injectable Anti-diabetic Drugs Market Volume (K Unit) Forecast, by Application 2019 & 2032
- Table 143: India Injectable Anti-diabetic Drugs Market Revenue (Million) Forecast, by Application 2019 & 2032
- Table 144: India Injectable Anti-diabetic Drugs Market Volume (K Unit) Forecast, by Application 2019 & 2032
- Table 145: South Korea Injectable Anti-diabetic Drugs Market Revenue (Million) Forecast, by Application 2019 & 2032
- Table 146: South Korea Injectable Anti-diabetic Drugs Market Volume (K Unit) Forecast, by Application 2019 & 2032
- Table 147: Malaysia Injectable Anti-diabetic Drugs Market Revenue (Million) Forecast, by Application 2019 & 2032
- Table 148: Malaysia Injectable Anti-diabetic Drugs Market Volume (K Unit) Forecast, by Application 2019 & 2032
- Table 149: Indonesia Injectable Anti-diabetic Drugs Market Revenue (Million) Forecast, by Application 2019 & 2032
- Table 150: Indonesia Injectable Anti-diabetic Drugs Market Volume (K Unit) Forecast, by Application 2019 & 2032
- Table 151: Thailand Injectable Anti-diabetic Drugs Market Revenue (Million) Forecast, by Application 2019 & 2032
- Table 152: Thailand Injectable Anti-diabetic Drugs Market Volume (K Unit) Forecast, by Application 2019 & 2032
- Table 153: Philippines Injectable Anti-diabetic Drugs Market Revenue (Million) Forecast, by Application 2019 & 2032
- Table 154: Philippines Injectable Anti-diabetic Drugs Market Volume (K Unit) Forecast, by Application 2019 & 2032
- Table 155: Vietnam Injectable Anti-diabetic Drugs Market Revenue (Million) Forecast, by Application 2019 & 2032
- Table 156: Vietnam Injectable Anti-diabetic Drugs Market Volume (K Unit) Forecast, by Application 2019 & 2032
- Table 157: Rest of Asia Pacific Injectable Anti-diabetic Drugs Market Revenue (Million) Forecast, by Application 2019 & 2032
- Table 158: Rest of Asia Pacific Injectable Anti-diabetic Drugs Market Volume (K Unit) Forecast, by Application 2019 & 2032
- Table 159: Global Injectable Anti-diabetic Drugs Market Revenue Million Forecast, by Insulin 2019 & 2032
- Table 160: Global Injectable Anti-diabetic Drugs Market Volume K Unit Forecast, by Insulin 2019 & 2032
- Table 161: Global Injectable Anti-diabetic Drugs Market Revenue Million Forecast, by Glucagon-like peptide-1 (GLP-1) agonists drugs 2019 & 2032
- Table 162: Global Injectable Anti-diabetic Drugs Market Volume K Unit Forecast, by Glucagon-like peptide-1 (GLP-1) agonists drugs 2019 & 2032
- Table 163: Global Injectable Anti-diabetic Drugs Market Revenue Million Forecast, by Country 2019 & 2032
- Table 164: Global Injectable Anti-diabetic Drugs Market Volume K Unit Forecast, by Country 2019 & 2032
- Table 165: Brazil Injectable Anti-diabetic Drugs Market Revenue (Million) Forecast, by Application 2019 & 2032
- Table 166: Brazil Injectable Anti-diabetic Drugs Market Volume (K Unit) Forecast, by Application 2019 & 2032
- Table 167: Mexico Injectable Anti-diabetic Drugs Market Revenue (Million) Forecast, by Application 2019 & 2032
- Table 168: Mexico Injectable Anti-diabetic Drugs Market Volume (K Unit) Forecast, by Application 2019 & 2032
- Table 169: Rest of Latin America Injectable Anti-diabetic Drugs Market Revenue (Million) Forecast, by Application 2019 & 2032
- Table 170: Rest of Latin America Injectable Anti-diabetic Drugs Market Volume (K Unit) Forecast, by Application 2019 & 2032
- Table 171: Global Injectable Anti-diabetic Drugs Market Revenue Million Forecast, by Insulin 2019 & 2032
- Table 172: Global Injectable Anti-diabetic Drugs Market Volume K Unit Forecast, by Insulin 2019 & 2032
- Table 173: Global Injectable Anti-diabetic Drugs Market Revenue Million Forecast, by Glucagon-like peptide-1 (GLP-1) agonists drugs 2019 & 2032
- Table 174: Global Injectable Anti-diabetic Drugs Market Volume K Unit Forecast, by Glucagon-like peptide-1 (GLP-1) agonists drugs 2019 & 2032
- Table 175: Global Injectable Anti-diabetic Drugs Market Revenue Million Forecast, by Country 2019 & 2032
- Table 176: Global Injectable Anti-diabetic Drugs Market Volume K Unit Forecast, by Country 2019 & 2032
- Table 177: South Africa Injectable Anti-diabetic Drugs Market Revenue (Million) Forecast, by Application 2019 & 2032
- Table 178: South Africa Injectable Anti-diabetic Drugs Market Volume (K Unit) Forecast, by Application 2019 & 2032
- Table 179: Saudi Arabia Injectable Anti-diabetic Drugs Market Revenue (Million) Forecast, by Application 2019 & 2032
- Table 180: Saudi Arabia Injectable Anti-diabetic Drugs Market Volume (K Unit) Forecast, by Application 2019 & 2032
- Table 181: Oman Injectable Anti-diabetic Drugs Market Revenue (Million) Forecast, by Application 2019 & 2032
- Table 182: Oman Injectable Anti-diabetic Drugs Market Volume (K Unit) Forecast, by Application 2019 & 2032
- Table 183: Egypt Injectable Anti-diabetic Drugs Market Revenue (Million) Forecast, by Application 2019 & 2032
- Table 184: Egypt Injectable Anti-diabetic Drugs Market Volume (K Unit) Forecast, by Application 2019 & 2032
- Table 185: Iran Injectable Anti-diabetic Drugs Market Revenue (Million) Forecast, by Application 2019 & 2032
- Table 186: Iran Injectable Anti-diabetic Drugs Market Volume (K Unit) Forecast, by Application 2019 & 2032
- Table 187: Rest of Middle East and Africa Injectable Anti-diabetic Drugs Market Revenue (Million) Forecast, by Application 2019 & 2032
- Table 188: Rest of Middle East and Africa Injectable Anti-diabetic Drugs Market Volume (K Unit) Forecast, by Application 2019 & 2032
Frequently Asked Questions
1. What is the projected Compound Annual Growth Rate (CAGR) of the Injectable Anti-diabetic Drugs Market?
The projected CAGR is approximately > 3.00%.
2. Which companies are prominent players in the Injectable Anti-diabetic Drugs Market?
Key companies in the market include Pfizer, Julphar, Biocon, Lilly, Novo Nordisk, Sanofi.
3. What are the main segments of the Injectable Anti-diabetic Drugs Market?
The market segments include Insulin, Glucagon-like peptide-1 (GLP-1) agonists drugs.
4. Can you provide details about the market size?
The market size is estimated to be USD 38.79 Million as of 2022.
5. What are some drivers contributing to market growth?
Rising R&D Focus on the Development of Biotechnology-engineered Anti-cancer Drugs; Rapid Growth in the Usage of Pre-filled Syringes for Biologics; Increased Outsourcing Activities Across Value Chain Expected to Boost Supply of Injectable Products.
6. What are the notable trends driving market growth?
Dulaglutide Segment Occupied the Highest Market Share in the Injectable Anti-diabetic Drugs Market in the current year.
7. Are there any restraints impacting market growth?
High Expenses Associated with Inventory Management; Availability of Alternate Drug Delivery Methods.
8. Can you provide examples of recent developments in the market?
March 2023: Novo Nordisk announced that the company will drop prices for vials and pens of NovoLog and other insulin brands by 75 percent beginning January 1, 2024, in the United States. The price for some other Novo Nordisk insulin brands will be lowered by 65 percent.
9. What pricing options are available for accessing the report?
Pricing options include single-user, multi-user, and enterprise licenses priced at USD 4750, USD 5250, and USD 8750 respectively.
10. Is the market size provided in terms of value or volume?
The market size is provided in terms of value, measured in Million and volume, measured in K Unit.
11. Are there any specific market keywords associated with the report?
Yes, the market keyword associated with the report is "Injectable Anti-diabetic Drugs Market," which aids in identifying and referencing the specific market segment covered.
12. How do I determine which pricing option suits my needs best?
The pricing options vary based on user requirements and access needs. Individual users may opt for single-user licenses, while businesses requiring broader access may choose multi-user or enterprise licenses for cost-effective access to the report.
13. Are there any additional resources or data provided in the Injectable Anti-diabetic Drugs Market report?
While the report offers comprehensive insights, it's advisable to review the specific contents or supplementary materials provided to ascertain if additional resources or data are available.
14. How can I stay updated on further developments or reports in the Injectable Anti-diabetic Drugs Market?
To stay informed about further developments, trends, and reports in the Injectable Anti-diabetic Drugs Market, consider subscribing to industry newsletters, following relevant companies and organizations, or regularly checking reputable industry news sources and publications.
Methodology
Step 1 - Identification of Relevant Samples Size from Population Database


Step 2 - Approaches for Defining Global Market Size (Value, Volume* & Price*)

Note*: In applicable scenarios
Step 3 - Data Sources
Primary Research
- Web Analytics
- Survey Reports
- Research Institute
- Latest Research Reports
- Opinion Leaders
Secondary Research
- Annual Reports
- White Paper
- Latest Press Release
- Industry Association
- Paid Database
- Investor Presentations

Step 4 - Data Triangulation
Involves using different sources of information in order to increase the validity of a study
These sources are likely to be stakeholders in a program - participants, other researchers, program staff, other community members, and so on.
Then we put all data in single framework & apply various statistical tools to find out the dynamic on the market.
During the analysis stage, feedback from the stakeholder groups would be compared to determine areas of agreement as well as areas of divergence


