
Key Insights
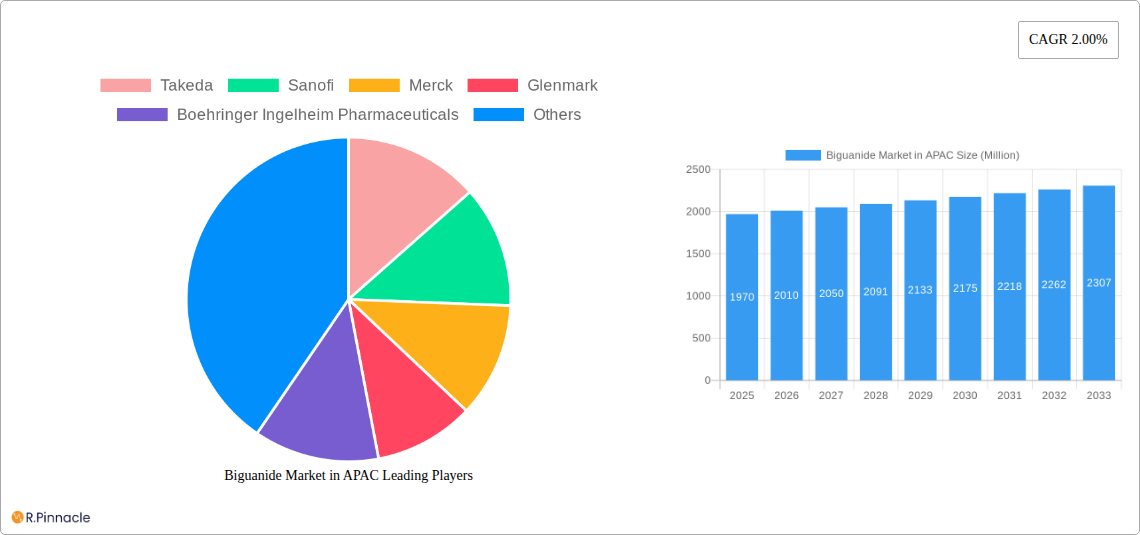
The Asia-Pacific (APAC) biguanide market, valued at $1.97 billion in 2025, is projected to experience steady growth, driven by the escalating prevalence of type 2 diabetes across the region. This growth is further fueled by increasing awareness of diabetes management, improved healthcare infrastructure in several APAC countries, and the rising affordability of generic biguanide medications. The market is segmented by drug formulation (immediate-release, extended-release, fixed-dose combinations), brand versus generic availability, specific applications (primarily type 2 diabetes), and dosage strengths (500mg, 850mg, 1000mg). Major players like Takeda, Sanofi, Merck, and Glenmark dominate the market, leveraging their established distribution networks and brand recognition. However, the increasing availability of cost-effective generic alternatives presents both opportunities and challenges for these companies. The market's growth is expected to be somewhat constrained by factors such as potential side effects associated with biguanide use, requiring careful patient monitoring and selection. Nevertheless, the overall positive outlook for the APAC biguanide market stems from the projected increase in type 2 diabetes cases and continued investment in diabetes care within the region.
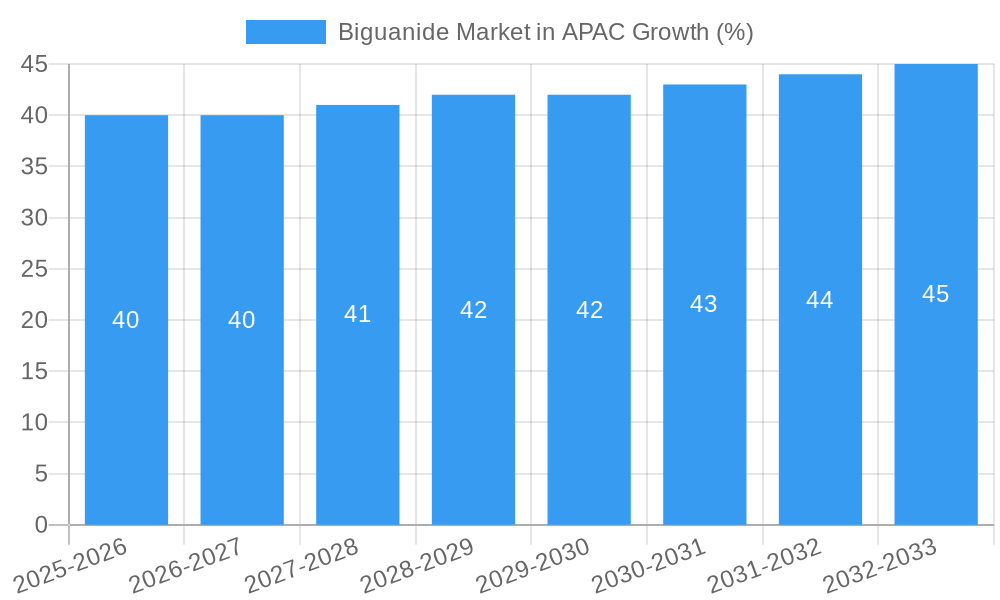
Given a 2.00% CAGR and a 2025 market size of $1.97 billion, we can project reasonable future growth. The expanding middle class in countries like India and China is a key factor contributing to increased healthcare spending and improved access to diabetes medications. While specific growth rates for individual segments (e.g., immediate-release vs. extended-release) are unavailable, the market is anticipated to see a gradual shift towards extended-release formulations due to improved compliance and reduced side effects. The rise of generic drugs will further influence pricing and market share dynamics. Competitive pressures will likely continue to increase, prompting companies to invest in research and development to maintain their market positions and explore innovative drug delivery systems. Regional variations within APAC will also affect market performance, with countries exhibiting higher diabetes prevalence potentially showcasing faster growth.
This in-depth report provides a comprehensive analysis of the Biguanide market in the Asia-Pacific (APAC) region, covering the period from 2019 to 2033. It offers actionable insights for industry professionals, investors, and strategic decision-makers seeking to navigate this dynamic market. The report leverages extensive market research and data analysis to offer a clear understanding of current market trends and future growth potential. The market is segmented by Type (immediate-release, extended-release, fixed-dose combination), Brand/Generic (branded, generic), Application (Type 2 diabetes), and Dosage (500mg, 850mg, 1000mg). Key players analyzed include Takeda, Sanofi, Merck, Glenmark, Boehringer Ingelheim Pharmaceuticals, GlaxoSmithKline, and Bristol-Myers Squibb. The report's base year is 2025, with an estimated year of 2025 and a forecast period spanning 2025-2033. The historical period covered is 2019-2024.
Biguanide Market in APAC Market Structure & Innovation Trends
This section analyzes the competitive landscape, innovation drivers, regulatory influences, and market dynamics within the APAC Biguanide market. The market is characterized by a mix of established multinational pharmaceutical companies and local players. Market concentration is moderate, with the top five companies holding an estimated xx% market share in 2025. Innovation is driven by the need for improved efficacy, safety, and patient convenience, leading to the development of novel formulations and delivery systems. Regulatory frameworks vary across APAC countries, impacting pricing and market access. Key substitute products include other anti-diabetic medications such as sulfonylureas and DPP-4 inhibitors. The end-user demographic primarily comprises individuals with type 2 diabetes, a population experiencing significant growth in the APAC region. M&A activity in the pharmaceutical sector is influencing the market structure, with deal values in the diabetes segment reaching xx Million in 2024.
- Market Share: Top 5 companies hold an estimated xx% of the market.
- M&A Deal Values: xx Million in 2024 (projected).
- Key Innovation Drivers: Improved efficacy, patient compliance, and novel delivery systems.
- Regulatory Landscape: Varying regulations across APAC countries.
Biguanide Market in APAC Market Dynamics & Trends
The APAC Biguanide market is experiencing substantial growth, driven by several key factors. The rising prevalence of type 2 diabetes, fueled by changing lifestyles and an aging population, is a primary driver. Technological advancements in drug delivery and formulation are enhancing efficacy and patient convenience, further boosting market expansion. Consumer preferences are shifting towards branded drugs with proven efficacy and safety profiles. Competitive dynamics are intense, with companies vying for market share through product innovation, strategic partnerships, and aggressive marketing. The Compound Annual Growth Rate (CAGR) is projected at xx% during the forecast period (2025-2033), with market penetration expected to reach xx% by 2033.
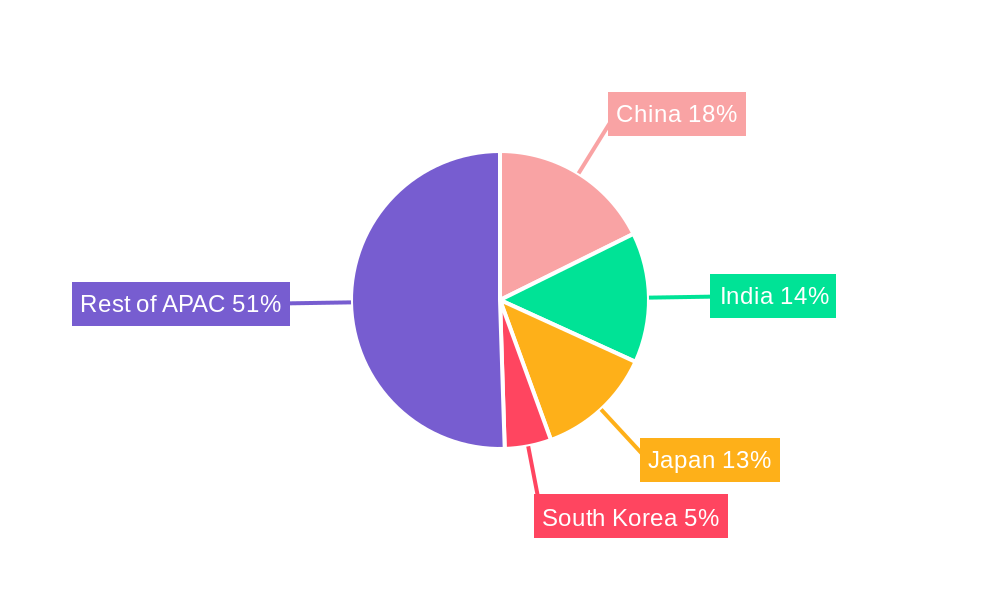
Dominant Regions & Segments in Biguanide Market in APAC
This section identifies the leading regions, countries, and segments within the APAC Biguanide market. China and India are projected to be the largest markets due to their vast populations and high prevalence of diabetes.
- Key Drivers in Dominant Regions:
- China: Growing middle class, increasing healthcare spending, and supportive government policies.
- India: Large diabetic population, increasing awareness, and rising affordability of medications.
- Dominant Segments:
- Type: Extended-release formulations are expected to dominate due to improved compliance and efficacy.
- Brand/Generic: Branded products currently hold a larger market share, but generics are expected to grow significantly.
- Application: Type 2 diabetes is the primary application, representing almost the entire market.
- Dosage: 500mg and 850mg dosages are currently the most widely used.
The detailed analysis provides a granular view of each segment's market size, growth rate, and competitive dynamics.
Biguanide Market in APAC Product Innovations
Recent product innovations focus on enhancing convenience and improving patient compliance. This includes the development of extended-release formulations and fixed-dose combinations, simplifying treatment regimens. The market is witnessing the introduction of new delivery systems, aiming for better absorption and reduced side effects. These innovations are crucial for addressing unmet needs and gaining a competitive edge in a crowded market.
Report Scope & Segmentation Analysis
The report comprehensively segments the APAC Biguanide market based on type (immediate-release, extended-release, fixed-dose combination), brand/generic (branded, generic), application (Type 2 diabetes), and dosage (500mg, 850mg, 1000mg). Each segment's growth projections, market sizes (in Millions), and competitive landscape are detailed within the report.
Key Drivers of Biguanide Market in APAC Growth
Several factors contribute to the growth of the APAC Biguanide market. These include: the rising prevalence of type 2 diabetes, increased healthcare spending, the growing adoption of improved treatment options, and favorable government initiatives promoting better diabetes management. Technological advancements in drug delivery systems are also driving market expansion.
Challenges in the Biguanide Market in APAC Sector
The APAC Biguanide market faces several challenges, including the stringent regulatory environment in some countries, the price sensitivity of consumers, and potential supply chain disruptions. Generic competition and the emergence of newer alternative therapies also pose significant challenges to the market's growth. The impact of these factors is quantified within the report.
Emerging Opportunities in Biguanide Market in APAC
Emerging opportunities include the development of novel delivery systems, the expansion into underserved markets, and the exploration of new fixed-dose combinations with other anti-diabetic agents. These opportunities can be leveraged by companies to achieve sustainable growth in the APAC Biguanide market.
Leading Players in the Biguanide Market in APAC Market
- Takeda Pharmaceutical Company Limited
- Sanofi
- Merck & Co., Inc.
- Glenmark Pharmaceuticals Ltd.
- Boehringer Ingelheim Pharmaceuticals, Inc.
- GlaxoSmithKline plc
- Bristol Myers Squibb Company
Key Developments in Biguanide Market in APAC Industry
- February 2023: Zydus Lifesciences Limited received tentative approval from the USFDA for Invokamet tablets (canagliflozin and metformin hydrochloride combination), impacting the fixed-dose combination segment.
- July 2022: The NPPA in India fixed retail prices for various drug formulations, including metformin, influencing market pricing and affordability.
Future Outlook for Biguanide Market in APAC Market
The APAC Biguanide market is poised for continued growth, driven by the persistent rise in diabetes prevalence and ongoing innovation in drug delivery and formulation. Companies that invest in R&D, focus on improving patient compliance, and strategically navigate the regulatory landscape are expected to thrive in this dynamic market. The report provides strategic recommendations to leverage these opportunities and mitigate potential risks.
Biguanide Market in APAC Segmentation
-
1. Type
- 1.1. Immediate-release
- 1.2. Extended-release
- 1.3. Fixed-dose combination
-
2. Dosage
- 2.1. 500mg
- 2.2. 850mg
- 2.3. 1000mg
-
3. Brand/Generic
- 3.1. Branded
- 3.2. Generic
-
4. Application
- 4.1. Type 2 diabetes
Biguanide Market in APAC Segmentation By Geography
- 1. Japan
- 2. South Korea
- 3. China
- 4. India
- 5. Australia
- 6. Vietnam
- 7. Malaysia
- 8. Indonesia
- 9. Philippines
- 10. Thailand
- 11. Rest of Asia Pacific
Biguanide Market in APAC REPORT HIGHLIGHTS
| Aspects | Details |
|---|---|
| Study Period | 2019-2033 |
| Base Year | 2024 |
| Estimated Year | 2025 |
| Forecast Period | 2025-2033 |
| Historical Period | 2019-2024 |
| Growth Rate | CAGR of 2.00% from 2019-2033 |
| Segmentation |
|
Table of Contents
- 1. Introduction
- 1.1. Research Scope
- 1.2. Market Segmentation
- 1.3. Research Methodology
- 1.4. Definitions and Assumptions
- 2. Executive Summary
- 2.1. Introduction
- 3. Market Dynamics
- 3.1. Introduction
- 3.2. Market Drivers
- 3.2.1. Advancement in the Technology of Chromatography Instruments; Significance of Chromatography Based Studies in Drug Approval
- 3.3. Market Restrains
- 3.3.1. Rising Price of Equipment
- 3.4. Market Trends
- 3.4.1. Rising diabetes prevalence
- 4. Market Factor Analysis
- 4.1. Porters Five Forces
- 4.2. Supply/Value Chain
- 4.3. PESTEL analysis
- 4.4. Market Entropy
- 4.5. Patent/Trademark Analysis
- 5. Global Biguanide Market in APAC Analysis, Insights and Forecast, 2019-2031
- 5.1. Market Analysis, Insights and Forecast - by Type
- 5.1.1. Immediate-release
- 5.1.2. Extended-release
- 5.1.3. Fixed-dose combination
- 5.2. Market Analysis, Insights and Forecast - by Dosage
- 5.2.1. 500mg
- 5.2.2. 850mg
- 5.2.3. 1000mg
- 5.3. Market Analysis, Insights and Forecast - by Brand/Generic
- 5.3.1. Branded
- 5.3.2. Generic
- 5.4. Market Analysis, Insights and Forecast - by Application
- 5.4.1. Type 2 diabetes
- 5.5. Market Analysis, Insights and Forecast - by Region
- 5.5.1. Japan
- 5.5.2. South Korea
- 5.5.3. China
- 5.5.4. India
- 5.5.5. Australia
- 5.5.6. Vietnam
- 5.5.7. Malaysia
- 5.5.8. Indonesia
- 5.5.9. Philippines
- 5.5.10. Thailand
- 5.5.11. Rest of Asia Pacific
- 5.1. Market Analysis, Insights and Forecast - by Type
- 6. Japan Biguanide Market in APAC Analysis, Insights and Forecast, 2019-2031
- 6.1. Market Analysis, Insights and Forecast - by Type
- 6.1.1. Immediate-release
- 6.1.2. Extended-release
- 6.1.3. Fixed-dose combination
- 6.2. Market Analysis, Insights and Forecast - by Dosage
- 6.2.1. 500mg
- 6.2.2. 850mg
- 6.2.3. 1000mg
- 6.3. Market Analysis, Insights and Forecast - by Brand/Generic
- 6.3.1. Branded
- 6.3.2. Generic
- 6.4. Market Analysis, Insights and Forecast - by Application
- 6.4.1. Type 2 diabetes
- 6.1. Market Analysis, Insights and Forecast - by Type
- 7. South Korea Biguanide Market in APAC Analysis, Insights and Forecast, 2019-2031
- 7.1. Market Analysis, Insights and Forecast - by Type
- 7.1.1. Immediate-release
- 7.1.2. Extended-release
- 7.1.3. Fixed-dose combination
- 7.2. Market Analysis, Insights and Forecast - by Dosage
- 7.2.1. 500mg
- 7.2.2. 850mg
- 7.2.3. 1000mg
- 7.3. Market Analysis, Insights and Forecast - by Brand/Generic
- 7.3.1. Branded
- 7.3.2. Generic
- 7.4. Market Analysis, Insights and Forecast - by Application
- 7.4.1. Type 2 diabetes
- 7.1. Market Analysis, Insights and Forecast - by Type
- 8. China Biguanide Market in APAC Analysis, Insights and Forecast, 2019-2031
- 8.1. Market Analysis, Insights and Forecast - by Type
- 8.1.1. Immediate-release
- 8.1.2. Extended-release
- 8.1.3. Fixed-dose combination
- 8.2. Market Analysis, Insights and Forecast - by Dosage
- 8.2.1. 500mg
- 8.2.2. 850mg
- 8.2.3. 1000mg
- 8.3. Market Analysis, Insights and Forecast - by Brand/Generic
- 8.3.1. Branded
- 8.3.2. Generic
- 8.4. Market Analysis, Insights and Forecast - by Application
- 8.4.1. Type 2 diabetes
- 8.1. Market Analysis, Insights and Forecast - by Type
- 9. India Biguanide Market in APAC Analysis, Insights and Forecast, 2019-2031
- 9.1. Market Analysis, Insights and Forecast - by Type
- 9.1.1. Immediate-release
- 9.1.2. Extended-release
- 9.1.3. Fixed-dose combination
- 9.2. Market Analysis, Insights and Forecast - by Dosage
- 9.2.1. 500mg
- 9.2.2. 850mg
- 9.2.3. 1000mg
- 9.3. Market Analysis, Insights and Forecast - by Brand/Generic
- 9.3.1. Branded
- 9.3.2. Generic
- 9.4. Market Analysis, Insights and Forecast - by Application
- 9.4.1. Type 2 diabetes
- 9.1. Market Analysis, Insights and Forecast - by Type
- 10. Australia Biguanide Market in APAC Analysis, Insights and Forecast, 2019-2031
- 10.1. Market Analysis, Insights and Forecast - by Type
- 10.1.1. Immediate-release
- 10.1.2. Extended-release
- 10.1.3. Fixed-dose combination
- 10.2. Market Analysis, Insights and Forecast - by Dosage
- 10.2.1. 500mg
- 10.2.2. 850mg
- 10.2.3. 1000mg
- 10.3. Market Analysis, Insights and Forecast - by Brand/Generic
- 10.3.1. Branded
- 10.3.2. Generic
- 10.4. Market Analysis, Insights and Forecast - by Application
- 10.4.1. Type 2 diabetes
- 10.1. Market Analysis, Insights and Forecast - by Type
- 11. Vietnam Biguanide Market in APAC Analysis, Insights and Forecast, 2019-2031
- 11.1. Market Analysis, Insights and Forecast - by Type
- 11.1.1. Immediate-release
- 11.1.2. Extended-release
- 11.1.3. Fixed-dose combination
- 11.2. Market Analysis, Insights and Forecast - by Dosage
- 11.2.1. 500mg
- 11.2.2. 850mg
- 11.2.3. 1000mg
- 11.3. Market Analysis, Insights and Forecast - by Brand/Generic
- 11.3.1. Branded
- 11.3.2. Generic
- 11.4. Market Analysis, Insights and Forecast - by Application
- 11.4.1. Type 2 diabetes
- 11.1. Market Analysis, Insights and Forecast - by Type
- 12. Malaysia Biguanide Market in APAC Analysis, Insights and Forecast, 2019-2031
- 12.1. Market Analysis, Insights and Forecast - by Type
- 12.1.1. Immediate-release
- 12.1.2. Extended-release
- 12.1.3. Fixed-dose combination
- 12.2. Market Analysis, Insights and Forecast - by Dosage
- 12.2.1. 500mg
- 12.2.2. 850mg
- 12.2.3. 1000mg
- 12.3. Market Analysis, Insights and Forecast - by Brand/Generic
- 12.3.1. Branded
- 12.3.2. Generic
- 12.4. Market Analysis, Insights and Forecast - by Application
- 12.4.1. Type 2 diabetes
- 12.1. Market Analysis, Insights and Forecast - by Type
- 13. Indonesia Biguanide Market in APAC Analysis, Insights and Forecast, 2019-2031
- 13.1. Market Analysis, Insights and Forecast - by Type
- 13.1.1. Immediate-release
- 13.1.2. Extended-release
- 13.1.3. Fixed-dose combination
- 13.2. Market Analysis, Insights and Forecast - by Dosage
- 13.2.1. 500mg
- 13.2.2. 850mg
- 13.2.3. 1000mg
- 13.3. Market Analysis, Insights and Forecast - by Brand/Generic
- 13.3.1. Branded
- 13.3.2. Generic
- 13.4. Market Analysis, Insights and Forecast - by Application
- 13.4.1. Type 2 diabetes
- 13.1. Market Analysis, Insights and Forecast - by Type
- 14. Philippines Biguanide Market in APAC Analysis, Insights and Forecast, 2019-2031
- 14.1. Market Analysis, Insights and Forecast - by Type
- 14.1.1. Immediate-release
- 14.1.2. Extended-release
- 14.1.3. Fixed-dose combination
- 14.2. Market Analysis, Insights and Forecast - by Dosage
- 14.2.1. 500mg
- 14.2.2. 850mg
- 14.2.3. 1000mg
- 14.3. Market Analysis, Insights and Forecast - by Brand/Generic
- 14.3.1. Branded
- 14.3.2. Generic
- 14.4. Market Analysis, Insights and Forecast - by Application
- 14.4.1. Type 2 diabetes
- 14.1. Market Analysis, Insights and Forecast - by Type
- 15. Thailand Biguanide Market in APAC Analysis, Insights and Forecast, 2019-2031
- 15.1. Market Analysis, Insights and Forecast - by Type
- 15.1.1. Immediate-release
- 15.1.2. Extended-release
- 15.1.3. Fixed-dose combination
- 15.2. Market Analysis, Insights and Forecast - by Dosage
- 15.2.1. 500mg
- 15.2.2. 850mg
- 15.2.3. 1000mg
- 15.3. Market Analysis, Insights and Forecast - by Brand/Generic
- 15.3.1. Branded
- 15.3.2. Generic
- 15.4. Market Analysis, Insights and Forecast - by Application
- 15.4.1. Type 2 diabetes
- 15.1. Market Analysis, Insights and Forecast - by Type
- 16. Rest of Asia Pacific Biguanide Market in APAC Analysis, Insights and Forecast, 2019-2031
- 16.1. Market Analysis, Insights and Forecast - by Type
- 16.1.1. Immediate-release
- 16.1.2. Extended-release
- 16.1.3. Fixed-dose combination
- 16.2. Market Analysis, Insights and Forecast - by Dosage
- 16.2.1. 500mg
- 16.2.2. 850mg
- 16.2.3. 1000mg
- 16.3. Market Analysis, Insights and Forecast - by Brand/Generic
- 16.3.1. Branded
- 16.3.2. Generic
- 16.4. Market Analysis, Insights and Forecast - by Application
- 16.4.1. Type 2 diabetes
- 16.1. Market Analysis, Insights and Forecast - by Type
- 17. China Biguanide Market in APAC Analysis, Insights and Forecast, 2019-2031
- 18. Japan Biguanide Market in APAC Analysis, Insights and Forecast, 2019-2031
- 19. India Biguanide Market in APAC Analysis, Insights and Forecast, 2019-2031
- 20. South Korea Biguanide Market in APAC Analysis, Insights and Forecast, 2019-2031
- 21. Southeast Asia Biguanide Market in APAC Analysis, Insights and Forecast, 2019-2031
- 22. Australia Biguanide Market in APAC Analysis, Insights and Forecast, 2019-2031
- 23. Indonesia Biguanide Market in APAC Analysis, Insights and Forecast, 2019-2031
- 24. Phillipes Biguanide Market in APAC Analysis, Insights and Forecast, 2019-2031
- 25. Singapore Biguanide Market in APAC Analysis, Insights and Forecast, 2019-2031
- 26. Thailandc Biguanide Market in APAC Analysis, Insights and Forecast, 2019-2031
- 27. Rest of Asia Pacific Biguanide Market in APAC Analysis, Insights and Forecast, 2019-2031
- 28. Competitive Analysis
- 28.1. Global Market Share Analysis 2024
- 28.2. Company Profiles
- 28.2.1 Takeda
- 28.2.1.1. Overview
- 28.2.1.2. Products
- 28.2.1.3. SWOT Analysis
- 28.2.1.4. Recent Developments
- 28.2.1.5. Financials (Based on Availability)
- 28.2.2 Sanofi
- 28.2.2.1. Overview
- 28.2.2.2. Products
- 28.2.2.3. SWOT Analysis
- 28.2.2.4. Recent Developments
- 28.2.2.5. Financials (Based on Availability)
- 28.2.3 Merck
- 28.2.3.1. Overview
- 28.2.3.2. Products
- 28.2.3.3. SWOT Analysis
- 28.2.3.4. Recent Developments
- 28.2.3.5. Financials (Based on Availability)
- 28.2.4 Glenmark
- 28.2.4.1. Overview
- 28.2.4.2. Products
- 28.2.4.3. SWOT Analysis
- 28.2.4.4. Recent Developments
- 28.2.4.5. Financials (Based on Availability)
- 28.2.5 Boehringer Ingelheim Pharmaceuticals
- 28.2.5.1. Overview
- 28.2.5.2. Products
- 28.2.5.3. SWOT Analysis
- 28.2.5.4. Recent Developments
- 28.2.5.5. Financials (Based on Availability)
- 28.2.6 GlaxoSmithKline
- 28.2.6.1. Overview
- 28.2.6.2. Products
- 28.2.6.3. SWOT Analysis
- 28.2.6.4. Recent Developments
- 28.2.6.5. Financials (Based on Availability)
- 28.2.7 Bristol-Myers Squibb
- 28.2.7.1. Overview
- 28.2.7.2. Products
- 28.2.7.3. SWOT Analysis
- 28.2.7.4. Recent Developments
- 28.2.7.5. Financials (Based on Availability)
- 28.2.1 Takeda
List of Figures
- Figure 1: Global Biguanide Market in APAC Revenue Breakdown (Million, %) by Region 2024 & 2032
- Figure 2: Global Biguanide Market in APAC Volume Breakdown (K Unit, %) by Region 2024 & 2032
- Figure 3: Asia Pacific Biguanide Market in APAC Revenue (Million), by Country 2024 & 2032
- Figure 4: Asia Pacific Biguanide Market in APAC Volume (K Unit), by Country 2024 & 2032
- Figure 5: Asia Pacific Biguanide Market in APAC Revenue Share (%), by Country 2024 & 2032
- Figure 6: Asia Pacific Biguanide Market in APAC Volume Share (%), by Country 2024 & 2032
- Figure 7: Japan Biguanide Market in APAC Revenue (Million), by Type 2024 & 2032
- Figure 8: Japan Biguanide Market in APAC Volume (K Unit), by Type 2024 & 2032
- Figure 9: Japan Biguanide Market in APAC Revenue Share (%), by Type 2024 & 2032
- Figure 10: Japan Biguanide Market in APAC Volume Share (%), by Type 2024 & 2032
- Figure 11: Japan Biguanide Market in APAC Revenue (Million), by Dosage 2024 & 2032
- Figure 12: Japan Biguanide Market in APAC Volume (K Unit), by Dosage 2024 & 2032
- Figure 13: Japan Biguanide Market in APAC Revenue Share (%), by Dosage 2024 & 2032
- Figure 14: Japan Biguanide Market in APAC Volume Share (%), by Dosage 2024 & 2032
- Figure 15: Japan Biguanide Market in APAC Revenue (Million), by Brand/Generic 2024 & 2032
- Figure 16: Japan Biguanide Market in APAC Volume (K Unit), by Brand/Generic 2024 & 2032
- Figure 17: Japan Biguanide Market in APAC Revenue Share (%), by Brand/Generic 2024 & 2032
- Figure 18: Japan Biguanide Market in APAC Volume Share (%), by Brand/Generic 2024 & 2032
- Figure 19: Japan Biguanide Market in APAC Revenue (Million), by Application 2024 & 2032
- Figure 20: Japan Biguanide Market in APAC Volume (K Unit), by Application 2024 & 2032
- Figure 21: Japan Biguanide Market in APAC Revenue Share (%), by Application 2024 & 2032
- Figure 22: Japan Biguanide Market in APAC Volume Share (%), by Application 2024 & 2032
- Figure 23: Japan Biguanide Market in APAC Revenue (Million), by Country 2024 & 2032
- Figure 24: Japan Biguanide Market in APAC Volume (K Unit), by Country 2024 & 2032
- Figure 25: Japan Biguanide Market in APAC Revenue Share (%), by Country 2024 & 2032
- Figure 26: Japan Biguanide Market in APAC Volume Share (%), by Country 2024 & 2032
- Figure 27: South Korea Biguanide Market in APAC Revenue (Million), by Type 2024 & 2032
- Figure 28: South Korea Biguanide Market in APAC Volume (K Unit), by Type 2024 & 2032
- Figure 29: South Korea Biguanide Market in APAC Revenue Share (%), by Type 2024 & 2032
- Figure 30: South Korea Biguanide Market in APAC Volume Share (%), by Type 2024 & 2032
- Figure 31: South Korea Biguanide Market in APAC Revenue (Million), by Dosage 2024 & 2032
- Figure 32: South Korea Biguanide Market in APAC Volume (K Unit), by Dosage 2024 & 2032
- Figure 33: South Korea Biguanide Market in APAC Revenue Share (%), by Dosage 2024 & 2032
- Figure 34: South Korea Biguanide Market in APAC Volume Share (%), by Dosage 2024 & 2032
- Figure 35: South Korea Biguanide Market in APAC Revenue (Million), by Brand/Generic 2024 & 2032
- Figure 36: South Korea Biguanide Market in APAC Volume (K Unit), by Brand/Generic 2024 & 2032
- Figure 37: South Korea Biguanide Market in APAC Revenue Share (%), by Brand/Generic 2024 & 2032
- Figure 38: South Korea Biguanide Market in APAC Volume Share (%), by Brand/Generic 2024 & 2032
- Figure 39: South Korea Biguanide Market in APAC Revenue (Million), by Application 2024 & 2032
- Figure 40: South Korea Biguanide Market in APAC Volume (K Unit), by Application 2024 & 2032
- Figure 41: South Korea Biguanide Market in APAC Revenue Share (%), by Application 2024 & 2032
- Figure 42: South Korea Biguanide Market in APAC Volume Share (%), by Application 2024 & 2032
- Figure 43: South Korea Biguanide Market in APAC Revenue (Million), by Country 2024 & 2032
- Figure 44: South Korea Biguanide Market in APAC Volume (K Unit), by Country 2024 & 2032
- Figure 45: South Korea Biguanide Market in APAC Revenue Share (%), by Country 2024 & 2032
- Figure 46: South Korea Biguanide Market in APAC Volume Share (%), by Country 2024 & 2032
- Figure 47: China Biguanide Market in APAC Revenue (Million), by Type 2024 & 2032
- Figure 48: China Biguanide Market in APAC Volume (K Unit), by Type 2024 & 2032
- Figure 49: China Biguanide Market in APAC Revenue Share (%), by Type 2024 & 2032
- Figure 50: China Biguanide Market in APAC Volume Share (%), by Type 2024 & 2032
- Figure 51: China Biguanide Market in APAC Revenue (Million), by Dosage 2024 & 2032
- Figure 52: China Biguanide Market in APAC Volume (K Unit), by Dosage 2024 & 2032
- Figure 53: China Biguanide Market in APAC Revenue Share (%), by Dosage 2024 & 2032
- Figure 54: China Biguanide Market in APAC Volume Share (%), by Dosage 2024 & 2032
- Figure 55: China Biguanide Market in APAC Revenue (Million), by Brand/Generic 2024 & 2032
- Figure 56: China Biguanide Market in APAC Volume (K Unit), by Brand/Generic 2024 & 2032
- Figure 57: China Biguanide Market in APAC Revenue Share (%), by Brand/Generic 2024 & 2032
- Figure 58: China Biguanide Market in APAC Volume Share (%), by Brand/Generic 2024 & 2032
- Figure 59: China Biguanide Market in APAC Revenue (Million), by Application 2024 & 2032
- Figure 60: China Biguanide Market in APAC Volume (K Unit), by Application 2024 & 2032
- Figure 61: China Biguanide Market in APAC Revenue Share (%), by Application 2024 & 2032
- Figure 62: China Biguanide Market in APAC Volume Share (%), by Application 2024 & 2032
- Figure 63: China Biguanide Market in APAC Revenue (Million), by Country 2024 & 2032
- Figure 64: China Biguanide Market in APAC Volume (K Unit), by Country 2024 & 2032
- Figure 65: China Biguanide Market in APAC Revenue Share (%), by Country 2024 & 2032
- Figure 66: China Biguanide Market in APAC Volume Share (%), by Country 2024 & 2032
- Figure 67: India Biguanide Market in APAC Revenue (Million), by Type 2024 & 2032
- Figure 68: India Biguanide Market in APAC Volume (K Unit), by Type 2024 & 2032
- Figure 69: India Biguanide Market in APAC Revenue Share (%), by Type 2024 & 2032
- Figure 70: India Biguanide Market in APAC Volume Share (%), by Type 2024 & 2032
- Figure 71: India Biguanide Market in APAC Revenue (Million), by Dosage 2024 & 2032
- Figure 72: India Biguanide Market in APAC Volume (K Unit), by Dosage 2024 & 2032
- Figure 73: India Biguanide Market in APAC Revenue Share (%), by Dosage 2024 & 2032
- Figure 74: India Biguanide Market in APAC Volume Share (%), by Dosage 2024 & 2032
- Figure 75: India Biguanide Market in APAC Revenue (Million), by Brand/Generic 2024 & 2032
- Figure 76: India Biguanide Market in APAC Volume (K Unit), by Brand/Generic 2024 & 2032
- Figure 77: India Biguanide Market in APAC Revenue Share (%), by Brand/Generic 2024 & 2032
- Figure 78: India Biguanide Market in APAC Volume Share (%), by Brand/Generic 2024 & 2032
- Figure 79: India Biguanide Market in APAC Revenue (Million), by Application 2024 & 2032
- Figure 80: India Biguanide Market in APAC Volume (K Unit), by Application 2024 & 2032
- Figure 81: India Biguanide Market in APAC Revenue Share (%), by Application 2024 & 2032
- Figure 82: India Biguanide Market in APAC Volume Share (%), by Application 2024 & 2032
- Figure 83: India Biguanide Market in APAC Revenue (Million), by Country 2024 & 2032
- Figure 84: India Biguanide Market in APAC Volume (K Unit), by Country 2024 & 2032
- Figure 85: India Biguanide Market in APAC Revenue Share (%), by Country 2024 & 2032
- Figure 86: India Biguanide Market in APAC Volume Share (%), by Country 2024 & 2032
- Figure 87: Australia Biguanide Market in APAC Revenue (Million), by Type 2024 & 2032
- Figure 88: Australia Biguanide Market in APAC Volume (K Unit), by Type 2024 & 2032
- Figure 89: Australia Biguanide Market in APAC Revenue Share (%), by Type 2024 & 2032
- Figure 90: Australia Biguanide Market in APAC Volume Share (%), by Type 2024 & 2032
- Figure 91: Australia Biguanide Market in APAC Revenue (Million), by Dosage 2024 & 2032
- Figure 92: Australia Biguanide Market in APAC Volume (K Unit), by Dosage 2024 & 2032
- Figure 93: Australia Biguanide Market in APAC Revenue Share (%), by Dosage 2024 & 2032
- Figure 94: Australia Biguanide Market in APAC Volume Share (%), by Dosage 2024 & 2032
- Figure 95: Australia Biguanide Market in APAC Revenue (Million), by Brand/Generic 2024 & 2032
- Figure 96: Australia Biguanide Market in APAC Volume (K Unit), by Brand/Generic 2024 & 2032
- Figure 97: Australia Biguanide Market in APAC Revenue Share (%), by Brand/Generic 2024 & 2032
- Figure 98: Australia Biguanide Market in APAC Volume Share (%), by Brand/Generic 2024 & 2032
- Figure 99: Australia Biguanide Market in APAC Revenue (Million), by Application 2024 & 2032
- Figure 100: Australia Biguanide Market in APAC Volume (K Unit), by Application 2024 & 2032
- Figure 101: Australia Biguanide Market in APAC Revenue Share (%), by Application 2024 & 2032
- Figure 102: Australia Biguanide Market in APAC Volume Share (%), by Application 2024 & 2032
- Figure 103: Australia Biguanide Market in APAC Revenue (Million), by Country 2024 & 2032
- Figure 104: Australia Biguanide Market in APAC Volume (K Unit), by Country 2024 & 2032
- Figure 105: Australia Biguanide Market in APAC Revenue Share (%), by Country 2024 & 2032
- Figure 106: Australia Biguanide Market in APAC Volume Share (%), by Country 2024 & 2032
- Figure 107: Vietnam Biguanide Market in APAC Revenue (Million), by Type 2024 & 2032
- Figure 108: Vietnam Biguanide Market in APAC Volume (K Unit), by Type 2024 & 2032
- Figure 109: Vietnam Biguanide Market in APAC Revenue Share (%), by Type 2024 & 2032
- Figure 110: Vietnam Biguanide Market in APAC Volume Share (%), by Type 2024 & 2032
- Figure 111: Vietnam Biguanide Market in APAC Revenue (Million), by Dosage 2024 & 2032
- Figure 112: Vietnam Biguanide Market in APAC Volume (K Unit), by Dosage 2024 & 2032
- Figure 113: Vietnam Biguanide Market in APAC Revenue Share (%), by Dosage 2024 & 2032
- Figure 114: Vietnam Biguanide Market in APAC Volume Share (%), by Dosage 2024 & 2032
- Figure 115: Vietnam Biguanide Market in APAC Revenue (Million), by Brand/Generic 2024 & 2032
- Figure 116: Vietnam Biguanide Market in APAC Volume (K Unit), by Brand/Generic 2024 & 2032
- Figure 117: Vietnam Biguanide Market in APAC Revenue Share (%), by Brand/Generic 2024 & 2032
- Figure 118: Vietnam Biguanide Market in APAC Volume Share (%), by Brand/Generic 2024 & 2032
- Figure 119: Vietnam Biguanide Market in APAC Revenue (Million), by Application 2024 & 2032
- Figure 120: Vietnam Biguanide Market in APAC Volume (K Unit), by Application 2024 & 2032
- Figure 121: Vietnam Biguanide Market in APAC Revenue Share (%), by Application 2024 & 2032
- Figure 122: Vietnam Biguanide Market in APAC Volume Share (%), by Application 2024 & 2032
- Figure 123: Vietnam Biguanide Market in APAC Revenue (Million), by Country 2024 & 2032
- Figure 124: Vietnam Biguanide Market in APAC Volume (K Unit), by Country 2024 & 2032
- Figure 125: Vietnam Biguanide Market in APAC Revenue Share (%), by Country 2024 & 2032
- Figure 126: Vietnam Biguanide Market in APAC Volume Share (%), by Country 2024 & 2032
- Figure 127: Malaysia Biguanide Market in APAC Revenue (Million), by Type 2024 & 2032
- Figure 128: Malaysia Biguanide Market in APAC Volume (K Unit), by Type 2024 & 2032
- Figure 129: Malaysia Biguanide Market in APAC Revenue Share (%), by Type 2024 & 2032
- Figure 130: Malaysia Biguanide Market in APAC Volume Share (%), by Type 2024 & 2032
- Figure 131: Malaysia Biguanide Market in APAC Revenue (Million), by Dosage 2024 & 2032
- Figure 132: Malaysia Biguanide Market in APAC Volume (K Unit), by Dosage 2024 & 2032
- Figure 133: Malaysia Biguanide Market in APAC Revenue Share (%), by Dosage 2024 & 2032
- Figure 134: Malaysia Biguanide Market in APAC Volume Share (%), by Dosage 2024 & 2032
- Figure 135: Malaysia Biguanide Market in APAC Revenue (Million), by Brand/Generic 2024 & 2032
- Figure 136: Malaysia Biguanide Market in APAC Volume (K Unit), by Brand/Generic 2024 & 2032
- Figure 137: Malaysia Biguanide Market in APAC Revenue Share (%), by Brand/Generic 2024 & 2032
- Figure 138: Malaysia Biguanide Market in APAC Volume Share (%), by Brand/Generic 2024 & 2032
- Figure 139: Malaysia Biguanide Market in APAC Revenue (Million), by Application 2024 & 2032
- Figure 140: Malaysia Biguanide Market in APAC Volume (K Unit), by Application 2024 & 2032
- Figure 141: Malaysia Biguanide Market in APAC Revenue Share (%), by Application 2024 & 2032
- Figure 142: Malaysia Biguanide Market in APAC Volume Share (%), by Application 2024 & 2032
- Figure 143: Malaysia Biguanide Market in APAC Revenue (Million), by Country 2024 & 2032
- Figure 144: Malaysia Biguanide Market in APAC Volume (K Unit), by Country 2024 & 2032
- Figure 145: Malaysia Biguanide Market in APAC Revenue Share (%), by Country 2024 & 2032
- Figure 146: Malaysia Biguanide Market in APAC Volume Share (%), by Country 2024 & 2032
- Figure 147: Indonesia Biguanide Market in APAC Revenue (Million), by Type 2024 & 2032
- Figure 148: Indonesia Biguanide Market in APAC Volume (K Unit), by Type 2024 & 2032
- Figure 149: Indonesia Biguanide Market in APAC Revenue Share (%), by Type 2024 & 2032
- Figure 150: Indonesia Biguanide Market in APAC Volume Share (%), by Type 2024 & 2032
- Figure 151: Indonesia Biguanide Market in APAC Revenue (Million), by Dosage 2024 & 2032
- Figure 152: Indonesia Biguanide Market in APAC Volume (K Unit), by Dosage 2024 & 2032
- Figure 153: Indonesia Biguanide Market in APAC Revenue Share (%), by Dosage 2024 & 2032
- Figure 154: Indonesia Biguanide Market in APAC Volume Share (%), by Dosage 2024 & 2032
- Figure 155: Indonesia Biguanide Market in APAC Revenue (Million), by Brand/Generic 2024 & 2032
- Figure 156: Indonesia Biguanide Market in APAC Volume (K Unit), by Brand/Generic 2024 & 2032
- Figure 157: Indonesia Biguanide Market in APAC Revenue Share (%), by Brand/Generic 2024 & 2032
- Figure 158: Indonesia Biguanide Market in APAC Volume Share (%), by Brand/Generic 2024 & 2032
- Figure 159: Indonesia Biguanide Market in APAC Revenue (Million), by Application 2024 & 2032
- Figure 160: Indonesia Biguanide Market in APAC Volume (K Unit), by Application 2024 & 2032
- Figure 161: Indonesia Biguanide Market in APAC Revenue Share (%), by Application 2024 & 2032
- Figure 162: Indonesia Biguanide Market in APAC Volume Share (%), by Application 2024 & 2032
- Figure 163: Indonesia Biguanide Market in APAC Revenue (Million), by Country 2024 & 2032
- Figure 164: Indonesia Biguanide Market in APAC Volume (K Unit), by Country 2024 & 2032
- Figure 165: Indonesia Biguanide Market in APAC Revenue Share (%), by Country 2024 & 2032
- Figure 166: Indonesia Biguanide Market in APAC Volume Share (%), by Country 2024 & 2032
- Figure 167: Philippines Biguanide Market in APAC Revenue (Million), by Type 2024 & 2032
- Figure 168: Philippines Biguanide Market in APAC Volume (K Unit), by Type 2024 & 2032
- Figure 169: Philippines Biguanide Market in APAC Revenue Share (%), by Type 2024 & 2032
- Figure 170: Philippines Biguanide Market in APAC Volume Share (%), by Type 2024 & 2032
- Figure 171: Philippines Biguanide Market in APAC Revenue (Million), by Dosage 2024 & 2032
- Figure 172: Philippines Biguanide Market in APAC Volume (K Unit), by Dosage 2024 & 2032
- Figure 173: Philippines Biguanide Market in APAC Revenue Share (%), by Dosage 2024 & 2032
- Figure 174: Philippines Biguanide Market in APAC Volume Share (%), by Dosage 2024 & 2032
- Figure 175: Philippines Biguanide Market in APAC Revenue (Million), by Brand/Generic 2024 & 2032
- Figure 176: Philippines Biguanide Market in APAC Volume (K Unit), by Brand/Generic 2024 & 2032
- Figure 177: Philippines Biguanide Market in APAC Revenue Share (%), by Brand/Generic 2024 & 2032
- Figure 178: Philippines Biguanide Market in APAC Volume Share (%), by Brand/Generic 2024 & 2032
- Figure 179: Philippines Biguanide Market in APAC Revenue (Million), by Application 2024 & 2032
- Figure 180: Philippines Biguanide Market in APAC Volume (K Unit), by Application 2024 & 2032
- Figure 181: Philippines Biguanide Market in APAC Revenue Share (%), by Application 2024 & 2032
- Figure 182: Philippines Biguanide Market in APAC Volume Share (%), by Application 2024 & 2032
- Figure 183: Philippines Biguanide Market in APAC Revenue (Million), by Country 2024 & 2032
- Figure 184: Philippines Biguanide Market in APAC Volume (K Unit), by Country 2024 & 2032
- Figure 185: Philippines Biguanide Market in APAC Revenue Share (%), by Country 2024 & 2032
- Figure 186: Philippines Biguanide Market in APAC Volume Share (%), by Country 2024 & 2032
- Figure 187: Thailand Biguanide Market in APAC Revenue (Million), by Type 2024 & 2032
- Figure 188: Thailand Biguanide Market in APAC Volume (K Unit), by Type 2024 & 2032
- Figure 189: Thailand Biguanide Market in APAC Revenue Share (%), by Type 2024 & 2032
- Figure 190: Thailand Biguanide Market in APAC Volume Share (%), by Type 2024 & 2032
- Figure 191: Thailand Biguanide Market in APAC Revenue (Million), by Dosage 2024 & 2032
- Figure 192: Thailand Biguanide Market in APAC Volume (K Unit), by Dosage 2024 & 2032
- Figure 193: Thailand Biguanide Market in APAC Revenue Share (%), by Dosage 2024 & 2032
- Figure 194: Thailand Biguanide Market in APAC Volume Share (%), by Dosage 2024 & 2032
- Figure 195: Thailand Biguanide Market in APAC Revenue (Million), by Brand/Generic 2024 & 2032
- Figure 196: Thailand Biguanide Market in APAC Volume (K Unit), by Brand/Generic 2024 & 2032
- Figure 197: Thailand Biguanide Market in APAC Revenue Share (%), by Brand/Generic 2024 & 2032
- Figure 198: Thailand Biguanide Market in APAC Volume Share (%), by Brand/Generic 2024 & 2032
- Figure 199: Thailand Biguanide Market in APAC Revenue (Million), by Application 2024 & 2032
- Figure 200: Thailand Biguanide Market in APAC Volume (K Unit), by Application 2024 & 2032
- Figure 201: Thailand Biguanide Market in APAC Revenue Share (%), by Application 2024 & 2032
- Figure 202: Thailand Biguanide Market in APAC Volume Share (%), by Application 2024 & 2032
- Figure 203: Thailand Biguanide Market in APAC Revenue (Million), by Country 2024 & 2032
- Figure 204: Thailand Biguanide Market in APAC Volume (K Unit), by Country 2024 & 2032
- Figure 205: Thailand Biguanide Market in APAC Revenue Share (%), by Country 2024 & 2032
- Figure 206: Thailand Biguanide Market in APAC Volume Share (%), by Country 2024 & 2032
- Figure 207: Rest of Asia Pacific Biguanide Market in APAC Revenue (Million), by Type 2024 & 2032
- Figure 208: Rest of Asia Pacific Biguanide Market in APAC Volume (K Unit), by Type 2024 & 2032
- Figure 209: Rest of Asia Pacific Biguanide Market in APAC Revenue Share (%), by Type 2024 & 2032
- Figure 210: Rest of Asia Pacific Biguanide Market in APAC Volume Share (%), by Type 2024 & 2032
- Figure 211: Rest of Asia Pacific Biguanide Market in APAC Revenue (Million), by Dosage 2024 & 2032
- Figure 212: Rest of Asia Pacific Biguanide Market in APAC Volume (K Unit), by Dosage 2024 & 2032
- Figure 213: Rest of Asia Pacific Biguanide Market in APAC Revenue Share (%), by Dosage 2024 & 2032
- Figure 214: Rest of Asia Pacific Biguanide Market in APAC Volume Share (%), by Dosage 2024 & 2032
- Figure 215: Rest of Asia Pacific Biguanide Market in APAC Revenue (Million), by Brand/Generic 2024 & 2032
- Figure 216: Rest of Asia Pacific Biguanide Market in APAC Volume (K Unit), by Brand/Generic 2024 & 2032
- Figure 217: Rest of Asia Pacific Biguanide Market in APAC Revenue Share (%), by Brand/Generic 2024 & 2032
- Figure 218: Rest of Asia Pacific Biguanide Market in APAC Volume Share (%), by Brand/Generic 2024 & 2032
- Figure 219: Rest of Asia Pacific Biguanide Market in APAC Revenue (Million), by Application 2024 & 2032
- Figure 220: Rest of Asia Pacific Biguanide Market in APAC Volume (K Unit), by Application 2024 & 2032
- Figure 221: Rest of Asia Pacific Biguanide Market in APAC Revenue Share (%), by Application 2024 & 2032
- Figure 222: Rest of Asia Pacific Biguanide Market in APAC Volume Share (%), by Application 2024 & 2032
- Figure 223: Rest of Asia Pacific Biguanide Market in APAC Revenue (Million), by Country 2024 & 2032
- Figure 224: Rest of Asia Pacific Biguanide Market in APAC Volume (K Unit), by Country 2024 & 2032
- Figure 225: Rest of Asia Pacific Biguanide Market in APAC Revenue Share (%), by Country 2024 & 2032
- Figure 226: Rest of Asia Pacific Biguanide Market in APAC Volume Share (%), by Country 2024 & 2032
List of Tables
- Table 1: Global Biguanide Market in APAC Revenue Million Forecast, by Region 2019 & 2032
- Table 2: Global Biguanide Market in APAC Volume K Unit Forecast, by Region 2019 & 2032
- Table 3: Global Biguanide Market in APAC Revenue Million Forecast, by Type 2019 & 2032
- Table 4: Global Biguanide Market in APAC Volume K Unit Forecast, by Type 2019 & 2032
- Table 5: Global Biguanide Market in APAC Revenue Million Forecast, by Dosage 2019 & 2032
- Table 6: Global Biguanide Market in APAC Volume K Unit Forecast, by Dosage 2019 & 2032
- Table 7: Global Biguanide Market in APAC Revenue Million Forecast, by Brand/Generic 2019 & 2032
- Table 8: Global Biguanide Market in APAC Volume K Unit Forecast, by Brand/Generic 2019 & 2032
- Table 9: Global Biguanide Market in APAC Revenue Million Forecast, by Application 2019 & 2032
- Table 10: Global Biguanide Market in APAC Volume K Unit Forecast, by Application 2019 & 2032
- Table 11: Global Biguanide Market in APAC Revenue Million Forecast, by Region 2019 & 2032
- Table 12: Global Biguanide Market in APAC Volume K Unit Forecast, by Region 2019 & 2032
- Table 13: Global Biguanide Market in APAC Revenue Million Forecast, by Country 2019 & 2032
- Table 14: Global Biguanide Market in APAC Volume K Unit Forecast, by Country 2019 & 2032
- Table 15: China Biguanide Market in APAC Revenue (Million) Forecast, by Application 2019 & 2032
- Table 16: China Biguanide Market in APAC Volume (K Unit) Forecast, by Application 2019 & 2032
- Table 17: Japan Biguanide Market in APAC Revenue (Million) Forecast, by Application 2019 & 2032
- Table 18: Japan Biguanide Market in APAC Volume (K Unit) Forecast, by Application 2019 & 2032
- Table 19: India Biguanide Market in APAC Revenue (Million) Forecast, by Application 2019 & 2032
- Table 20: India Biguanide Market in APAC Volume (K Unit) Forecast, by Application 2019 & 2032
- Table 21: South Korea Biguanide Market in APAC Revenue (Million) Forecast, by Application 2019 & 2032
- Table 22: South Korea Biguanide Market in APAC Volume (K Unit) Forecast, by Application 2019 & 2032
- Table 23: Southeast Asia Biguanide Market in APAC Revenue (Million) Forecast, by Application 2019 & 2032
- Table 24: Southeast Asia Biguanide Market in APAC Volume (K Unit) Forecast, by Application 2019 & 2032
- Table 25: Australia Biguanide Market in APAC Revenue (Million) Forecast, by Application 2019 & 2032
- Table 26: Australia Biguanide Market in APAC Volume (K Unit) Forecast, by Application 2019 & 2032
- Table 27: Indonesia Biguanide Market in APAC Revenue (Million) Forecast, by Application 2019 & 2032
- Table 28: Indonesia Biguanide Market in APAC Volume (K Unit) Forecast, by Application 2019 & 2032
- Table 29: Phillipes Biguanide Market in APAC Revenue (Million) Forecast, by Application 2019 & 2032
- Table 30: Phillipes Biguanide Market in APAC Volume (K Unit) Forecast, by Application 2019 & 2032
- Table 31: Singapore Biguanide Market in APAC Revenue (Million) Forecast, by Application 2019 & 2032
- Table 32: Singapore Biguanide Market in APAC Volume (K Unit) Forecast, by Application 2019 & 2032
- Table 33: Thailandc Biguanide Market in APAC Revenue (Million) Forecast, by Application 2019 & 2032
- Table 34: Thailandc Biguanide Market in APAC Volume (K Unit) Forecast, by Application 2019 & 2032
- Table 35: Rest of Asia Pacific Biguanide Market in APAC Revenue (Million) Forecast, by Application 2019 & 2032
- Table 36: Rest of Asia Pacific Biguanide Market in APAC Volume (K Unit) Forecast, by Application 2019 & 2032
- Table 37: Global Biguanide Market in APAC Revenue Million Forecast, by Type 2019 & 2032
- Table 38: Global Biguanide Market in APAC Volume K Unit Forecast, by Type 2019 & 2032
- Table 39: Global Biguanide Market in APAC Revenue Million Forecast, by Dosage 2019 & 2032
- Table 40: Global Biguanide Market in APAC Volume K Unit Forecast, by Dosage 2019 & 2032
- Table 41: Global Biguanide Market in APAC Revenue Million Forecast, by Brand/Generic 2019 & 2032
- Table 42: Global Biguanide Market in APAC Volume K Unit Forecast, by Brand/Generic 2019 & 2032
- Table 43: Global Biguanide Market in APAC Revenue Million Forecast, by Application 2019 & 2032
- Table 44: Global Biguanide Market in APAC Volume K Unit Forecast, by Application 2019 & 2032
- Table 45: Global Biguanide Market in APAC Revenue Million Forecast, by Country 2019 & 2032
- Table 46: Global Biguanide Market in APAC Volume K Unit Forecast, by Country 2019 & 2032
- Table 47: Global Biguanide Market in APAC Revenue Million Forecast, by Type 2019 & 2032
- Table 48: Global Biguanide Market in APAC Volume K Unit Forecast, by Type 2019 & 2032
- Table 49: Global Biguanide Market in APAC Revenue Million Forecast, by Dosage 2019 & 2032
- Table 50: Global Biguanide Market in APAC Volume K Unit Forecast, by Dosage 2019 & 2032
- Table 51: Global Biguanide Market in APAC Revenue Million Forecast, by Brand/Generic 2019 & 2032
- Table 52: Global Biguanide Market in APAC Volume K Unit Forecast, by Brand/Generic 2019 & 2032
- Table 53: Global Biguanide Market in APAC Revenue Million Forecast, by Application 2019 & 2032
- Table 54: Global Biguanide Market in APAC Volume K Unit Forecast, by Application 2019 & 2032
- Table 55: Global Biguanide Market in APAC Revenue Million Forecast, by Country 2019 & 2032
- Table 56: Global Biguanide Market in APAC Volume K Unit Forecast, by Country 2019 & 2032
- Table 57: Global Biguanide Market in APAC Revenue Million Forecast, by Type 2019 & 2032
- Table 58: Global Biguanide Market in APAC Volume K Unit Forecast, by Type 2019 & 2032
- Table 59: Global Biguanide Market in APAC Revenue Million Forecast, by Dosage 2019 & 2032
- Table 60: Global Biguanide Market in APAC Volume K Unit Forecast, by Dosage 2019 & 2032
- Table 61: Global Biguanide Market in APAC Revenue Million Forecast, by Brand/Generic 2019 & 2032
- Table 62: Global Biguanide Market in APAC Volume K Unit Forecast, by Brand/Generic 2019 & 2032
- Table 63: Global Biguanide Market in APAC Revenue Million Forecast, by Application 2019 & 2032
- Table 64: Global Biguanide Market in APAC Volume K Unit Forecast, by Application 2019 & 2032
- Table 65: Global Biguanide Market in APAC Revenue Million Forecast, by Country 2019 & 2032
- Table 66: Global Biguanide Market in APAC Volume K Unit Forecast, by Country 2019 & 2032
- Table 67: Global Biguanide Market in APAC Revenue Million Forecast, by Type 2019 & 2032
- Table 68: Global Biguanide Market in APAC Volume K Unit Forecast, by Type 2019 & 2032
- Table 69: Global Biguanide Market in APAC Revenue Million Forecast, by Dosage 2019 & 2032
- Table 70: Global Biguanide Market in APAC Volume K Unit Forecast, by Dosage 2019 & 2032
- Table 71: Global Biguanide Market in APAC Revenue Million Forecast, by Brand/Generic 2019 & 2032
- Table 72: Global Biguanide Market in APAC Volume K Unit Forecast, by Brand/Generic 2019 & 2032
- Table 73: Global Biguanide Market in APAC Revenue Million Forecast, by Application 2019 & 2032
- Table 74: Global Biguanide Market in APAC Volume K Unit Forecast, by Application 2019 & 2032
- Table 75: Global Biguanide Market in APAC Revenue Million Forecast, by Country 2019 & 2032
- Table 76: Global Biguanide Market in APAC Volume K Unit Forecast, by Country 2019 & 2032
- Table 77: Global Biguanide Market in APAC Revenue Million Forecast, by Type 2019 & 2032
- Table 78: Global Biguanide Market in APAC Volume K Unit Forecast, by Type 2019 & 2032
- Table 79: Global Biguanide Market in APAC Revenue Million Forecast, by Dosage 2019 & 2032
- Table 80: Global Biguanide Market in APAC Volume K Unit Forecast, by Dosage 2019 & 2032
- Table 81: Global Biguanide Market in APAC Revenue Million Forecast, by Brand/Generic 2019 & 2032
- Table 82: Global Biguanide Market in APAC Volume K Unit Forecast, by Brand/Generic 2019 & 2032
- Table 83: Global Biguanide Market in APAC Revenue Million Forecast, by Application 2019 & 2032
- Table 84: Global Biguanide Market in APAC Volume K Unit Forecast, by Application 2019 & 2032
- Table 85: Global Biguanide Market in APAC Revenue Million Forecast, by Country 2019 & 2032
- Table 86: Global Biguanide Market in APAC Volume K Unit Forecast, by Country 2019 & 2032
- Table 87: Global Biguanide Market in APAC Revenue Million Forecast, by Type 2019 & 2032
- Table 88: Global Biguanide Market in APAC Volume K Unit Forecast, by Type 2019 & 2032
- Table 89: Global Biguanide Market in APAC Revenue Million Forecast, by Dosage 2019 & 2032
- Table 90: Global Biguanide Market in APAC Volume K Unit Forecast, by Dosage 2019 & 2032
- Table 91: Global Biguanide Market in APAC Revenue Million Forecast, by Brand/Generic 2019 & 2032
- Table 92: Global Biguanide Market in APAC Volume K Unit Forecast, by Brand/Generic 2019 & 2032
- Table 93: Global Biguanide Market in APAC Revenue Million Forecast, by Application 2019 & 2032
- Table 94: Global Biguanide Market in APAC Volume K Unit Forecast, by Application 2019 & 2032
- Table 95: Global Biguanide Market in APAC Revenue Million Forecast, by Country 2019 & 2032
- Table 96: Global Biguanide Market in APAC Volume K Unit Forecast, by Country 2019 & 2032
- Table 97: Global Biguanide Market in APAC Revenue Million Forecast, by Type 2019 & 2032
- Table 98: Global Biguanide Market in APAC Volume K Unit Forecast, by Type 2019 & 2032
- Table 99: Global Biguanide Market in APAC Revenue Million Forecast, by Dosage 2019 & 2032
- Table 100: Global Biguanide Market in APAC Volume K Unit Forecast, by Dosage 2019 & 2032
- Table 101: Global Biguanide Market in APAC Revenue Million Forecast, by Brand/Generic 2019 & 2032
- Table 102: Global Biguanide Market in APAC Volume K Unit Forecast, by Brand/Generic 2019 & 2032
- Table 103: Global Biguanide Market in APAC Revenue Million Forecast, by Application 2019 & 2032
- Table 104: Global Biguanide Market in APAC Volume K Unit Forecast, by Application 2019 & 2032
- Table 105: Global Biguanide Market in APAC Revenue Million Forecast, by Country 2019 & 2032
- Table 106: Global Biguanide Market in APAC Volume K Unit Forecast, by Country 2019 & 2032
- Table 107: Global Biguanide Market in APAC Revenue Million Forecast, by Type 2019 & 2032
- Table 108: Global Biguanide Market in APAC Volume K Unit Forecast, by Type 2019 & 2032
- Table 109: Global Biguanide Market in APAC Revenue Million Forecast, by Dosage 2019 & 2032
- Table 110: Global Biguanide Market in APAC Volume K Unit Forecast, by Dosage 2019 & 2032
- Table 111: Global Biguanide Market in APAC Revenue Million Forecast, by Brand/Generic 2019 & 2032
- Table 112: Global Biguanide Market in APAC Volume K Unit Forecast, by Brand/Generic 2019 & 2032
- Table 113: Global Biguanide Market in APAC Revenue Million Forecast, by Application 2019 & 2032
- Table 114: Global Biguanide Market in APAC Volume K Unit Forecast, by Application 2019 & 2032
- Table 115: Global Biguanide Market in APAC Revenue Million Forecast, by Country 2019 & 2032
- Table 116: Global Biguanide Market in APAC Volume K Unit Forecast, by Country 2019 & 2032
- Table 117: Global Biguanide Market in APAC Revenue Million Forecast, by Type 2019 & 2032
- Table 118: Global Biguanide Market in APAC Volume K Unit Forecast, by Type 2019 & 2032
- Table 119: Global Biguanide Market in APAC Revenue Million Forecast, by Dosage 2019 & 2032
- Table 120: Global Biguanide Market in APAC Volume K Unit Forecast, by Dosage 2019 & 2032
- Table 121: Global Biguanide Market in APAC Revenue Million Forecast, by Brand/Generic 2019 & 2032
- Table 122: Global Biguanide Market in APAC Volume K Unit Forecast, by Brand/Generic 2019 & 2032
- Table 123: Global Biguanide Market in APAC Revenue Million Forecast, by Application 2019 & 2032
- Table 124: Global Biguanide Market in APAC Volume K Unit Forecast, by Application 2019 & 2032
- Table 125: Global Biguanide Market in APAC Revenue Million Forecast, by Country 2019 & 2032
- Table 126: Global Biguanide Market in APAC Volume K Unit Forecast, by Country 2019 & 2032
- Table 127: Global Biguanide Market in APAC Revenue Million Forecast, by Type 2019 & 2032
- Table 128: Global Biguanide Market in APAC Volume K Unit Forecast, by Type 2019 & 2032
- Table 129: Global Biguanide Market in APAC Revenue Million Forecast, by Dosage 2019 & 2032
- Table 130: Global Biguanide Market in APAC Volume K Unit Forecast, by Dosage 2019 & 2032
- Table 131: Global Biguanide Market in APAC Revenue Million Forecast, by Brand/Generic 2019 & 2032
- Table 132: Global Biguanide Market in APAC Volume K Unit Forecast, by Brand/Generic 2019 & 2032
- Table 133: Global Biguanide Market in APAC Revenue Million Forecast, by Application 2019 & 2032
- Table 134: Global Biguanide Market in APAC Volume K Unit Forecast, by Application 2019 & 2032
- Table 135: Global Biguanide Market in APAC Revenue Million Forecast, by Country 2019 & 2032
- Table 136: Global Biguanide Market in APAC Volume K Unit Forecast, by Country 2019 & 2032
- Table 137: Global Biguanide Market in APAC Revenue Million Forecast, by Type 2019 & 2032
- Table 138: Global Biguanide Market in APAC Volume K Unit Forecast, by Type 2019 & 2032
- Table 139: Global Biguanide Market in APAC Revenue Million Forecast, by Dosage 2019 & 2032
- Table 140: Global Biguanide Market in APAC Volume K Unit Forecast, by Dosage 2019 & 2032
- Table 141: Global Biguanide Market in APAC Revenue Million Forecast, by Brand/Generic 2019 & 2032
- Table 142: Global Biguanide Market in APAC Volume K Unit Forecast, by Brand/Generic 2019 & 2032
- Table 143: Global Biguanide Market in APAC Revenue Million Forecast, by Application 2019 & 2032
- Table 144: Global Biguanide Market in APAC Volume K Unit Forecast, by Application 2019 & 2032
- Table 145: Global Biguanide Market in APAC Revenue Million Forecast, by Country 2019 & 2032
- Table 146: Global Biguanide Market in APAC Volume K Unit Forecast, by Country 2019 & 2032
Frequently Asked Questions
1. What is the projected Compound Annual Growth Rate (CAGR) of the Biguanide Market in APAC?
The projected CAGR is approximately 2.00%.
2. Which companies are prominent players in the Biguanide Market in APAC?
Key companies in the market include Takeda, Sanofi, Merck, Glenmark, Boehringer Ingelheim Pharmaceuticals, GlaxoSmithKline, Bristol-Myers Squibb.
3. What are the main segments of the Biguanide Market in APAC?
The market segments include Type , Dosage , Brand/Generic , Application .
4. Can you provide details about the market size?
The market size is estimated to be USD 1.97 Million as of 2022.
5. What are some drivers contributing to market growth?
Advancement in the Technology of Chromatography Instruments; Significance of Chromatography Based Studies in Drug Approval.
6. What are the notable trends driving market growth?
Rising diabetes prevalence.
7. Are there any restraints impacting market growth?
Rising Price of Equipment.
8. Can you provide examples of recent developments in the market?
February 2023: Zydus Lifesciences Limited received tentative approval from the USFDA for Invokamet tablets (canagliflozin and metformin hydrochloride combination). Canagliflozin and metformin combination products are indicated as an adjunct to diet and exercise to improve glycemic control in adults with type 2 diabetes mellitus who are not adequately controlled on a regimen containing metformin or canagliflozin or in patients already being treated with both canagliflozin and metformin.
9. What pricing options are available for accessing the report?
Pricing options include single-user, multi-user, and enterprise licenses priced at USD 4750, USD 5250, and USD 8750 respectively.
10. Is the market size provided in terms of value or volume?
The market size is provided in terms of value, measured in Million and volume, measured in K Unit.
11. Are there any specific market keywords associated with the report?
Yes, the market keyword associated with the report is "Biguanide Market in APAC," which aids in identifying and referencing the specific market segment covered.
12. How do I determine which pricing option suits my needs best?
The pricing options vary based on user requirements and access needs. Individual users may opt for single-user licenses, while businesses requiring broader access may choose multi-user or enterprise licenses for cost-effective access to the report.
13. Are there any additional resources or data provided in the Biguanide Market in APAC report?
While the report offers comprehensive insights, it's advisable to review the specific contents or supplementary materials provided to ascertain if additional resources or data are available.
14. How can I stay updated on further developments or reports in the Biguanide Market in APAC?
To stay informed about further developments, trends, and reports in the Biguanide Market in APAC, consider subscribing to industry newsletters, following relevant companies and organizations, or regularly checking reputable industry news sources and publications.
Methodology
Step 1 - Identification of Relevant Samples Size from Population Database


Step 2 - Approaches for Defining Global Market Size (Value, Volume* & Price*)

Note*: In applicable scenarios
Step 3 - Data Sources
Primary Research
- Web Analytics
- Survey Reports
- Research Institute
- Latest Research Reports
- Opinion Leaders
Secondary Research
- Annual Reports
- White Paper
- Latest Press Release
- Industry Association
- Paid Database
- Investor Presentations

Step 4 - Data Triangulation
Involves using different sources of information in order to increase the validity of a study
These sources are likely to be stakeholders in a program - participants, other researchers, program staff, other community members, and so on.
Then we put all data in single framework & apply various statistical tools to find out the dynamic on the market.
During the analysis stage, feedback from the stakeholder groups would be compared to determine areas of agreement as well as areas of divergence


