
Key Insights
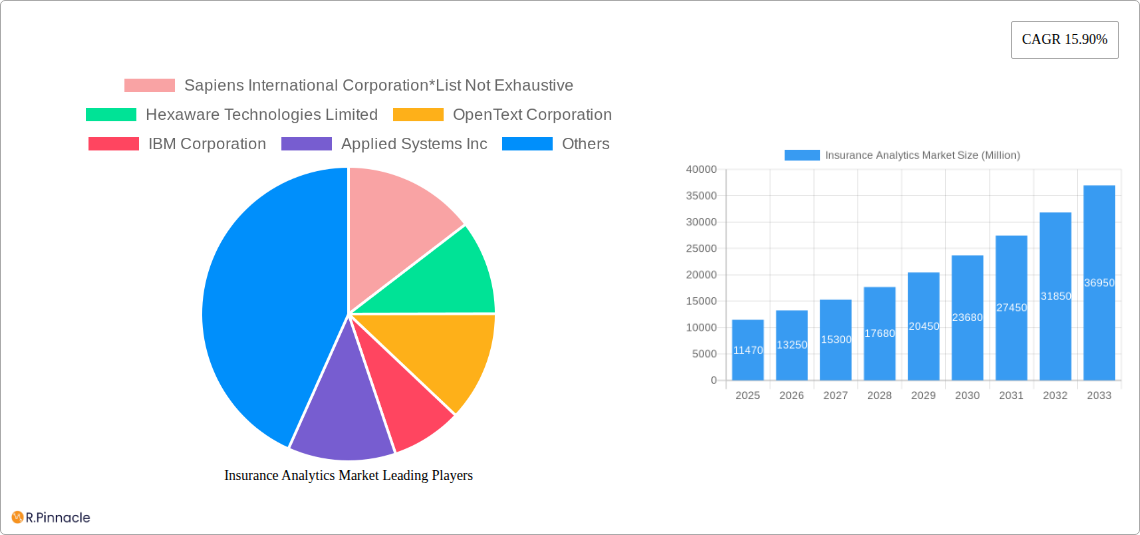
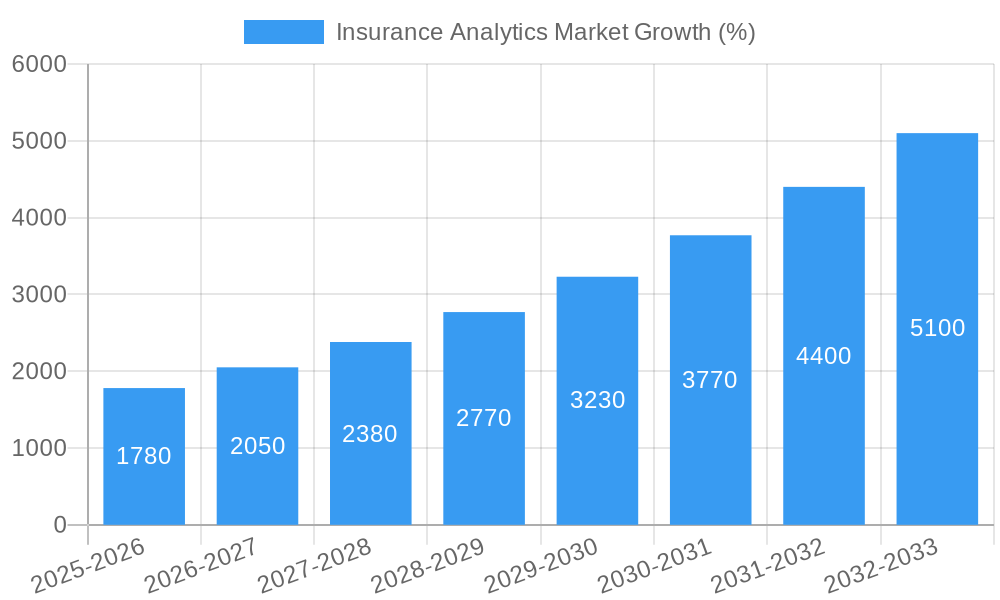
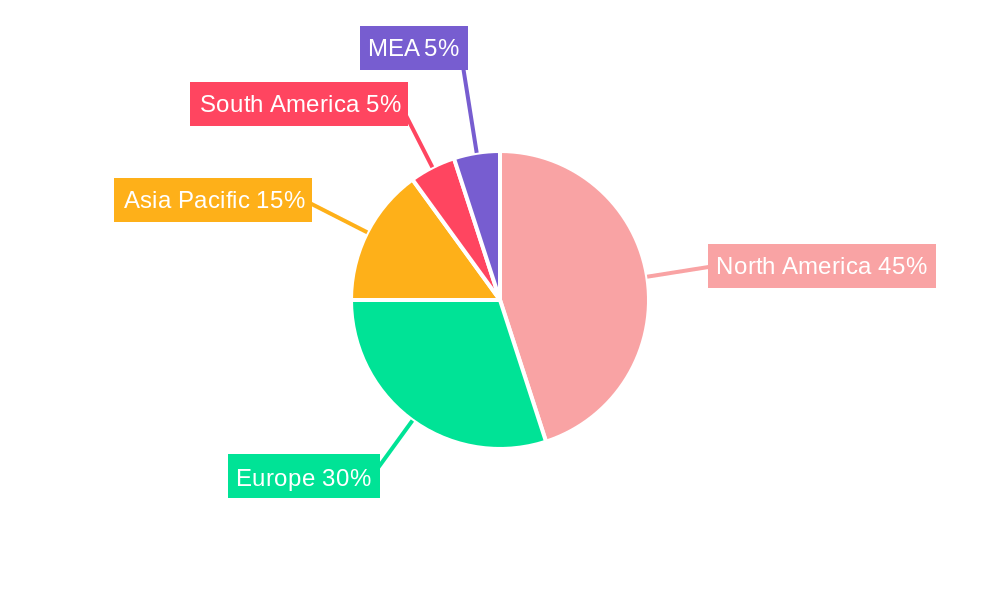
The Insurance Analytics market is experiencing robust growth, projected to reach \$11.47 billion in 2025 and maintain a Compound Annual Growth Rate (CAGR) of 15.90% from 2025 to 2033. This expansion is driven by several key factors. Firstly, the increasing volume and complexity of insurance data necessitate sophisticated analytical tools for efficient claims processing, risk assessment, and fraud detection. Secondly, the rising adoption of cloud-based solutions offers scalability and cost-effectiveness, fueling market growth. Furthermore, regulatory compliance demands and the need for personalized customer experiences are pushing insurance companies to invest heavily in advanced analytics capabilities. The market is segmented by component (tools and services), business application (claims management, risk management, process optimization, customer management, and personalization), deployment mode (on-premise and cloud), and end-user (insurance companies, government agencies, third-party administrators, brokers, and consultancies). North America currently holds a significant market share due to early adoption of advanced technologies and a well-established insurance sector. However, growth in Asia-Pacific and other regions is expected to accelerate in the coming years, driven by increasing digitalization and rising insurance penetration. Competition is intense, with established players like Sapiens, IBM, and Guidewire alongside emerging technology providers vying for market share. The continuous innovation in artificial intelligence (AI), machine learning (ML), and big data analytics further fuels market dynamism and presents opportunities for specialized solutions targeting specific segments within the insurance industry.
The market's future trajectory suggests continued high growth, propelled by factors such as the increasing adoption of predictive modeling for underwriting, the emergence of Insurtech companies offering innovative solutions, and the growing focus on data security and privacy. The shift towards cloud-based solutions will continue to be a dominant trend, fostering collaboration and data sharing across the insurance ecosystem. While challenges remain, including data integration complexities and the need for skilled professionals, the overall outlook for the Insurance Analytics market remains extremely positive, promising substantial returns on investment for both vendors and adopters alike. The market’s segmentation provides several niche opportunities for specialized vendors to target specific customer needs and functionalities.
Insurance Analytics Market: A Comprehensive Report (2019-2033)
This in-depth report provides a comprehensive analysis of the Insurance Analytics Market, offering invaluable insights for industry professionals, investors, and strategic decision-makers. Covering the period from 2019 to 2033, with a focus on 2025, this report leverages extensive market research to deliver actionable intelligence on market size, growth drivers, challenges, and future opportunities. The market is projected to reach xx Million by 2033, presenting significant growth potential.
Insurance Analytics Market Structure & Innovation Trends
This section analyzes the competitive landscape of the Insurance Analytics Market, examining market concentration, innovation drivers, and regulatory influences. We delve into the dynamics of mergers and acquisitions (M&A), providing insights into deal values and their impact on market share. The report also explores the role of technological advancements, product substitution, and evolving end-user demographics.
- Market Concentration: The market exhibits a [Describe level of concentration - e.g., moderately concentrated] structure, with key players holding a significant but not dominant market share. [Insert quantified data on market share if available, e.g., Top 5 players hold X% of the market].
- Innovation Drivers: Key drivers of innovation include the increasing availability of big data, advancements in artificial intelligence (AI) and machine learning (ML), and the growing demand for improved risk management and customer experience.
- Regulatory Framework: Regulatory compliance and data privacy regulations (e.g., GDPR, CCPA) significantly influence the market, shaping product development and deployment strategies. [Include specific regulations and their impact].
- Product Substitutes: [Discuss potential substitutes, such as traditional actuarial methods or simpler analytics tools, and their impact on market dynamics].
- End-User Demographics: The market is driven by diverse end-users, including insurance companies (largest segment), government agencies, third-party administrators, brokers, and consultancies. Their varying needs and technological capabilities shape the market's development.
- M&A Activities: The Insurance Analytics Market has witnessed [Number] significant M&A deals in the past [Number] years, with deal values totaling approximately xx Million. [Provide examples of significant M&A activities, if available. Include deal values where possible].
Insurance Analytics Market Dynamics & Trends
This section examines the key dynamics driving the growth of the Insurance Analytics Market. It explores factors such as market growth drivers, technological disruptions, evolving consumer preferences, and competitive dynamics, presenting detailed quantitative and qualitative analyses. The market is projected to experience a CAGR of xx% during the forecast period (2025-2033), fueled by increasing adoption of advanced analytics across the insurance sector.
[Insert a paragraph of 600 words analyzing market growth drivers (e.g., increasing data volumes, demand for personalized insurance products, regulatory pressure for improved risk management), technological disruptions (e.g., AI, cloud computing, blockchain), consumer preferences (e.g., demand for faster claims processing, personalized pricing), and competitive dynamics (e.g., product differentiation, pricing strategies, partnerships). Include specific metrics like CAGR and market penetration where available].
Dominant Regions & Segments in Insurance Analytics Market
This section identifies the leading regions, countries, and market segments within the Insurance Analytics Market. We analyze the key drivers contributing to the dominance of specific regions and segments, providing a detailed understanding of market dynamics.
Leading Region: [Identify the leading region and provide a detailed explanation of its dominance (e.g., North America, due to high adoption rates of advanced technologies and a large insurance sector)].
Dominant Segments:
- By Component: [Analyze the market share of Tools and Services, highlighting which segment is currently dominant and projecting future growth trends].
- By Business Application: [Analyze the importance of each business application (Claims Management, Risk Management, Process Optimization, Customer Management & Personalization). Identify the leading application and provide reasoning based on factors such as adoption rates, ROI, and regulatory pressures].
- By Deployment Mode: [Compare the market share of On-premise and Cloud deployments. Highlight the drivers for growth in each segment, including cost savings, scalability, and security considerations].
- By End-User: [Detail the market share of each end-user segment (Insurance Companies, Government Agencies, Third-party Administrators, Brokers, and Consultancies). Explain the factors contributing to the dominance of specific segments, including their budget allocations for technology adoption and their specific needs for advanced analytics].
[For each segment, provide bullet points outlining key drivers such as economic policies, technological advancements, and infrastructure development that contribute to its dominance. Use paragraphs to provide a detailed dominance analysis.]
Insurance Analytics Market Product Innovations
Recent product developments have focused on enhancing the capabilities of existing solutions through AI and machine learning integration. This allows for more efficient data processing, improved accuracy in risk assessment, and more personalized customer experiences. The market is witnessing a shift towards cloud-based solutions, providing scalability and accessibility. These innovations cater to the growing demand for faster claims processing, better fraud detection, and enhanced customer service.
Report Scope & Segmentation Analysis
This report comprehensively analyzes the Insurance Analytics Market across various segments:
- By Component: Tools and Services. [Include growth projections, market sizes (in Millions), and competitive dynamics for each sub-segment].
- By Business Application: Claims Management, Risk Management, Process Optimization, Customer Management and Personalization. [Include growth projections, market sizes (in Millions), and competitive dynamics for each sub-segment].
- By Deployment Mode: On-premise and Cloud. [Include growth projections, market sizes (in Millions), and competitive dynamics for each sub-segment].
- By End-User: Insurance Companies, Government Agencies, Third-party Administrators, Brokers, and Consultancies. [Include growth projections, market sizes (in Millions), and competitive dynamics for each sub-segment].
Key Drivers of Insurance Analytics Market Growth
The Insurance Analytics Market is propelled by several key drivers:
- Technological advancements: AI, ML, and big data analytics enable more sophisticated risk assessment, fraud detection, and personalized customer experiences.
- Increased data availability: The growth of digital channels and connected devices provides insurers with vast amounts of data, fueling the demand for analytics solutions.
- Regulatory pressure: Regulations increasingly demand better risk management and compliance, driving the adoption of advanced analytics.
- Rising customer expectations: Customers expect faster, more personalized insurance services, pushing insurers to invest in analytics to improve efficiency and customer satisfaction.
Challenges in the Insurance Analytics Market Sector
Several challenges hinder the growth of the Insurance Analytics Market:
- Data security and privacy concerns: The sensitive nature of insurance data requires robust security measures, increasing costs and complexity.
- Integration complexities: Integrating analytics solutions with existing legacy systems can be challenging and time-consuming.
- Lack of skilled professionals: The demand for data scientists and analytics experts exceeds the supply, creating a skills gap in the market.
- High initial investment costs: Implementing advanced analytics solutions can require significant upfront investment, potentially deterring smaller insurers.
Emerging Opportunities in Insurance Analytics Market
Emerging opportunities in the Insurance Analytics Market include:
- Expansion into new markets: Developing economies present significant growth potential for insurance analytics solutions.
- Adoption of new technologies: Blockchain and IoT technologies offer new avenues for data collection and analysis.
- Growth of Insurtech: The Insurtech sector is fostering innovation and driving the demand for advanced analytics.
- Personalized insurance products: Analytics enables the creation of more tailored and affordable insurance products.
Leading Players in the Insurance Analytics Market
- Sapiens International Corporation
- Hexaware Technologies Limited
- OpenText Corporation
- IBM Corporation
- Applied Systems Inc
- MicroStrategy Incorporated
- Guidewire Software Inc
- Microsoft Corporation
- Oracle Corporation
- LexisNexis Risk Solutions
Key Developments in Insurance Analytics Market Industry
- April 2023: Guidewire launched the Garmisch solution, providing developers with self-service tools for creating seamless digital claims experiences. This accelerates the adoption of cloud-based solutions and enhances efficiency in claims processing.
- February 2023: MS Amlin Insurance S.E. adopted Sapiens IDITSuite, an end-to-end insurance platform. This adoption showcases the growing demand for comprehensive analytics solutions that improve risk selection and reduce claim costs.
Future Outlook for Insurance Analytics Market
The Insurance Analytics Market is poised for robust growth, driven by ongoing technological advancements, increasing data availability, and rising customer expectations. Strategic partnerships between insurers and technology providers will play a crucial role in shaping the market's future. The focus on AI-powered solutions, cloud adoption, and the development of innovative applications will further drive market expansion and create new opportunities for players in the ecosystem.
Insurance Analytics Market Segmentation
-
1. Component
- 1.1. Tool
- 1.2. Services
-
2. Business Application (Qualitative Analysis)
- 2.1. Claims Management
- 2.2. Risk Management
- 2.3. Process Optimization
- 2.4. Customer Management and Personalization
-
3. Deployment Mode
- 3.1. On-premise
- 3.2. Cloud
-
4. End-User
- 4.1. Insurance Companies
- 4.2. Government Agencies
- 4.3. Third-pa
Insurance Analytics Market Segmentation By Geography
- 1. North America
- 2. Europe
- 3. Asia Pacific
- 4. Rest of the World
Insurance Analytics Market REPORT HIGHLIGHTS
| Aspects | Details |
|---|---|
| Study Period | 2019-2033 |
| Base Year | 2024 |
| Estimated Year | 2025 |
| Forecast Period | 2025-2033 |
| Historical Period | 2019-2024 |
| Growth Rate | CAGR of 15.90% from 2019-2033 |
| Segmentation |
|
Table of Contents
- 1. Introduction
- 1.1. Research Scope
- 1.2. Market Segmentation
- 1.3. Research Methodology
- 1.4. Definitions and Assumptions
- 2. Executive Summary
- 2.1. Introduction
- 3. Market Dynamics
- 3.1. Introduction
- 3.2. Market Drivers
- 3.2.1. Increased Adoption of Advanced Technologies; Rise in Competition among the Insurance Sector
- 3.3. Market Restrains
- 3.3.1. Stringent Government Regulations; Privacy and Security Concern
- 3.4. Market Trends
- 3.4.1. Increasing Risks And Fraudulent Activities Are Boosting the Adoption Of Insurance Analytics.
- 4. Market Factor Analysis
- 4.1. Porters Five Forces
- 4.2. Supply/Value Chain
- 4.3. PESTEL analysis
- 4.4. Market Entropy
- 4.5. Patent/Trademark Analysis
- 5. Global Insurance Analytics Market Analysis, Insights and Forecast, 2019-2031
- 5.1. Market Analysis, Insights and Forecast - by Component
- 5.1.1. Tool
- 5.1.2. Services
- 5.2. Market Analysis, Insights and Forecast - by Business Application (Qualitative Analysis)
- 5.2.1. Claims Management
- 5.2.2. Risk Management
- 5.2.3. Process Optimization
- 5.2.4. Customer Management and Personalization
- 5.3. Market Analysis, Insights and Forecast - by Deployment Mode
- 5.3.1. On-premise
- 5.3.2. Cloud
- 5.4. Market Analysis, Insights and Forecast - by End-User
- 5.4.1. Insurance Companies
- 5.4.2. Government Agencies
- 5.4.3. Third-pa
- 5.5. Market Analysis, Insights and Forecast - by Region
- 5.5.1. North America
- 5.5.2. Europe
- 5.5.3. Asia Pacific
- 5.5.4. Rest of the World
- 5.1. Market Analysis, Insights and Forecast - by Component
- 6. North America Insurance Analytics Market Analysis, Insights and Forecast, 2019-2031
- 6.1. Market Analysis, Insights and Forecast - by Component
- 6.1.1. Tool
- 6.1.2. Services
- 6.2. Market Analysis, Insights and Forecast - by Business Application (Qualitative Analysis)
- 6.2.1. Claims Management
- 6.2.2. Risk Management
- 6.2.3. Process Optimization
- 6.2.4. Customer Management and Personalization
- 6.3. Market Analysis, Insights and Forecast - by Deployment Mode
- 6.3.1. On-premise
- 6.3.2. Cloud
- 6.4. Market Analysis, Insights and Forecast - by End-User
- 6.4.1. Insurance Companies
- 6.4.2. Government Agencies
- 6.4.3. Third-pa
- 6.1. Market Analysis, Insights and Forecast - by Component
- 7. Europe Insurance Analytics Market Analysis, Insights and Forecast, 2019-2031
- 7.1. Market Analysis, Insights and Forecast - by Component
- 7.1.1. Tool
- 7.1.2. Services
- 7.2. Market Analysis, Insights and Forecast - by Business Application (Qualitative Analysis)
- 7.2.1. Claims Management
- 7.2.2. Risk Management
- 7.2.3. Process Optimization
- 7.2.4. Customer Management and Personalization
- 7.3. Market Analysis, Insights and Forecast - by Deployment Mode
- 7.3.1. On-premise
- 7.3.2. Cloud
- 7.4. Market Analysis, Insights and Forecast - by End-User
- 7.4.1. Insurance Companies
- 7.4.2. Government Agencies
- 7.4.3. Third-pa
- 7.1. Market Analysis, Insights and Forecast - by Component
- 8. Asia Pacific Insurance Analytics Market Analysis, Insights and Forecast, 2019-2031
- 8.1. Market Analysis, Insights and Forecast - by Component
- 8.1.1. Tool
- 8.1.2. Services
- 8.2. Market Analysis, Insights and Forecast - by Business Application (Qualitative Analysis)
- 8.2.1. Claims Management
- 8.2.2. Risk Management
- 8.2.3. Process Optimization
- 8.2.4. Customer Management and Personalization
- 8.3. Market Analysis, Insights and Forecast - by Deployment Mode
- 8.3.1. On-premise
- 8.3.2. Cloud
- 8.4. Market Analysis, Insights and Forecast - by End-User
- 8.4.1. Insurance Companies
- 8.4.2. Government Agencies
- 8.4.3. Third-pa
- 8.1. Market Analysis, Insights and Forecast - by Component
- 9. Rest of the World Insurance Analytics Market Analysis, Insights and Forecast, 2019-2031
- 9.1. Market Analysis, Insights and Forecast - by Component
- 9.1.1. Tool
- 9.1.2. Services
- 9.2. Market Analysis, Insights and Forecast - by Business Application (Qualitative Analysis)
- 9.2.1. Claims Management
- 9.2.2. Risk Management
- 9.2.3. Process Optimization
- 9.2.4. Customer Management and Personalization
- 9.3. Market Analysis, Insights and Forecast - by Deployment Mode
- 9.3.1. On-premise
- 9.3.2. Cloud
- 9.4. Market Analysis, Insights and Forecast - by End-User
- 9.4.1. Insurance Companies
- 9.4.2. Government Agencies
- 9.4.3. Third-pa
- 9.1. Market Analysis, Insights and Forecast - by Component
- 10. North America Insurance Analytics Market Analysis, Insights and Forecast, 2019-2031
- 10.1. Market Analysis, Insights and Forecast - By Country/Sub-region
- 10.1.1 United States
- 10.1.2 Canada
- 10.1.3 Mexico
- 11. Europe Insurance Analytics Market Analysis, Insights and Forecast, 2019-2031
- 11.1. Market Analysis, Insights and Forecast - By Country/Sub-region
- 11.1.1 Germany
- 11.1.2 United Kingdom
- 11.1.3 France
- 11.1.4 Spain
- 11.1.5 Italy
- 11.1.6 Spain
- 11.1.7 Belgium
- 11.1.8 Netherland
- 11.1.9 Nordics
- 11.1.10 Rest of Europe
- 12. Asia Pacific Insurance Analytics Market Analysis, Insights and Forecast, 2019-2031
- 12.1. Market Analysis, Insights and Forecast - By Country/Sub-region
- 12.1.1 China
- 12.1.2 Japan
- 12.1.3 India
- 12.1.4 South Korea
- 12.1.5 Southeast Asia
- 12.1.6 Australia
- 12.1.7 Indonesia
- 12.1.8 Phillipes
- 12.1.9 Singapore
- 12.1.10 Thailandc
- 12.1.11 Rest of Asia Pacific
- 13. South America Insurance Analytics Market Analysis, Insights and Forecast, 2019-2031
- 13.1. Market Analysis, Insights and Forecast - By Country/Sub-region
- 13.1.1 Brazil
- 13.1.2 Argentina
- 13.1.3 Peru
- 13.1.4 Chile
- 13.1.5 Colombia
- 13.1.6 Ecuador
- 13.1.7 Venezuela
- 13.1.8 Rest of South America
- 14. North America Insurance Analytics Market Analysis, Insights and Forecast, 2019-2031
- 14.1. Market Analysis, Insights and Forecast - By Country/Sub-region
- 14.1.1 United States
- 14.1.2 Canada
- 14.1.3 Mexico
- 15. MEA Insurance Analytics Market Analysis, Insights and Forecast, 2019-2031
- 15.1. Market Analysis, Insights and Forecast - By Country/Sub-region
- 15.1.1 United Arab Emirates
- 15.1.2 Saudi Arabia
- 15.1.3 South Africa
- 15.1.4 Rest of Middle East and Africa
- 16. Competitive Analysis
- 16.1. Global Market Share Analysis 2024
- 16.2. Company Profiles
- 16.2.1 Sapiens International Corporation*List Not Exhaustive
- 16.2.1.1. Overview
- 16.2.1.2. Products
- 16.2.1.3. SWOT Analysis
- 16.2.1.4. Recent Developments
- 16.2.1.5. Financials (Based on Availability)
- 16.2.2 Hexaware Technologies Limited
- 16.2.2.1. Overview
- 16.2.2.2. Products
- 16.2.2.3. SWOT Analysis
- 16.2.2.4. Recent Developments
- 16.2.2.5. Financials (Based on Availability)
- 16.2.3 OpenText Corporation
- 16.2.3.1. Overview
- 16.2.3.2. Products
- 16.2.3.3. SWOT Analysis
- 16.2.3.4. Recent Developments
- 16.2.3.5. Financials (Based on Availability)
- 16.2.4 IBM Corporation
- 16.2.4.1. Overview
- 16.2.4.2. Products
- 16.2.4.3. SWOT Analysis
- 16.2.4.4. Recent Developments
- 16.2.4.5. Financials (Based on Availability)
- 16.2.5 Applied Systems Inc
- 16.2.5.1. Overview
- 16.2.5.2. Products
- 16.2.5.3. SWOT Analysis
- 16.2.5.4. Recent Developments
- 16.2.5.5. Financials (Based on Availability)
- 16.2.6 MicroStrategy Incorporated
- 16.2.6.1. Overview
- 16.2.6.2. Products
- 16.2.6.3. SWOT Analysis
- 16.2.6.4. Recent Developments
- 16.2.6.5. Financials (Based on Availability)
- 16.2.7 Guidewire Software Inc
- 16.2.7.1. Overview
- 16.2.7.2. Products
- 16.2.7.3. SWOT Analysis
- 16.2.7.4. Recent Developments
- 16.2.7.5. Financials (Based on Availability)
- 16.2.8 Microsoft Corporation
- 16.2.8.1. Overview
- 16.2.8.2. Products
- 16.2.8.3. SWOT Analysis
- 16.2.8.4. Recent Developments
- 16.2.8.5. Financials (Based on Availability)
- 16.2.9 Oracle Corporation
- 16.2.9.1. Overview
- 16.2.9.2. Products
- 16.2.9.3. SWOT Analysis
- 16.2.9.4. Recent Developments
- 16.2.9.5. Financials (Based on Availability)
- 16.2.10 LexisNexis Risk Solutions
- 16.2.10.1. Overview
- 16.2.10.2. Products
- 16.2.10.3. SWOT Analysis
- 16.2.10.4. Recent Developments
- 16.2.10.5. Financials (Based on Availability)
- 16.2.1 Sapiens International Corporation*List Not Exhaustive
List of Figures
- Figure 1: Global Insurance Analytics Market Revenue Breakdown (Million, %) by Region 2024 & 2032
- Figure 2: North America Insurance Analytics Market Revenue (Million), by Country 2024 & 2032
- Figure 3: North America Insurance Analytics Market Revenue Share (%), by Country 2024 & 2032
- Figure 4: Europe Insurance Analytics Market Revenue (Million), by Country 2024 & 2032
- Figure 5: Europe Insurance Analytics Market Revenue Share (%), by Country 2024 & 2032
- Figure 6: Asia Pacific Insurance Analytics Market Revenue (Million), by Country 2024 & 2032
- Figure 7: Asia Pacific Insurance Analytics Market Revenue Share (%), by Country 2024 & 2032
- Figure 8: South America Insurance Analytics Market Revenue (Million), by Country 2024 & 2032
- Figure 9: South America Insurance Analytics Market Revenue Share (%), by Country 2024 & 2032
- Figure 10: North America Insurance Analytics Market Revenue (Million), by Country 2024 & 2032
- Figure 11: North America Insurance Analytics Market Revenue Share (%), by Country 2024 & 2032
- Figure 12: MEA Insurance Analytics Market Revenue (Million), by Country 2024 & 2032
- Figure 13: MEA Insurance Analytics Market Revenue Share (%), by Country 2024 & 2032
- Figure 14: North America Insurance Analytics Market Revenue (Million), by Component 2024 & 2032
- Figure 15: North America Insurance Analytics Market Revenue Share (%), by Component 2024 & 2032
- Figure 16: North America Insurance Analytics Market Revenue (Million), by Business Application (Qualitative Analysis) 2024 & 2032
- Figure 17: North America Insurance Analytics Market Revenue Share (%), by Business Application (Qualitative Analysis) 2024 & 2032
- Figure 18: North America Insurance Analytics Market Revenue (Million), by Deployment Mode 2024 & 2032
- Figure 19: North America Insurance Analytics Market Revenue Share (%), by Deployment Mode 2024 & 2032
- Figure 20: North America Insurance Analytics Market Revenue (Million), by End-User 2024 & 2032
- Figure 21: North America Insurance Analytics Market Revenue Share (%), by End-User 2024 & 2032
- Figure 22: North America Insurance Analytics Market Revenue (Million), by Country 2024 & 2032
- Figure 23: North America Insurance Analytics Market Revenue Share (%), by Country 2024 & 2032
- Figure 24: Europe Insurance Analytics Market Revenue (Million), by Component 2024 & 2032
- Figure 25: Europe Insurance Analytics Market Revenue Share (%), by Component 2024 & 2032
- Figure 26: Europe Insurance Analytics Market Revenue (Million), by Business Application (Qualitative Analysis) 2024 & 2032
- Figure 27: Europe Insurance Analytics Market Revenue Share (%), by Business Application (Qualitative Analysis) 2024 & 2032
- Figure 28: Europe Insurance Analytics Market Revenue (Million), by Deployment Mode 2024 & 2032
- Figure 29: Europe Insurance Analytics Market Revenue Share (%), by Deployment Mode 2024 & 2032
- Figure 30: Europe Insurance Analytics Market Revenue (Million), by End-User 2024 & 2032
- Figure 31: Europe Insurance Analytics Market Revenue Share (%), by End-User 2024 & 2032
- Figure 32: Europe Insurance Analytics Market Revenue (Million), by Country 2024 & 2032
- Figure 33: Europe Insurance Analytics Market Revenue Share (%), by Country 2024 & 2032
- Figure 34: Asia Pacific Insurance Analytics Market Revenue (Million), by Component 2024 & 2032
- Figure 35: Asia Pacific Insurance Analytics Market Revenue Share (%), by Component 2024 & 2032
- Figure 36: Asia Pacific Insurance Analytics Market Revenue (Million), by Business Application (Qualitative Analysis) 2024 & 2032
- Figure 37: Asia Pacific Insurance Analytics Market Revenue Share (%), by Business Application (Qualitative Analysis) 2024 & 2032
- Figure 38: Asia Pacific Insurance Analytics Market Revenue (Million), by Deployment Mode 2024 & 2032
- Figure 39: Asia Pacific Insurance Analytics Market Revenue Share (%), by Deployment Mode 2024 & 2032
- Figure 40: Asia Pacific Insurance Analytics Market Revenue (Million), by End-User 2024 & 2032
- Figure 41: Asia Pacific Insurance Analytics Market Revenue Share (%), by End-User 2024 & 2032
- Figure 42: Asia Pacific Insurance Analytics Market Revenue (Million), by Country 2024 & 2032
- Figure 43: Asia Pacific Insurance Analytics Market Revenue Share (%), by Country 2024 & 2032
- Figure 44: Rest of the World Insurance Analytics Market Revenue (Million), by Component 2024 & 2032
- Figure 45: Rest of the World Insurance Analytics Market Revenue Share (%), by Component 2024 & 2032
- Figure 46: Rest of the World Insurance Analytics Market Revenue (Million), by Business Application (Qualitative Analysis) 2024 & 2032
- Figure 47: Rest of the World Insurance Analytics Market Revenue Share (%), by Business Application (Qualitative Analysis) 2024 & 2032
- Figure 48: Rest of the World Insurance Analytics Market Revenue (Million), by Deployment Mode 2024 & 2032
- Figure 49: Rest of the World Insurance Analytics Market Revenue Share (%), by Deployment Mode 2024 & 2032
- Figure 50: Rest of the World Insurance Analytics Market Revenue (Million), by End-User 2024 & 2032
- Figure 51: Rest of the World Insurance Analytics Market Revenue Share (%), by End-User 2024 & 2032
- Figure 52: Rest of the World Insurance Analytics Market Revenue (Million), by Country 2024 & 2032
- Figure 53: Rest of the World Insurance Analytics Market Revenue Share (%), by Country 2024 & 2032
List of Tables
- Table 1: Global Insurance Analytics Market Revenue Million Forecast, by Region 2019 & 2032
- Table 2: Global Insurance Analytics Market Revenue Million Forecast, by Component 2019 & 2032
- Table 3: Global Insurance Analytics Market Revenue Million Forecast, by Business Application (Qualitative Analysis) 2019 & 2032
- Table 4: Global Insurance Analytics Market Revenue Million Forecast, by Deployment Mode 2019 & 2032
- Table 5: Global Insurance Analytics Market Revenue Million Forecast, by End-User 2019 & 2032
- Table 6: Global Insurance Analytics Market Revenue Million Forecast, by Region 2019 & 2032
- Table 7: Global Insurance Analytics Market Revenue Million Forecast, by Country 2019 & 2032
- Table 8: United States Insurance Analytics Market Revenue (Million) Forecast, by Application 2019 & 2032
- Table 9: Canada Insurance Analytics Market Revenue (Million) Forecast, by Application 2019 & 2032
- Table 10: Mexico Insurance Analytics Market Revenue (Million) Forecast, by Application 2019 & 2032
- Table 11: Global Insurance Analytics Market Revenue Million Forecast, by Country 2019 & 2032
- Table 12: Germany Insurance Analytics Market Revenue (Million) Forecast, by Application 2019 & 2032
- Table 13: United Kingdom Insurance Analytics Market Revenue (Million) Forecast, by Application 2019 & 2032
- Table 14: France Insurance Analytics Market Revenue (Million) Forecast, by Application 2019 & 2032
- Table 15: Spain Insurance Analytics Market Revenue (Million) Forecast, by Application 2019 & 2032
- Table 16: Italy Insurance Analytics Market Revenue (Million) Forecast, by Application 2019 & 2032
- Table 17: Spain Insurance Analytics Market Revenue (Million) Forecast, by Application 2019 & 2032
- Table 18: Belgium Insurance Analytics Market Revenue (Million) Forecast, by Application 2019 & 2032
- Table 19: Netherland Insurance Analytics Market Revenue (Million) Forecast, by Application 2019 & 2032
- Table 20: Nordics Insurance Analytics Market Revenue (Million) Forecast, by Application 2019 & 2032
- Table 21: Rest of Europe Insurance Analytics Market Revenue (Million) Forecast, by Application 2019 & 2032
- Table 22: Global Insurance Analytics Market Revenue Million Forecast, by Country 2019 & 2032
- Table 23: China Insurance Analytics Market Revenue (Million) Forecast, by Application 2019 & 2032
- Table 24: Japan Insurance Analytics Market Revenue (Million) Forecast, by Application 2019 & 2032
- Table 25: India Insurance Analytics Market Revenue (Million) Forecast, by Application 2019 & 2032
- Table 26: South Korea Insurance Analytics Market Revenue (Million) Forecast, by Application 2019 & 2032
- Table 27: Southeast Asia Insurance Analytics Market Revenue (Million) Forecast, by Application 2019 & 2032
- Table 28: Australia Insurance Analytics Market Revenue (Million) Forecast, by Application 2019 & 2032
- Table 29: Indonesia Insurance Analytics Market Revenue (Million) Forecast, by Application 2019 & 2032
- Table 30: Phillipes Insurance Analytics Market Revenue (Million) Forecast, by Application 2019 & 2032
- Table 31: Singapore Insurance Analytics Market Revenue (Million) Forecast, by Application 2019 & 2032
- Table 32: Thailandc Insurance Analytics Market Revenue (Million) Forecast, by Application 2019 & 2032
- Table 33: Rest of Asia Pacific Insurance Analytics Market Revenue (Million) Forecast, by Application 2019 & 2032
- Table 34: Global Insurance Analytics Market Revenue Million Forecast, by Country 2019 & 2032
- Table 35: Brazil Insurance Analytics Market Revenue (Million) Forecast, by Application 2019 & 2032
- Table 36: Argentina Insurance Analytics Market Revenue (Million) Forecast, by Application 2019 & 2032
- Table 37: Peru Insurance Analytics Market Revenue (Million) Forecast, by Application 2019 & 2032
- Table 38: Chile Insurance Analytics Market Revenue (Million) Forecast, by Application 2019 & 2032
- Table 39: Colombia Insurance Analytics Market Revenue (Million) Forecast, by Application 2019 & 2032
- Table 40: Ecuador Insurance Analytics Market Revenue (Million) Forecast, by Application 2019 & 2032
- Table 41: Venezuela Insurance Analytics Market Revenue (Million) Forecast, by Application 2019 & 2032
- Table 42: Rest of South America Insurance Analytics Market Revenue (Million) Forecast, by Application 2019 & 2032
- Table 43: Global Insurance Analytics Market Revenue Million Forecast, by Country 2019 & 2032
- Table 44: United States Insurance Analytics Market Revenue (Million) Forecast, by Application 2019 & 2032
- Table 45: Canada Insurance Analytics Market Revenue (Million) Forecast, by Application 2019 & 2032
- Table 46: Mexico Insurance Analytics Market Revenue (Million) Forecast, by Application 2019 & 2032
- Table 47: Global Insurance Analytics Market Revenue Million Forecast, by Country 2019 & 2032
- Table 48: United Arab Emirates Insurance Analytics Market Revenue (Million) Forecast, by Application 2019 & 2032
- Table 49: Saudi Arabia Insurance Analytics Market Revenue (Million) Forecast, by Application 2019 & 2032
- Table 50: South Africa Insurance Analytics Market Revenue (Million) Forecast, by Application 2019 & 2032
- Table 51: Rest of Middle East and Africa Insurance Analytics Market Revenue (Million) Forecast, by Application 2019 & 2032
- Table 52: Global Insurance Analytics Market Revenue Million Forecast, by Component 2019 & 2032
- Table 53: Global Insurance Analytics Market Revenue Million Forecast, by Business Application (Qualitative Analysis) 2019 & 2032
- Table 54: Global Insurance Analytics Market Revenue Million Forecast, by Deployment Mode 2019 & 2032
- Table 55: Global Insurance Analytics Market Revenue Million Forecast, by End-User 2019 & 2032
- Table 56: Global Insurance Analytics Market Revenue Million Forecast, by Country 2019 & 2032
- Table 57: Global Insurance Analytics Market Revenue Million Forecast, by Component 2019 & 2032
- Table 58: Global Insurance Analytics Market Revenue Million Forecast, by Business Application (Qualitative Analysis) 2019 & 2032
- Table 59: Global Insurance Analytics Market Revenue Million Forecast, by Deployment Mode 2019 & 2032
- Table 60: Global Insurance Analytics Market Revenue Million Forecast, by End-User 2019 & 2032
- Table 61: Global Insurance Analytics Market Revenue Million Forecast, by Country 2019 & 2032
- Table 62: Global Insurance Analytics Market Revenue Million Forecast, by Component 2019 & 2032
- Table 63: Global Insurance Analytics Market Revenue Million Forecast, by Business Application (Qualitative Analysis) 2019 & 2032
- Table 64: Global Insurance Analytics Market Revenue Million Forecast, by Deployment Mode 2019 & 2032
- Table 65: Global Insurance Analytics Market Revenue Million Forecast, by End-User 2019 & 2032
- Table 66: Global Insurance Analytics Market Revenue Million Forecast, by Country 2019 & 2032
- Table 67: Global Insurance Analytics Market Revenue Million Forecast, by Component 2019 & 2032
- Table 68: Global Insurance Analytics Market Revenue Million Forecast, by Business Application (Qualitative Analysis) 2019 & 2032
- Table 69: Global Insurance Analytics Market Revenue Million Forecast, by Deployment Mode 2019 & 2032
- Table 70: Global Insurance Analytics Market Revenue Million Forecast, by End-User 2019 & 2032
- Table 71: Global Insurance Analytics Market Revenue Million Forecast, by Country 2019 & 2032
Frequently Asked Questions
1. What is the projected Compound Annual Growth Rate (CAGR) of the Insurance Analytics Market?
The projected CAGR is approximately 15.90%.
2. Which companies are prominent players in the Insurance Analytics Market?
Key companies in the market include Sapiens International Corporation*List Not Exhaustive, Hexaware Technologies Limited, OpenText Corporation, IBM Corporation, Applied Systems Inc, MicroStrategy Incorporated, Guidewire Software Inc, Microsoft Corporation, Oracle Corporation, LexisNexis Risk Solutions.
3. What are the main segments of the Insurance Analytics Market?
The market segments include Component, Business Application (Qualitative Analysis), Deployment Mode, End-User.
4. Can you provide details about the market size?
The market size is estimated to be USD 11.47 Million as of 2022.
5. What are some drivers contributing to market growth?
Increased Adoption of Advanced Technologies; Rise in Competition among the Insurance Sector.
6. What are the notable trends driving market growth?
Increasing Risks And Fraudulent Activities Are Boosting the Adoption Of Insurance Analytics..
7. Are there any restraints impacting market growth?
Stringent Government Regulations; Privacy and Security Concern.
8. Can you provide examples of recent developments in the market?
April 2023 - Guidewire launched the Garmisch solution to provide developers with more self-service tools on the Guidewire Cloud Console. Insurance companies can easily create and implement seamless, digital claims experiences using this solution. With ready-to-use bulk data connectors from top global data platforms, Garmisch reduces the time it takes for an organization to gain insight.
9. What pricing options are available for accessing the report?
Pricing options include single-user, multi-user, and enterprise licenses priced at USD 4750, USD 5250, and USD 8750 respectively.
10. Is the market size provided in terms of value or volume?
The market size is provided in terms of value, measured in Million.
11. Are there any specific market keywords associated with the report?
Yes, the market keyword associated with the report is "Insurance Analytics Market," which aids in identifying and referencing the specific market segment covered.
12. How do I determine which pricing option suits my needs best?
The pricing options vary based on user requirements and access needs. Individual users may opt for single-user licenses, while businesses requiring broader access may choose multi-user or enterprise licenses for cost-effective access to the report.
13. Are there any additional resources or data provided in the Insurance Analytics Market report?
While the report offers comprehensive insights, it's advisable to review the specific contents or supplementary materials provided to ascertain if additional resources or data are available.
14. How can I stay updated on further developments or reports in the Insurance Analytics Market?
To stay informed about further developments, trends, and reports in the Insurance Analytics Market, consider subscribing to industry newsletters, following relevant companies and organizations, or regularly checking reputable industry news sources and publications.
Methodology
Step 1 - Identification of Relevant Samples Size from Population Database


Step 2 - Approaches for Defining Global Market Size (Value, Volume* & Price*)

Note*: In applicable scenarios
Step 3 - Data Sources
Primary Research
- Web Analytics
- Survey Reports
- Research Institute
- Latest Research Reports
- Opinion Leaders
Secondary Research
- Annual Reports
- White Paper
- Latest Press Release
- Industry Association
- Paid Database
- Investor Presentations

Step 4 - Data Triangulation
Involves using different sources of information in order to increase the validity of a study
These sources are likely to be stakeholders in a program - participants, other researchers, program staff, other community members, and so on.
Then we put all data in single framework & apply various statistical tools to find out the dynamic on the market.
During the analysis stage, feedback from the stakeholder groups would be compared to determine areas of agreement as well as areas of divergence


