
Key Insights
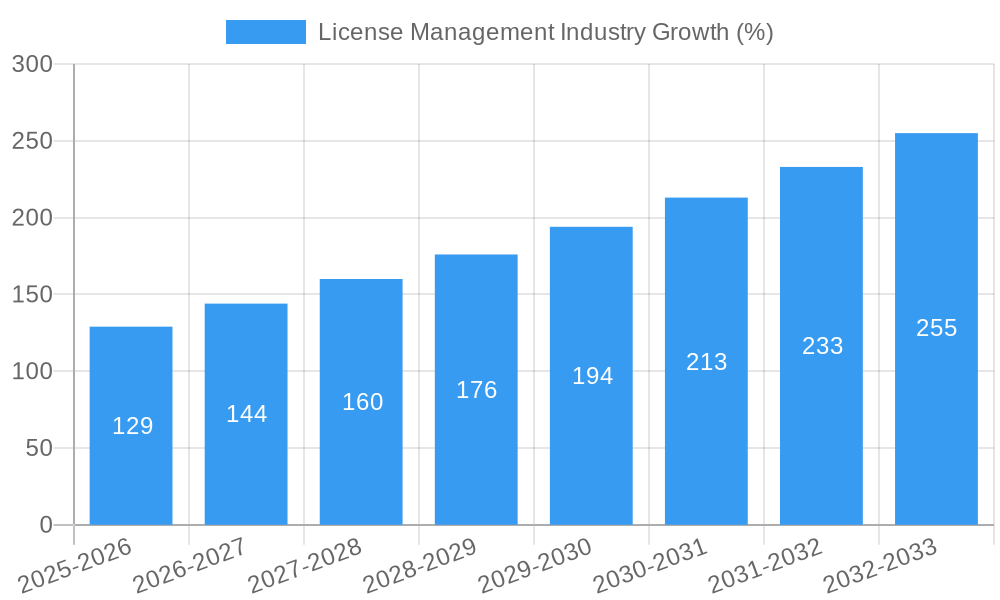
The global license management market, valued at $1.29 billion in 2025, is poised for robust growth, exhibiting a compound annual growth rate (CAGR) of 10.06% from 2025 to 2033. This expansion is driven by several key factors. The increasing complexity of software licensing agreements across diverse enterprise applications necessitates sophisticated management solutions. Organizations are increasingly adopting cloud-based deployment models, fueling demand for license management solutions capable of handling hybrid and multi-cloud environments. Furthermore, stringent regulatory compliance requirements in sectors like BFSI (Banking, Financial Services, and Insurance) and healthcare are driving adoption. The rising need for operational efficiency, cost optimization, and enhanced security are also significant contributors. Software-based solutions hold a significant share of the market, owing to their flexibility and scalability. However, the on-premise segment retains a substantial presence due to existing infrastructure and security concerns within specific organizations. The BFSI and IT & Telecommunication sectors are major end-user segments, given their extensive software portfolios and regulatory pressure. Advisory services are emerging as a crucial component of the market, focusing on optimization and compliance support.
The market's growth trajectory is expected to remain positive throughout the forecast period (2025-2033). Continued digital transformation initiatives across various industries will further accelerate demand. While challenges such as the initial investment costs associated with implementing license management solutions may pose some restraints, the long-term benefits of reduced software costs, improved compliance, and enhanced security are expected to outweigh these challenges. Key players in the market are focusing on innovation, strategic partnerships, and mergers & acquisitions to strengthen their market position and expand their product offerings. The competitive landscape is characterized by both established players and emerging niche providers, resulting in a dynamic and evolving market structure. Future growth will likely be influenced by technological advancements such as AI-driven license optimization and the increasing adoption of SaaS-based license management platforms.

License Management Industry Market Report: 2019-2033
This comprehensive report provides a detailed analysis of the License Management industry, offering invaluable insights for industry professionals, investors, and strategic planners. The study period covers 2019-2033, with a base year of 2025 and a forecast period of 2025-2033. The report projects a market size exceeding $XX Million by 2033, presenting a compelling growth opportunity within this dynamic sector.
License Management Industry Market Structure & Innovation Trends
The License Management market exhibits a moderately concentrated structure, with key players like Flexera Software LLC, IBM Corporation, and ServiceNow Inc. holding significant market share. However, several other companies including Thales Group, Cherwell Software LLC, USU Software AG, DXC Technology Co, Snow Software AB, Oracle Corporation, and Reprise Software Inc. contribute to the competitive landscape. The market share of these companies varies, with Flexera Software and IBM estimated to hold xx% and xx% respectively (2024 data) while the remainder of the market is shared amongst other participants. Innovation in this space is driven by factors such as increasing software complexity, stringent compliance requirements, and the rise of cloud computing. Recent mergers and acquisitions (M&A) activities, such as the acquisition of Reprise Software in January 2022, indicate industry consolidation and strategic investments aimed at enhancing capabilities and market reach. M&A deal values in the recent past have averaged approximately $XX Million, reflecting the strategic importance of this sector. The regulatory framework around software licensing varies across jurisdictions, impacting market dynamics and requiring companies to adapt their strategies accordingly. Product substitutes, while limited, include open-source license management tools and custom-built internal solutions; however, these generally lack the robustness and scalability of commercial offerings. The end-user demographics are diverse, spanning multiple sectors with a high demand in BFSI, Healthcare and Life Sciences, IT and Telecommunication.
License Management Industry Market Dynamics & Trends
The License Management market is experiencing robust growth, driven by several key factors. The increasing adoption of cloud-based software solutions necessitates robust license management capabilities. Furthermore, the growing complexity of software licensing agreements is driving demand for specialized tools and services. Technological disruptions, such as the rise of artificial intelligence (AI) and machine learning (ML) in license optimization, are transforming the market landscape. Changing consumer preferences, with a focus on efficient and secure software management, are shaping vendor strategies. The market is characterized by intense competition, with established players constantly innovating to maintain their market share and new entrants attempting to carve a niche for themselves. The Compound Annual Growth Rate (CAGR) for the forecast period (2025-2033) is projected to be xx%, indicating significant market expansion. Market penetration remains relatively low in some segments, indicating substantial growth potential.
Dominant Regions & Segments in License Management Industry
The North American region currently dominates the License Management market, driven by high software adoption rates, a strong regulatory framework, and significant investments in technology. However, the Asia-Pacific region is experiencing rapid growth due to increasing digitalization and economic development.
- By Component: The software segment holds a larger market share compared to the services segment due to the higher initial investment in software licenses.
- By Deployment: The cloud deployment model is gaining significant traction, surpassing on-premise deployments due to its scalability, flexibility, and cost-effectiveness.
- By Application: License Entitlement and Optimization, Compliance Management and Audit Services are high-growth areas demonstrating a shift towards proactive management of software licenses.
- By End User: BFSI and IT & Telecommunication sectors currently lead in license management adoption, owing to their large IT infrastructure and stringent compliance needs.
Key drivers include supportive government policies, robust IT infrastructure, and the presence of major technology hubs. Europe also holds a substantial market share driven by similar factors.
License Management Industry Product Innovations
Recent product innovations within the License Management industry focus on integrating AI and ML capabilities to automate tasks, improve accuracy, and provide more insightful analytics. Cloud-based solutions are increasingly incorporating features such as automated license discovery, compliance monitoring, and cost optimization tools. These advancements improve efficiency and reduce operational burdens for organizations. Key competitive advantages are derived from superior user interfaces, robust reporting capabilities, seamless integrations with other enterprise software, and a comprehensive suite of services.
Report Scope & Segmentation Analysis
This report provides a detailed segmentation analysis of the License Management market across various parameters:
- By Component: Software and Services, with projected market sizes of $XX Million and $XX Million respectively by 2033.
- By Deployment: On-premise and Cloud, with cloud deployment showing faster growth.
- By Application: Audit Services, Advisory Services, Compliance Management, License Entitlement and Optimization, Operations and Analytics, and Other Applications, each exhibiting distinct growth trajectories.
- By End User: BFSI, Healthcare and Life Sciences, IT and Telecommunication, Media and Entertainment, and Other End Users, with varying adoption rates and growth potentials. Each segment's competitive landscape differs based on industry-specific needs and regulatory demands.
Key Drivers of License Management Industry Growth
The License Management industry is fueled by the increasing complexity of software licensing, stringent regulatory compliance mandates (e.g., GDPR, CCPA), rising adoption of cloud-based solutions and the need for cost optimization. The growing volume of software licenses across organizations necessitates efficient management tools. Technological advancements like AI and ML further enhance efficiency and accuracy, driving market expansion.
Challenges in the License Management Industry Sector
The License Management industry faces challenges such as the integration complexity with diverse software environments, the need for continuous updates to address evolving regulatory landscapes, and intense competition. Supply chain disruptions can also impact the availability of essential components, potentially hindering growth. Furthermore, high initial investment costs and the requirement of specialized skills for implementation can limit market penetration in certain segments.
Emerging Opportunities in License Management Industry
Emerging opportunities lie in leveraging advanced analytics for better insights into license usage and cost optimization, integrating with emerging technologies such as blockchain for secure license management and expanding into underpenetrated markets, particularly in developing economies. The growing adoption of SaaS and PaaS models presents a significant growth opportunity for the sector.
Leading Players in the License Management Industry Market
- Flexera Software LLC
- IBM Corporation
- ServiceNow Inc
- Thales Group
- Cherwell Software LLC
- USU Software AG
- DXC Technology Co
- Snow Software AB
- Oracle Corporation
- Reprise Software Inc
Key Developments in License Management Industry
- January 2022: Reprise Software, inventors of the Reprise License Management (RLM) solution, was acquired by FOG Software Group, an operational group of Vela Software, and Constellation Software Inc. This acquisition significantly strengthened FOG Software Group’s position in the market.
- February 2022: Thales collaborated with Lantronix Inc. and Taoglas to develop and deliver application-specific smart industrial IoT solutions. This collaboration broadened Thales' reach within the IoT sector and highlighted the growing importance of license management in connected devices.
Future Outlook for License Management Industry Market
The future outlook for the License Management industry is extremely positive, driven by sustained growth in software adoption, increased regulatory scrutiny, and ongoing technological innovation. The market is expected to continue expanding at a healthy rate, with significant opportunities for both established players and new entrants. Strategic investments in R&D, expansion into new markets and the development of innovative solutions will be crucial for success in this dynamic sector.
License Management Industry Segmentation
-
1. Component
- 1.1. Software
- 1.2. Services
-
2. Deployment
- 2.1. On-premise
- 2.2. Cloud
-
3. Application (Qualitative Trend Analysis)
- 3.1. Audit Services
- 3.2. Advisory Services
- 3.3. Compliance Management
- 3.4. License Entitlement and Optimization
- 3.5. Operations and Analytics
- 3.6. Other Applications
-
4. End User
- 4.1. BFSI
- 4.2. Healthcare and Life Sciences
- 4.3. IT and Telecommunication
- 4.4. Media and Entertainment
- 4.5. Other End Users
License Management Industry Segmentation By Geography
- 1. North America
- 2. Europe
- 3. Asia
- 4. Australia and New Zealand
- 5. Latin America
- 6. Middle East and Africa

License Management Industry REPORT HIGHLIGHTS
| Aspects | Details |
|---|---|
| Study Period | 2019-2033 |
| Base Year | 2024 |
| Estimated Year | 2025 |
| Forecast Period | 2025-2033 |
| Historical Period | 2019-2024 |
| Growth Rate | CAGR of 10.06% from 2019-2033 |
| Segmentation |
|
Table of Contents
- 1. Introduction
- 1.1. Research Scope
- 1.2. Market Segmentation
- 1.3. Research Methodology
- 1.4. Definitions and Assumptions
- 2. Executive Summary
- 2.1. Introduction
- 3. Market Dynamics
- 3.1. Introduction
- 3.2. Market Drivers
- 3.2.1. Increasing Demand to Optimize Software Investments; Growing Requirement for Audit-readiness among Organizations
- 3.3. Market Restrains
- 3.3.1. Uncertain Regulatory Standards and Frameworks
- 3.4. Market Trends
- 3.4.1. Healthcare Segment to Drive Market Growth
- 4. Market Factor Analysis
- 4.1. Porters Five Forces
- 4.2. Supply/Value Chain
- 4.3. PESTEL analysis
- 4.4. Market Entropy
- 4.5. Patent/Trademark Analysis
- 5. Global License Management Industry Analysis, Insights and Forecast, 2019-2031
- 5.1. Market Analysis, Insights and Forecast - by Component
- 5.1.1. Software
- 5.1.2. Services
- 5.2. Market Analysis, Insights and Forecast - by Deployment
- 5.2.1. On-premise
- 5.2.2. Cloud
- 5.3. Market Analysis, Insights and Forecast - by Application (Qualitative Trend Analysis)
- 5.3.1. Audit Services
- 5.3.2. Advisory Services
- 5.3.3. Compliance Management
- 5.3.4. License Entitlement and Optimization
- 5.3.5. Operations and Analytics
- 5.3.6. Other Applications
- 5.4. Market Analysis, Insights and Forecast - by End User
- 5.4.1. BFSI
- 5.4.2. Healthcare and Life Sciences
- 5.4.3. IT and Telecommunication
- 5.4.4. Media and Entertainment
- 5.4.5. Other End Users
- 5.5. Market Analysis, Insights and Forecast - by Region
- 5.5.1. North America
- 5.5.2. Europe
- 5.5.3. Asia
- 5.5.4. Australia and New Zealand
- 5.5.5. Latin America
- 5.5.6. Middle East and Africa
- 5.1. Market Analysis, Insights and Forecast - by Component
- 6. North America License Management Industry Analysis, Insights and Forecast, 2019-2031
- 6.1. Market Analysis, Insights and Forecast - by Component
- 6.1.1. Software
- 6.1.2. Services
- 6.2. Market Analysis, Insights and Forecast - by Deployment
- 6.2.1. On-premise
- 6.2.2. Cloud
- 6.3. Market Analysis, Insights and Forecast - by Application (Qualitative Trend Analysis)
- 6.3.1. Audit Services
- 6.3.2. Advisory Services
- 6.3.3. Compliance Management
- 6.3.4. License Entitlement and Optimization
- 6.3.5. Operations and Analytics
- 6.3.6. Other Applications
- 6.4. Market Analysis, Insights and Forecast - by End User
- 6.4.1. BFSI
- 6.4.2. Healthcare and Life Sciences
- 6.4.3. IT and Telecommunication
- 6.4.4. Media and Entertainment
- 6.4.5. Other End Users
- 6.1. Market Analysis, Insights and Forecast - by Component
- 7. Europe License Management Industry Analysis, Insights and Forecast, 2019-2031
- 7.1. Market Analysis, Insights and Forecast - by Component
- 7.1.1. Software
- 7.1.2. Services
- 7.2. Market Analysis, Insights and Forecast - by Deployment
- 7.2.1. On-premise
- 7.2.2. Cloud
- 7.3. Market Analysis, Insights and Forecast - by Application (Qualitative Trend Analysis)
- 7.3.1. Audit Services
- 7.3.2. Advisory Services
- 7.3.3. Compliance Management
- 7.3.4. License Entitlement and Optimization
- 7.3.5. Operations and Analytics
- 7.3.6. Other Applications
- 7.4. Market Analysis, Insights and Forecast - by End User
- 7.4.1. BFSI
- 7.4.2. Healthcare and Life Sciences
- 7.4.3. IT and Telecommunication
- 7.4.4. Media and Entertainment
- 7.4.5. Other End Users
- 7.1. Market Analysis, Insights and Forecast - by Component
- 8. Asia License Management Industry Analysis, Insights and Forecast, 2019-2031
- 8.1. Market Analysis, Insights and Forecast - by Component
- 8.1.1. Software
- 8.1.2. Services
- 8.2. Market Analysis, Insights and Forecast - by Deployment
- 8.2.1. On-premise
- 8.2.2. Cloud
- 8.3. Market Analysis, Insights and Forecast - by Application (Qualitative Trend Analysis)
- 8.3.1. Audit Services
- 8.3.2. Advisory Services
- 8.3.3. Compliance Management
- 8.3.4. License Entitlement and Optimization
- 8.3.5. Operations and Analytics
- 8.3.6. Other Applications
- 8.4. Market Analysis, Insights and Forecast - by End User
- 8.4.1. BFSI
- 8.4.2. Healthcare and Life Sciences
- 8.4.3. IT and Telecommunication
- 8.4.4. Media and Entertainment
- 8.4.5. Other End Users
- 8.1. Market Analysis, Insights and Forecast - by Component
- 9. Australia and New Zealand License Management Industry Analysis, Insights and Forecast, 2019-2031
- 9.1. Market Analysis, Insights and Forecast - by Component
- 9.1.1. Software
- 9.1.2. Services
- 9.2. Market Analysis, Insights and Forecast - by Deployment
- 9.2.1. On-premise
- 9.2.2. Cloud
- 9.3. Market Analysis, Insights and Forecast - by Application (Qualitative Trend Analysis)
- 9.3.1. Audit Services
- 9.3.2. Advisory Services
- 9.3.3. Compliance Management
- 9.3.4. License Entitlement and Optimization
- 9.3.5. Operations and Analytics
- 9.3.6. Other Applications
- 9.4. Market Analysis, Insights and Forecast - by End User
- 9.4.1. BFSI
- 9.4.2. Healthcare and Life Sciences
- 9.4.3. IT and Telecommunication
- 9.4.4. Media and Entertainment
- 9.4.5. Other End Users
- 9.1. Market Analysis, Insights and Forecast - by Component
- 10. Latin America License Management Industry Analysis, Insights and Forecast, 2019-2031
- 10.1. Market Analysis, Insights and Forecast - by Component
- 10.1.1. Software
- 10.1.2. Services
- 10.2. Market Analysis, Insights and Forecast - by Deployment
- 10.2.1. On-premise
- 10.2.2. Cloud
- 10.3. Market Analysis, Insights and Forecast - by Application (Qualitative Trend Analysis)
- 10.3.1. Audit Services
- 10.3.2. Advisory Services
- 10.3.3. Compliance Management
- 10.3.4. License Entitlement and Optimization
- 10.3.5. Operations and Analytics
- 10.3.6. Other Applications
- 10.4. Market Analysis, Insights and Forecast - by End User
- 10.4.1. BFSI
- 10.4.2. Healthcare and Life Sciences
- 10.4.3. IT and Telecommunication
- 10.4.4. Media and Entertainment
- 10.4.5. Other End Users
- 10.1. Market Analysis, Insights and Forecast - by Component
- 11. Middle East and Africa License Management Industry Analysis, Insights and Forecast, 2019-2031
- 11.1. Market Analysis, Insights and Forecast - by Component
- 11.1.1. Software
- 11.1.2. Services
- 11.2. Market Analysis, Insights and Forecast - by Deployment
- 11.2.1. On-premise
- 11.2.2. Cloud
- 11.3. Market Analysis, Insights and Forecast - by Application (Qualitative Trend Analysis)
- 11.3.1. Audit Services
- 11.3.2. Advisory Services
- 11.3.3. Compliance Management
- 11.3.4. License Entitlement and Optimization
- 11.3.5. Operations and Analytics
- 11.3.6. Other Applications
- 11.4. Market Analysis, Insights and Forecast - by End User
- 11.4.1. BFSI
- 11.4.2. Healthcare and Life Sciences
- 11.4.3. IT and Telecommunication
- 11.4.4. Media and Entertainment
- 11.4.5. Other End Users
- 11.1. Market Analysis, Insights and Forecast - by Component
- 12. North America License Management Industry Analysis, Insights and Forecast, 2019-2031
- 12.1. Market Analysis, Insights and Forecast - By Country/Sub-region
- 12.1.1.
- 13. Europe License Management Industry Analysis, Insights and Forecast, 2019-2031
- 13.1. Market Analysis, Insights and Forecast - By Country/Sub-region
- 13.1.1.
- 14. Asia Pacific License Management Industry Analysis, Insights and Forecast, 2019-2031
- 14.1. Market Analysis, Insights and Forecast - By Country/Sub-region
- 14.1.1.
- 15. Latin America License Management Industry Analysis, Insights and Forecast, 2019-2031
- 15.1. Market Analysis, Insights and Forecast - By Country/Sub-region
- 15.1.1.
- 16. Middle East and Africa License Management Industry Analysis, Insights and Forecast, 2019-2031
- 16.1. Market Analysis, Insights and Forecast - By Country/Sub-region
- 16.1.1.
- 17. Competitive Analysis
- 17.1. Global Market Share Analysis 2024
- 17.2. Company Profiles
- 17.2.1 Flexera Software LLC
- 17.2.1.1. Overview
- 17.2.1.2. Products
- 17.2.1.3. SWOT Analysis
- 17.2.1.4. Recent Developments
- 17.2.1.5. Financials (Based on Availability)
- 17.2.2 IBM Corporation
- 17.2.2.1. Overview
- 17.2.2.2. Products
- 17.2.2.3. SWOT Analysis
- 17.2.2.4. Recent Developments
- 17.2.2.5. Financials (Based on Availability)
- 17.2.3 ServiceNow Inc *List Not Exhaustive
- 17.2.3.1. Overview
- 17.2.3.2. Products
- 17.2.3.3. SWOT Analysis
- 17.2.3.4. Recent Developments
- 17.2.3.5. Financials (Based on Availability)
- 17.2.4 Thales Group
- 17.2.4.1. Overview
- 17.2.4.2. Products
- 17.2.4.3. SWOT Analysis
- 17.2.4.4. Recent Developments
- 17.2.4.5. Financials (Based on Availability)
- 17.2.5 Cherwell Software LLC
- 17.2.5.1. Overview
- 17.2.5.2. Products
- 17.2.5.3. SWOT Analysis
- 17.2.5.4. Recent Developments
- 17.2.5.5. Financials (Based on Availability)
- 17.2.6 USU Software AG
- 17.2.6.1. Overview
- 17.2.6.2. Products
- 17.2.6.3. SWOT Analysis
- 17.2.6.4. Recent Developments
- 17.2.6.5. Financials (Based on Availability)
- 17.2.7 DXC Technology Co
- 17.2.7.1. Overview
- 17.2.7.2. Products
- 17.2.7.3. SWOT Analysis
- 17.2.7.4. Recent Developments
- 17.2.7.5. Financials (Based on Availability)
- 17.2.8 Snow Software AB
- 17.2.8.1. Overview
- 17.2.8.2. Products
- 17.2.8.3. SWOT Analysis
- 17.2.8.4. Recent Developments
- 17.2.8.5. Financials (Based on Availability)
- 17.2.9 Oracle Corporation
- 17.2.9.1. Overview
- 17.2.9.2. Products
- 17.2.9.3. SWOT Analysis
- 17.2.9.4. Recent Developments
- 17.2.9.5. Financials (Based on Availability)
- 17.2.10 Reprise Software Inc
- 17.2.10.1. Overview
- 17.2.10.2. Products
- 17.2.10.3. SWOT Analysis
- 17.2.10.4. Recent Developments
- 17.2.10.5. Financials (Based on Availability)
- 17.2.1 Flexera Software LLC
List of Figures
- Figure 1: Global License Management Industry Revenue Breakdown (Million, %) by Region 2024 & 2032
- Figure 2: North America License Management Industry Revenue (Million), by Country 2024 & 2032
- Figure 3: North America License Management Industry Revenue Share (%), by Country 2024 & 2032
- Figure 4: Europe License Management Industry Revenue (Million), by Country 2024 & 2032
- Figure 5: Europe License Management Industry Revenue Share (%), by Country 2024 & 2032
- Figure 6: Asia Pacific License Management Industry Revenue (Million), by Country 2024 & 2032
- Figure 7: Asia Pacific License Management Industry Revenue Share (%), by Country 2024 & 2032
- Figure 8: Latin America License Management Industry Revenue (Million), by Country 2024 & 2032
- Figure 9: Latin America License Management Industry Revenue Share (%), by Country 2024 & 2032
- Figure 10: Middle East and Africa License Management Industry Revenue (Million), by Country 2024 & 2032
- Figure 11: Middle East and Africa License Management Industry Revenue Share (%), by Country 2024 & 2032
- Figure 12: North America License Management Industry Revenue (Million), by Component 2024 & 2032
- Figure 13: North America License Management Industry Revenue Share (%), by Component 2024 & 2032
- Figure 14: North America License Management Industry Revenue (Million), by Deployment 2024 & 2032
- Figure 15: North America License Management Industry Revenue Share (%), by Deployment 2024 & 2032
- Figure 16: North America License Management Industry Revenue (Million), by Application (Qualitative Trend Analysis) 2024 & 2032
- Figure 17: North America License Management Industry Revenue Share (%), by Application (Qualitative Trend Analysis) 2024 & 2032
- Figure 18: North America License Management Industry Revenue (Million), by End User 2024 & 2032
- Figure 19: North America License Management Industry Revenue Share (%), by End User 2024 & 2032
- Figure 20: North America License Management Industry Revenue (Million), by Country 2024 & 2032
- Figure 21: North America License Management Industry Revenue Share (%), by Country 2024 & 2032
- Figure 22: Europe License Management Industry Revenue (Million), by Component 2024 & 2032
- Figure 23: Europe License Management Industry Revenue Share (%), by Component 2024 & 2032
- Figure 24: Europe License Management Industry Revenue (Million), by Deployment 2024 & 2032
- Figure 25: Europe License Management Industry Revenue Share (%), by Deployment 2024 & 2032
- Figure 26: Europe License Management Industry Revenue (Million), by Application (Qualitative Trend Analysis) 2024 & 2032
- Figure 27: Europe License Management Industry Revenue Share (%), by Application (Qualitative Trend Analysis) 2024 & 2032
- Figure 28: Europe License Management Industry Revenue (Million), by End User 2024 & 2032
- Figure 29: Europe License Management Industry Revenue Share (%), by End User 2024 & 2032
- Figure 30: Europe License Management Industry Revenue (Million), by Country 2024 & 2032
- Figure 31: Europe License Management Industry Revenue Share (%), by Country 2024 & 2032
- Figure 32: Asia License Management Industry Revenue (Million), by Component 2024 & 2032
- Figure 33: Asia License Management Industry Revenue Share (%), by Component 2024 & 2032
- Figure 34: Asia License Management Industry Revenue (Million), by Deployment 2024 & 2032
- Figure 35: Asia License Management Industry Revenue Share (%), by Deployment 2024 & 2032
- Figure 36: Asia License Management Industry Revenue (Million), by Application (Qualitative Trend Analysis) 2024 & 2032
- Figure 37: Asia License Management Industry Revenue Share (%), by Application (Qualitative Trend Analysis) 2024 & 2032
- Figure 38: Asia License Management Industry Revenue (Million), by End User 2024 & 2032
- Figure 39: Asia License Management Industry Revenue Share (%), by End User 2024 & 2032
- Figure 40: Asia License Management Industry Revenue (Million), by Country 2024 & 2032
- Figure 41: Asia License Management Industry Revenue Share (%), by Country 2024 & 2032
- Figure 42: Australia and New Zealand License Management Industry Revenue (Million), by Component 2024 & 2032
- Figure 43: Australia and New Zealand License Management Industry Revenue Share (%), by Component 2024 & 2032
- Figure 44: Australia and New Zealand License Management Industry Revenue (Million), by Deployment 2024 & 2032
- Figure 45: Australia and New Zealand License Management Industry Revenue Share (%), by Deployment 2024 & 2032
- Figure 46: Australia and New Zealand License Management Industry Revenue (Million), by Application (Qualitative Trend Analysis) 2024 & 2032
- Figure 47: Australia and New Zealand License Management Industry Revenue Share (%), by Application (Qualitative Trend Analysis) 2024 & 2032
- Figure 48: Australia and New Zealand License Management Industry Revenue (Million), by End User 2024 & 2032
- Figure 49: Australia and New Zealand License Management Industry Revenue Share (%), by End User 2024 & 2032
- Figure 50: Australia and New Zealand License Management Industry Revenue (Million), by Country 2024 & 2032
- Figure 51: Australia and New Zealand License Management Industry Revenue Share (%), by Country 2024 & 2032
- Figure 52: Latin America License Management Industry Revenue (Million), by Component 2024 & 2032
- Figure 53: Latin America License Management Industry Revenue Share (%), by Component 2024 & 2032
- Figure 54: Latin America License Management Industry Revenue (Million), by Deployment 2024 & 2032
- Figure 55: Latin America License Management Industry Revenue Share (%), by Deployment 2024 & 2032
- Figure 56: Latin America License Management Industry Revenue (Million), by Application (Qualitative Trend Analysis) 2024 & 2032
- Figure 57: Latin America License Management Industry Revenue Share (%), by Application (Qualitative Trend Analysis) 2024 & 2032
- Figure 58: Latin America License Management Industry Revenue (Million), by End User 2024 & 2032
- Figure 59: Latin America License Management Industry Revenue Share (%), by End User 2024 & 2032
- Figure 60: Latin America License Management Industry Revenue (Million), by Country 2024 & 2032
- Figure 61: Latin America License Management Industry Revenue Share (%), by Country 2024 & 2032
- Figure 62: Middle East and Africa License Management Industry Revenue (Million), by Component 2024 & 2032
- Figure 63: Middle East and Africa License Management Industry Revenue Share (%), by Component 2024 & 2032
- Figure 64: Middle East and Africa License Management Industry Revenue (Million), by Deployment 2024 & 2032
- Figure 65: Middle East and Africa License Management Industry Revenue Share (%), by Deployment 2024 & 2032
- Figure 66: Middle East and Africa License Management Industry Revenue (Million), by Application (Qualitative Trend Analysis) 2024 & 2032
- Figure 67: Middle East and Africa License Management Industry Revenue Share (%), by Application (Qualitative Trend Analysis) 2024 & 2032
- Figure 68: Middle East and Africa License Management Industry Revenue (Million), by End User 2024 & 2032
- Figure 69: Middle East and Africa License Management Industry Revenue Share (%), by End User 2024 & 2032
- Figure 70: Middle East and Africa License Management Industry Revenue (Million), by Country 2024 & 2032
- Figure 71: Middle East and Africa License Management Industry Revenue Share (%), by Country 2024 & 2032
List of Tables
- Table 1: Global License Management Industry Revenue Million Forecast, by Region 2019 & 2032
- Table 2: Global License Management Industry Revenue Million Forecast, by Component 2019 & 2032
- Table 3: Global License Management Industry Revenue Million Forecast, by Deployment 2019 & 2032
- Table 4: Global License Management Industry Revenue Million Forecast, by Application (Qualitative Trend Analysis) 2019 & 2032
- Table 5: Global License Management Industry Revenue Million Forecast, by End User 2019 & 2032
- Table 6: Global License Management Industry Revenue Million Forecast, by Region 2019 & 2032
- Table 7: Global License Management Industry Revenue Million Forecast, by Country 2019 & 2032
- Table 8: License Management Industry Revenue (Million) Forecast, by Application 2019 & 2032
- Table 9: Global License Management Industry Revenue Million Forecast, by Country 2019 & 2032
- Table 10: License Management Industry Revenue (Million) Forecast, by Application 2019 & 2032
- Table 11: Global License Management Industry Revenue Million Forecast, by Country 2019 & 2032
- Table 12: License Management Industry Revenue (Million) Forecast, by Application 2019 & 2032
- Table 13: Global License Management Industry Revenue Million Forecast, by Country 2019 & 2032
- Table 14: License Management Industry Revenue (Million) Forecast, by Application 2019 & 2032
- Table 15: Global License Management Industry Revenue Million Forecast, by Country 2019 & 2032
- Table 16: License Management Industry Revenue (Million) Forecast, by Application 2019 & 2032
- Table 17: Global License Management Industry Revenue Million Forecast, by Component 2019 & 2032
- Table 18: Global License Management Industry Revenue Million Forecast, by Deployment 2019 & 2032
- Table 19: Global License Management Industry Revenue Million Forecast, by Application (Qualitative Trend Analysis) 2019 & 2032
- Table 20: Global License Management Industry Revenue Million Forecast, by End User 2019 & 2032
- Table 21: Global License Management Industry Revenue Million Forecast, by Country 2019 & 2032
- Table 22: Global License Management Industry Revenue Million Forecast, by Component 2019 & 2032
- Table 23: Global License Management Industry Revenue Million Forecast, by Deployment 2019 & 2032
- Table 24: Global License Management Industry Revenue Million Forecast, by Application (Qualitative Trend Analysis) 2019 & 2032
- Table 25: Global License Management Industry Revenue Million Forecast, by End User 2019 & 2032
- Table 26: Global License Management Industry Revenue Million Forecast, by Country 2019 & 2032
- Table 27: Global License Management Industry Revenue Million Forecast, by Component 2019 & 2032
- Table 28: Global License Management Industry Revenue Million Forecast, by Deployment 2019 & 2032
- Table 29: Global License Management Industry Revenue Million Forecast, by Application (Qualitative Trend Analysis) 2019 & 2032
- Table 30: Global License Management Industry Revenue Million Forecast, by End User 2019 & 2032
- Table 31: Global License Management Industry Revenue Million Forecast, by Country 2019 & 2032
- Table 32: Global License Management Industry Revenue Million Forecast, by Component 2019 & 2032
- Table 33: Global License Management Industry Revenue Million Forecast, by Deployment 2019 & 2032
- Table 34: Global License Management Industry Revenue Million Forecast, by Application (Qualitative Trend Analysis) 2019 & 2032
- Table 35: Global License Management Industry Revenue Million Forecast, by End User 2019 & 2032
- Table 36: Global License Management Industry Revenue Million Forecast, by Country 2019 & 2032
- Table 37: Global License Management Industry Revenue Million Forecast, by Component 2019 & 2032
- Table 38: Global License Management Industry Revenue Million Forecast, by Deployment 2019 & 2032
- Table 39: Global License Management Industry Revenue Million Forecast, by Application (Qualitative Trend Analysis) 2019 & 2032
- Table 40: Global License Management Industry Revenue Million Forecast, by End User 2019 & 2032
- Table 41: Global License Management Industry Revenue Million Forecast, by Country 2019 & 2032
- Table 42: Global License Management Industry Revenue Million Forecast, by Component 2019 & 2032
- Table 43: Global License Management Industry Revenue Million Forecast, by Deployment 2019 & 2032
- Table 44: Global License Management Industry Revenue Million Forecast, by Application (Qualitative Trend Analysis) 2019 & 2032
- Table 45: Global License Management Industry Revenue Million Forecast, by End User 2019 & 2032
- Table 46: Global License Management Industry Revenue Million Forecast, by Country 2019 & 2032
Frequently Asked Questions
1. What is the projected Compound Annual Growth Rate (CAGR) of the License Management Industry?
The projected CAGR is approximately 10.06%.
2. Which companies are prominent players in the License Management Industry?
Key companies in the market include Flexera Software LLC, IBM Corporation, ServiceNow Inc *List Not Exhaustive, Thales Group, Cherwell Software LLC, USU Software AG, DXC Technology Co, Snow Software AB, Oracle Corporation, Reprise Software Inc.
3. What are the main segments of the License Management Industry?
The market segments include Component, Deployment, Application (Qualitative Trend Analysis), End User.
4. Can you provide details about the market size?
The market size is estimated to be USD 1.29 Million as of 2022.
5. What are some drivers contributing to market growth?
Increasing Demand to Optimize Software Investments; Growing Requirement for Audit-readiness among Organizations.
6. What are the notable trends driving market growth?
Healthcare Segment to Drive Market Growth.
7. Are there any restraints impacting market growth?
Uncertain Regulatory Standards and Frameworks.
8. Can you provide examples of recent developments in the market?
February 2022 - Thales collaborated with Lantronix Inc. and Taoglas to develop and deliver application-specific smart industrial IoT solutions for connecting data-dependent vertical industries, including Industrial 4.0, security, and transportation markets.
9. What pricing options are available for accessing the report?
Pricing options include single-user, multi-user, and enterprise licenses priced at USD 4750, USD 5250, and USD 8750 respectively.
10. Is the market size provided in terms of value or volume?
The market size is provided in terms of value, measured in Million.
11. Are there any specific market keywords associated with the report?
Yes, the market keyword associated with the report is "License Management Industry," which aids in identifying and referencing the specific market segment covered.
12. How do I determine which pricing option suits my needs best?
The pricing options vary based on user requirements and access needs. Individual users may opt for single-user licenses, while businesses requiring broader access may choose multi-user or enterprise licenses for cost-effective access to the report.
13. Are there any additional resources or data provided in the License Management Industry report?
While the report offers comprehensive insights, it's advisable to review the specific contents or supplementary materials provided to ascertain if additional resources or data are available.
14. How can I stay updated on further developments or reports in the License Management Industry?
To stay informed about further developments, trends, and reports in the License Management Industry, consider subscribing to industry newsletters, following relevant companies and organizations, or regularly checking reputable industry news sources and publications.
Methodology
Step 1 - Identification of Relevant Samples Size from Population Database


Step 2 - Approaches for Defining Global Market Size (Value, Volume* & Price*)

Note*: In applicable scenarios
Step 3 - Data Sources
Primary Research
- Web Analytics
- Survey Reports
- Research Institute
- Latest Research Reports
- Opinion Leaders
Secondary Research
- Annual Reports
- White Paper
- Latest Press Release
- Industry Association
- Paid Database
- Investor Presentations

Step 4 - Data Triangulation
Involves using different sources of information in order to increase the validity of a study
These sources are likely to be stakeholders in a program - participants, other researchers, program staff, other community members, and so on.
Then we put all data in single framework & apply various statistical tools to find out the dynamic on the market.
During the analysis stage, feedback from the stakeholder groups would be compared to determine areas of agreement as well as areas of divergence


