
Key Insights
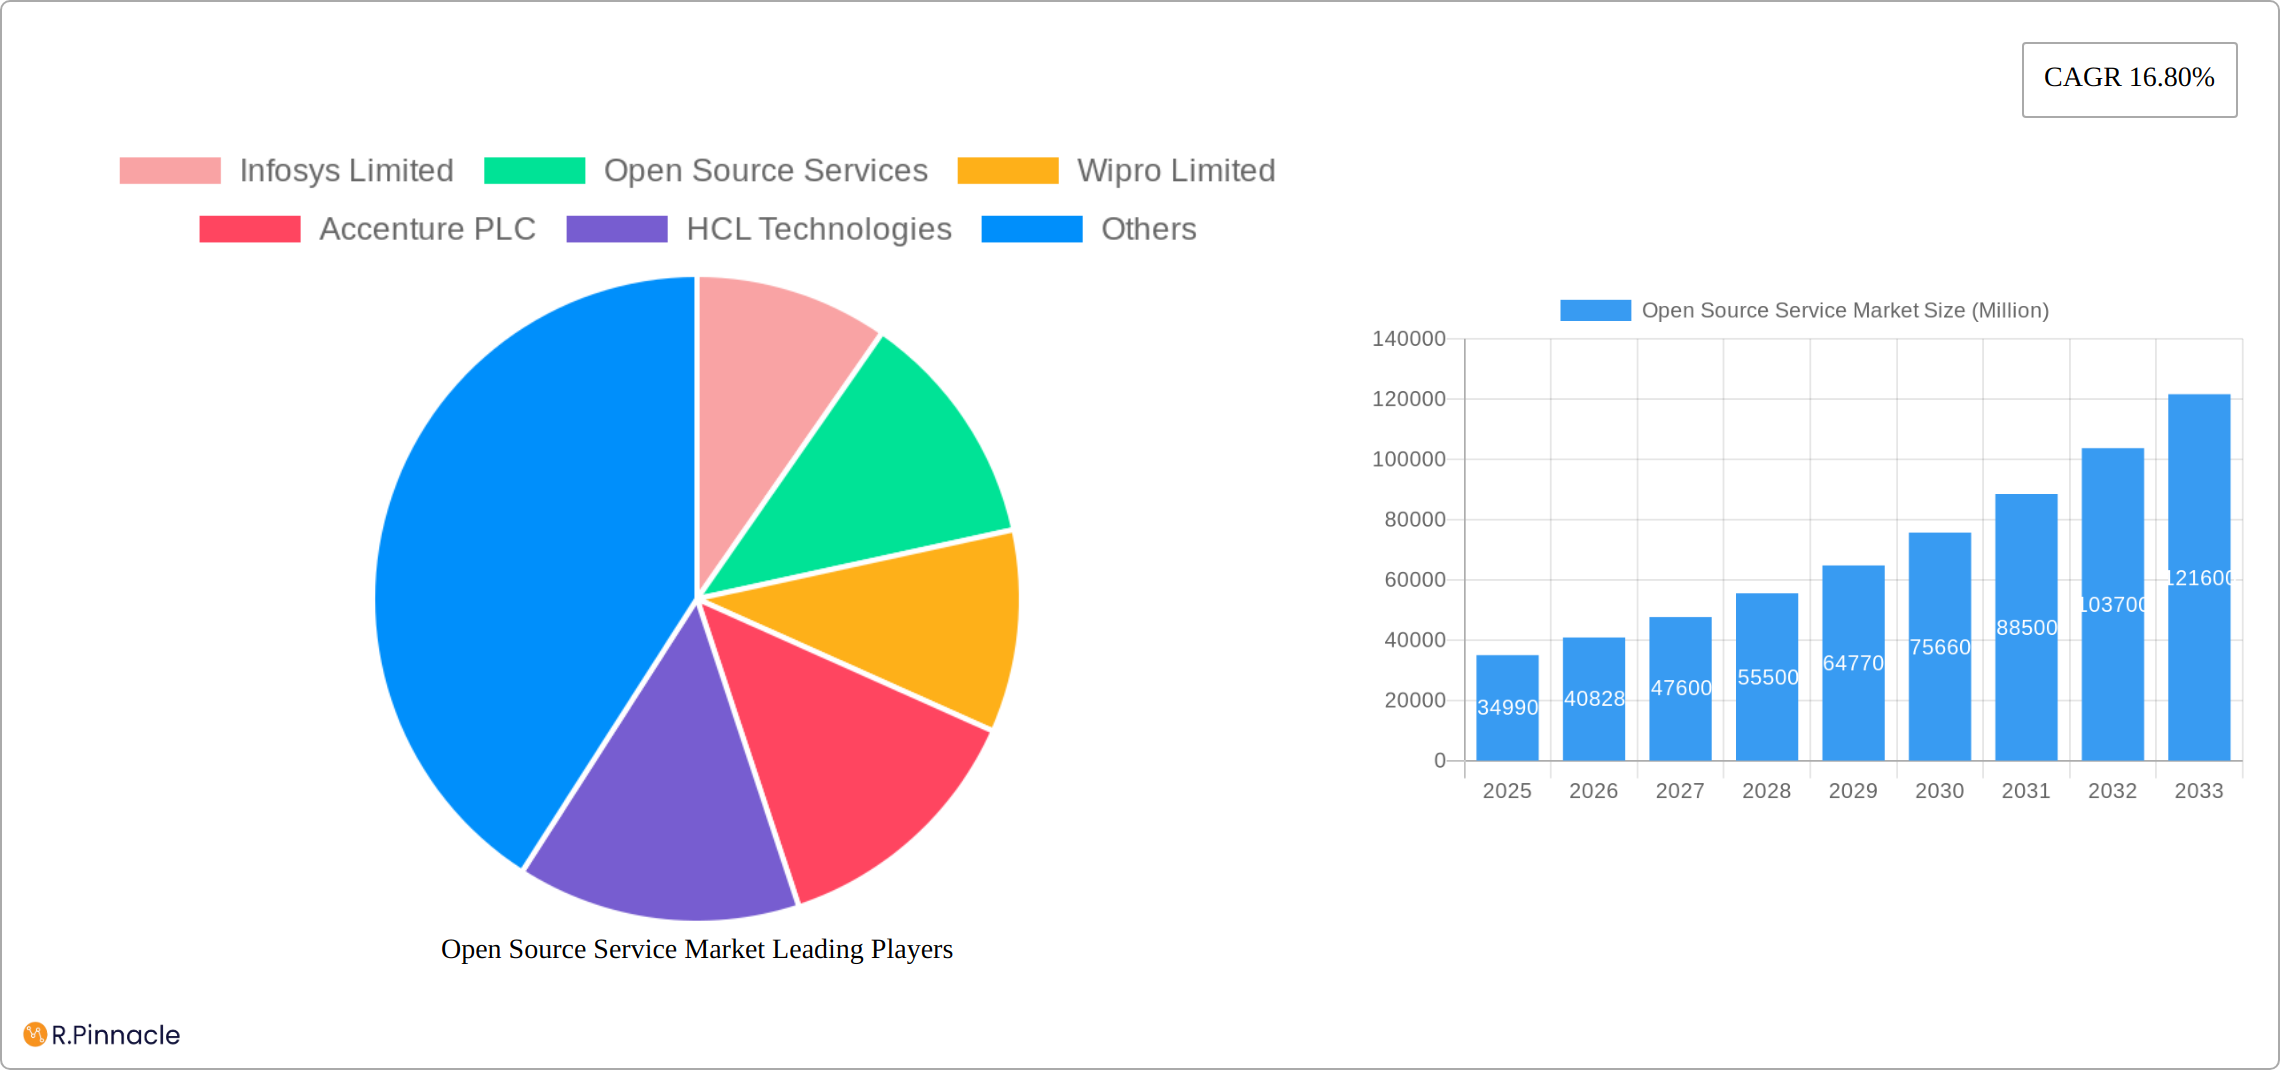
The open-source service market, valued at $34.99 billion in 2025, is experiencing robust growth, projected to expand at a compound annual growth rate (CAGR) of 16.80% from 2025 to 2033. This surge is driven by several key factors. Firstly, the increasing adoption of open-source technologies across diverse sectors like banking, finance, telecom, and manufacturing reduces licensing costs and fosters innovation. The flexibility and customization options offered by open-source solutions further enhance their appeal. Secondly, the growing need for digital transformation and cloud-based services fuels the demand for expert open-source support, implementation, and maintenance. Organizations increasingly rely on specialized service providers to navigate the complexities of open-source technologies, ensuring optimal performance and security. Thirdly, the expanding ecosystem of open-source communities and the availability of skilled professionals contribute to market expansion. However, challenges remain, including concerns about security vulnerabilities, potential integration complexities, and the lack of standardized support in certain niche areas. Despite these restraints, the overall market outlook remains positive, with significant growth opportunities anticipated across all geographical regions. North America and Europe are expected to retain substantial market share due to high technology adoption rates and established open-source ecosystems, but rapidly developing economies in Asia Pacific are poised for significant growth.
The segmentation analysis reveals a diverse landscape. Consulting and implementation services represent a major segment, followed by support and maintenance, and training services. While the banking, financial services, and insurance (BFSI) sector is a significant end-user, the market's growth is broad-based, extending to telecom, IT, manufacturing, and other industries. Key players like Infosys, Wipro, Accenture, IBM, and Red Hat are actively shaping the market landscape through their service offerings and strategic partnerships, driving both innovation and competition. The market's future trajectory will be influenced by evolving technological advancements, regulatory changes, and the continued expansion of the open-source community. The increasing adoption of AI and machine learning within open-source platforms will likely drive further growth and innovation in the years to come.
Open Source Service Market Report: 2019-2033 Forecast
This comprehensive report provides a detailed analysis of the Open Source Service market, offering invaluable insights for industry professionals, investors, and strategic decision-makers. The study covers the period 2019-2033, with a focus on the estimated year 2025 and a forecast period of 2025-2033. The report leverages extensive data analysis to uncover key trends, challenges, and opportunities within this rapidly evolving market. Expect actionable insights into market segmentation, competitive dynamics, and future growth potential, all presented with a reader-centric approach.
Open Source Service Market Structure & Innovation Trends
This section analyzes the market's competitive landscape, identifying key players and their market share. The report examines the driving forces behind innovation, including technological advancements and regulatory changes. It also explores the impact of mergers and acquisitions (M&A) activities on market consolidation.
Market Concentration: The Open Source Service market exhibits a moderately concentrated structure, with the top 10 players accounting for approximately xx% of the total market revenue in 2025. Companies like Infosys Limited, Wipro Limited, Accenture PLC, HCL Technologies, IBM Corporation, ATOS SE, Hewlett Packard Enterprise Company, Cisco Systems Inc, Red Hat Inc, and Oracle Corporation are significant contributors.
Innovation Drivers: Open-source technologies, cloud computing, and the increasing demand for agile development methodologies are primary drivers of innovation. The rise of DevOps practices and the need for cost-effective solutions are also fueling the market's growth.
Regulatory Frameworks: Government regulations related to data privacy and security significantly influence the market. Compliance requirements drive the demand for secure and compliant open-source solutions.
M&A Activities: The past five years have witnessed significant M&A activity in the Open Source Service market. Deal values have totaled approximately xx Million, primarily driven by strategic acquisitions aimed at expanding service portfolios and strengthening market positions.

Open Source Service Market Dynamics & Trends
This section delves into the market's growth trajectory, analyzing key drivers, technological disruptions, and consumer preferences. It explores the competitive dynamics and identifies factors influencing market penetration and CAGR.
The Open Source Service market is experiencing robust growth, driven by factors such as the increasing adoption of open-source software, the growing demand for customized solutions, and the rising need for cost optimization. Technological advancements, such as artificial intelligence (AI) and machine learning (ML), are further fueling the market's expansion. The market's CAGR is estimated at xx% during the forecast period (2025-2033), driven by a growing market penetration rate that is projected to reach xx% by 2033.
Dominant Regions & Segments in Open Source Service Market
The Open Source Service market is experiencing significant growth, driven by a confluence of factors impacting various regions and segments. This section details the leading players and analyzes the key forces shaping their dominance, including economic policies, infrastructure advancements, and evolving technological landscapes.
By Service Type: While Consulting and Implementation Services maintain a leading position, holding a substantial market share (precise figures pending data update), the landscape is evolving. The demand for expert guidance in deploying and integrating open-source solutions remains high. Support, Maintenance, and Management Services are experiencing robust growth, projected to achieve a significant CAGR (precise figure pending data update) fueled by the increasing sophistication of open-source software ecosystems. Furthermore, Training Services are witnessing expansion driven by the acute need for skilled professionals proficient in these technologies. This growth is being further fueled by the increasing adoption of cloud-native technologies and the demand for specialized expertise in areas such as AI/ML integration with open-source platforms.
By End-user Industry: The Telecom and IT sector continues to be a major adopter of open-source technologies, commanding a leading market share (precise figures pending data update) in 2025. This strong presence is mirrored in the Banking, Financial Services, and Insurance (BFSI) sector, which values the enhanced efficiency and robust security features offered by these solutions. Beyond these established leaders, substantial growth is anticipated from sectors like Manufacturing, Healthcare, and Government, reflecting a broader embrace of open-source solutions across diverse industries. The increasing focus on data security and compliance across industries is further driving the adoption of open-source solutions.
Leading Regions: North America retains its position as a dominant force in the market, owing to early adoption and robust technological infrastructure. However, Europe and the Asia-Pacific region are demonstrating impressive growth trajectories. The Asia-Pacific region, in particular, is experiencing rapid expansion fueled by increased digitalization initiatives and supportive government policies. This signifies a global shift towards open-source technologies, with diverse regions contributing to the market's overall expansion. Emerging markets in Latin America and Africa also present exciting untapped potential.
Open Source Service Market Product Innovations
Recent product developments focus on enhanced security features, cloud-native solutions, and AI-powered automation tools. These innovations are tailored to address customer demands for improved scalability, security, and ease of use, thereby enhancing the competitive advantage of service providers. The market is seeing a trend toward integrating open source technologies into existing enterprise systems.
Report Scope & Segmentation Analysis
This report segments the Open Source Service market by Service Type (Consulting and Implementation Services, Support, Maintenance, and Management Services, Training Services) and End-user Industry (Banking, Financial Services, and Insurance, Telecom and IT, Manufacturing, Government, Healthcare, Retail, Others (Transportation and Logistics, Energy and Utilities)). Each segment is analyzed in terms of its growth projections, market size, and competitive dynamics. The market is expected to reach xx Million by 2033.
Key Drivers of Open Source Service Market Growth
The expansion of the Open Source Service market is propelled by several key factors. Cost reduction remains a significant driver, as open-source software offers a financially attractive alternative to proprietary solutions. This is complemented by the inherent flexibility and customization options that empower businesses to tailor solutions to their specific needs. Government initiatives actively promoting open-source technologies are further accelerating market growth. The rise of agile software development methodologies aligns perfectly with the adaptability of open-source platforms, fostering a symbiotic relationship. Finally, technological breakthroughs like AI and ML are creating demand for specialized open-source services, enhancing the capabilities and scope of existing solutions.
Challenges in the Open Source Service Market Sector
The Open Source Service market faces challenges such as the complexity of open-source solutions, security concerns, and the lack of standardized support mechanisms. The talent shortage and the need for specialized skills also represent significant hurdles to market growth. These factors could potentially reduce the overall market growth by approximately xx% by 2033.
Emerging Opportunities in Open Source Service Market
Significant opportunities abound within the Open Source Service market. The widespread adoption of cloud-native open-source platforms is creating new avenues for growth. The burgeoning demand for AI-powered services, integrated seamlessly within open-source frameworks, presents a substantial opportunity. Furthermore, expansion into emerging vertical markets like IoT and edge computing presents exciting frontiers for innovative service providers. Those who can swiftly adapt to these evolving trends and provide cutting-edge solutions are poised to capture a significant share of this expanding market. The intersection of open-source technologies and emerging areas like blockchain and Web3 also holds significant future potential.
Leading Players in the Open Source Service Market Market
- Infosys Limited
- Open Source Services
- Wipro Limited
- Accenture PLC
- HCL Technologies
- IBM Corporation
- ATOS SE
- Hewlett Packard Enterprise Company
- Cisco Systems Inc
- Red Hat Inc
- Oracle Corporation
Key Developments in Open Source Service Market Industry
- 2023-Q4: Red Hat released a major update to its enterprise Linux distribution.
- 2022-Q3: Accenture acquired a smaller open-source consulting firm.
- 2021-Q2: Infosys launched a new suite of open-source based cloud solutions. (Further developments will be detailed in the full report)
Future Outlook for Open Source Service Market Market
The Open Source Service market exhibits substantial growth potential, fueled by ongoing technological advancements, increasing digital transformation initiatives across various sectors, and the growing preference for flexible and cost-effective solutions. Strategic partnerships, acquisitions, and investments in research and development will play a crucial role in shaping the market's future. The market is poised for substantial expansion in the coming years.
Open Source Service Market Segmentation
-
1. Service Type
- 1.1. Consulting and Implementation Services
- 1.2. Support, Maintenance, and Management Services
- 1.3. Training Services
-
2. End-user Industry
- 2.1. Banking, Financial Services, and Insurance
- 2.2. Telecom and IT
- 2.3. Manufacturing
- 2.4. Government
- 2.5. Healthcare
- 2.6. Retail
- 2.7. Others (
Open Source Service Market Segmentation By Geography
-
1. North America
- 1.1. United States
- 1.2. Canada
-
2. Europe
- 2.1. United Kingdom
- 2.2. Germany
- 2.3. France
- 2.4. Rest of the Europe
-
3. Asia Pacific
- 3.1. China
- 3.2. Japan
- 3.3. India
- 3.4. Rest of the Asia Pacific
- 4. Latin America
- 5. Middle East and Africa

Open Source Service Market REPORT HIGHLIGHTS
| Aspects | Details |
|---|---|
| Study Period | 2019-2033 |
| Base Year | 2024 |
| Estimated Year | 2025 |
| Forecast Period | 2025-2033 |
| Historical Period | 2019-2024 |
| Growth Rate | CAGR of 16.80% from 2019-2033 |
| Segmentation |
|
Table of Contents
- 1. Introduction
- 1.1. Research Scope
- 1.2. Market Segmentation
- 1.3. Research Methodology
- 1.4. Definitions and Assumptions
- 2. Executive Summary
- 2.1. Introduction
- 3. Market Dynamics
- 3.1. Introduction
- 3.2. Market Drivers
- 3.2.1. Reduced Cost of Ownership and Time to Market; Interoperability and Flexibility in Terms of Customization
- 3.3. Market Restrains
- 3.3.1. Security Issues
- 3.4. Market Trends
- 3.4.1. Emphasis on Reduced Cost of Ownership and Time to Market is Expected to Drive the Market Growth
- 4. Market Factor Analysis
- 4.1. Porters Five Forces
- 4.2. Supply/Value Chain
- 4.3. PESTEL analysis
- 4.4. Market Entropy
- 4.5. Patent/Trademark Analysis
- 5. Global Open Source Service Market Analysis, Insights and Forecast, 2019-2031
- 5.1. Market Analysis, Insights and Forecast - by Service Type
- 5.1.1. Consulting and Implementation Services
- 5.1.2. Support, Maintenance, and Management Services
- 5.1.3. Training Services
- 5.2. Market Analysis, Insights and Forecast - by End-user Industry
- 5.2.1. Banking, Financial Services, and Insurance
- 5.2.2. Telecom and IT
- 5.2.3. Manufacturing
- 5.2.4. Government
- 5.2.5. Healthcare
- 5.2.6. Retail
- 5.2.7. Others (
- 5.3. Market Analysis, Insights and Forecast - by Region
- 5.3.1. North America
- 5.3.2. Europe
- 5.3.3. Asia Pacific
- 5.3.4. Latin America
- 5.3.5. Middle East and Africa
- 5.1. Market Analysis, Insights and Forecast - by Service Type
- 6. North America Open Source Service Market Analysis, Insights and Forecast, 2019-2031
- 6.1. Market Analysis, Insights and Forecast - by Service Type
- 6.1.1. Consulting and Implementation Services
- 6.1.2. Support, Maintenance, and Management Services
- 6.1.3. Training Services
- 6.2. Market Analysis, Insights and Forecast - by End-user Industry
- 6.2.1. Banking, Financial Services, and Insurance
- 6.2.2. Telecom and IT
- 6.2.3. Manufacturing
- 6.2.4. Government
- 6.2.5. Healthcare
- 6.2.6. Retail
- 6.2.7. Others (
- 6.1. Market Analysis, Insights and Forecast - by Service Type
- 7. Europe Open Source Service Market Analysis, Insights and Forecast, 2019-2031
- 7.1. Market Analysis, Insights and Forecast - by Service Type
- 7.1.1. Consulting and Implementation Services
- 7.1.2. Support, Maintenance, and Management Services
- 7.1.3. Training Services
- 7.2. Market Analysis, Insights and Forecast - by End-user Industry
- 7.2.1. Banking, Financial Services, and Insurance
- 7.2.2. Telecom and IT
- 7.2.3. Manufacturing
- 7.2.4. Government
- 7.2.5. Healthcare
- 7.2.6. Retail
- 7.2.7. Others (
- 7.1. Market Analysis, Insights and Forecast - by Service Type
- 8. Asia Pacific Open Source Service Market Analysis, Insights and Forecast, 2019-2031
- 8.1. Market Analysis, Insights and Forecast - by Service Type
- 8.1.1. Consulting and Implementation Services
- 8.1.2. Support, Maintenance, and Management Services
- 8.1.3. Training Services
- 8.2. Market Analysis, Insights and Forecast - by End-user Industry
- 8.2.1. Banking, Financial Services, and Insurance
- 8.2.2. Telecom and IT
- 8.2.3. Manufacturing
- 8.2.4. Government
- 8.2.5. Healthcare
- 8.2.6. Retail
- 8.2.7. Others (
- 8.1. Market Analysis, Insights and Forecast - by Service Type
- 9. Latin America Open Source Service Market Analysis, Insights and Forecast, 2019-2031
- 9.1. Market Analysis, Insights and Forecast - by Service Type
- 9.1.1. Consulting and Implementation Services
- 9.1.2. Support, Maintenance, and Management Services
- 9.1.3. Training Services
- 9.2. Market Analysis, Insights and Forecast - by End-user Industry
- 9.2.1. Banking, Financial Services, and Insurance
- 9.2.2. Telecom and IT
- 9.2.3. Manufacturing
- 9.2.4. Government
- 9.2.5. Healthcare
- 9.2.6. Retail
- 9.2.7. Others (
- 9.1. Market Analysis, Insights and Forecast - by Service Type
- 10. Middle East and Africa Open Source Service Market Analysis, Insights and Forecast, 2019-2031
- 10.1. Market Analysis, Insights and Forecast - by Service Type
- 10.1.1. Consulting and Implementation Services
- 10.1.2. Support, Maintenance, and Management Services
- 10.1.3. Training Services
- 10.2. Market Analysis, Insights and Forecast - by End-user Industry
- 10.2.1. Banking, Financial Services, and Insurance
- 10.2.2. Telecom and IT
- 10.2.3. Manufacturing
- 10.2.4. Government
- 10.2.5. Healthcare
- 10.2.6. Retail
- 10.2.7. Others (
- 10.1. Market Analysis, Insights and Forecast - by Service Type
- 11. North America Open Source Service Market Analysis, Insights and Forecast, 2019-2031
- 11.1. Market Analysis, Insights and Forecast - By Country/Sub-region
- 11.1.1 United States
- 11.1.2 Canada
- 11.1.3 Mexico
- 12. Europe Open Source Service Market Analysis, Insights and Forecast, 2019-2031
- 12.1. Market Analysis, Insights and Forecast - By Country/Sub-region
- 12.1.1 Germany
- 12.1.2 United Kingdom
- 12.1.3 France
- 12.1.4 Spain
- 12.1.5 Italy
- 12.1.6 Spain
- 12.1.7 Belgium
- 12.1.8 Netherland
- 12.1.9 Nordics
- 12.1.10 Rest of Europe
- 13. Asia Pacific Open Source Service Market Analysis, Insights and Forecast, 2019-2031
- 13.1. Market Analysis, Insights and Forecast - By Country/Sub-region
- 13.1.1 China
- 13.1.2 Japan
- 13.1.3 India
- 13.1.4 South Korea
- 13.1.5 Southeast Asia
- 13.1.6 Australia
- 13.1.7 Indonesia
- 13.1.8 Phillipes
- 13.1.9 Singapore
- 13.1.10 Thailandc
- 13.1.11 Rest of Asia Pacific
- 14. South America Open Source Service Market Analysis, Insights and Forecast, 2019-2031
- 14.1. Market Analysis, Insights and Forecast - By Country/Sub-region
- 14.1.1 Brazil
- 14.1.2 Argentina
- 14.1.3 Peru
- 14.1.4 Chile
- 14.1.5 Colombia
- 14.1.6 Ecuador
- 14.1.7 Venezuela
- 14.1.8 Rest of South America
- 15. MEA Open Source Service Market Analysis, Insights and Forecast, 2019-2031
- 15.1. Market Analysis, Insights and Forecast - By Country/Sub-region
- 15.1.1 United Arab Emirates
- 15.1.2 Saudi Arabia
- 15.1.3 South Africa
- 15.1.4 Rest of Middle East and Africa
- 16. Competitive Analysis
- 16.1. Global Market Share Analysis 2024
- 16.2. Company Profiles
- 16.2.1 Infosys Limited
- 16.2.1.1. Overview
- 16.2.1.2. Products
- 16.2.1.3. SWOT Analysis
- 16.2.1.4. Recent Developments
- 16.2.1.5. Financials (Based on Availability)
- 16.2.2 Open Source Services
- 16.2.2.1. Overview
- 16.2.2.2. Products
- 16.2.2.3. SWOT Analysis
- 16.2.2.4. Recent Developments
- 16.2.2.5. Financials (Based on Availability)
- 16.2.3 Wipro Limited
- 16.2.3.1. Overview
- 16.2.3.2. Products
- 16.2.3.3. SWOT Analysis
- 16.2.3.4. Recent Developments
- 16.2.3.5. Financials (Based on Availability)
- 16.2.4 Accenture PLC
- 16.2.4.1. Overview
- 16.2.4.2. Products
- 16.2.4.3. SWOT Analysis
- 16.2.4.4. Recent Developments
- 16.2.4.5. Financials (Based on Availability)
- 16.2.5 HCL Technologies
- 16.2.5.1. Overview
- 16.2.5.2. Products
- 16.2.5.3. SWOT Analysis
- 16.2.5.4. Recent Developments
- 16.2.5.5. Financials (Based on Availability)
- 16.2.6 IBM Corporation
- 16.2.6.1. Overview
- 16.2.6.2. Products
- 16.2.6.3. SWOT Analysis
- 16.2.6.4. Recent Developments
- 16.2.6.5. Financials (Based on Availability)
- 16.2.7 ATOS SE
- 16.2.7.1. Overview
- 16.2.7.2. Products
- 16.2.7.3. SWOT Analysis
- 16.2.7.4. Recent Developments
- 16.2.7.5. Financials (Based on Availability)
- 16.2.8 Hewlett Packard Enterprise Company
- 16.2.8.1. Overview
- 16.2.8.2. Products
- 16.2.8.3. SWOT Analysis
- 16.2.8.4. Recent Developments
- 16.2.8.5. Financials (Based on Availability)
- 16.2.9 Cisco Systems Inc
- 16.2.9.1. Overview
- 16.2.9.2. Products
- 16.2.9.3. SWOT Analysis
- 16.2.9.4. Recent Developments
- 16.2.9.5. Financials (Based on Availability)
- 16.2.10 Red Hat Inc
- 16.2.10.1. Overview
- 16.2.10.2. Products
- 16.2.10.3. SWOT Analysis
- 16.2.10.4. Recent Developments
- 16.2.10.5. Financials (Based on Availability)
- 16.2.11 Oracle Corporation
- 16.2.11.1. Overview
- 16.2.11.2. Products
- 16.2.11.3. SWOT Analysis
- 16.2.11.4. Recent Developments
- 16.2.11.5. Financials (Based on Availability)
- 16.2.1 Infosys Limited
List of Figures
- Figure 1: Global Open Source Service Market Revenue Breakdown (Million, %) by Region 2024 & 2032
- Figure 2: North America Open Source Service Market Revenue (Million), by Country 2024 & 2032
- Figure 3: North America Open Source Service Market Revenue Share (%), by Country 2024 & 2032
- Figure 4: Europe Open Source Service Market Revenue (Million), by Country 2024 & 2032
- Figure 5: Europe Open Source Service Market Revenue Share (%), by Country 2024 & 2032
- Figure 6: Asia Pacific Open Source Service Market Revenue (Million), by Country 2024 & 2032
- Figure 7: Asia Pacific Open Source Service Market Revenue Share (%), by Country 2024 & 2032
- Figure 8: South America Open Source Service Market Revenue (Million), by Country 2024 & 2032
- Figure 9: South America Open Source Service Market Revenue Share (%), by Country 2024 & 2032
- Figure 10: MEA Open Source Service Market Revenue (Million), by Country 2024 & 2032
- Figure 11: MEA Open Source Service Market Revenue Share (%), by Country 2024 & 2032
- Figure 12: North America Open Source Service Market Revenue (Million), by Service Type 2024 & 2032
- Figure 13: North America Open Source Service Market Revenue Share (%), by Service Type 2024 & 2032
- Figure 14: North America Open Source Service Market Revenue (Million), by End-user Industry 2024 & 2032
- Figure 15: North America Open Source Service Market Revenue Share (%), by End-user Industry 2024 & 2032
- Figure 16: North America Open Source Service Market Revenue (Million), by Country 2024 & 2032
- Figure 17: North America Open Source Service Market Revenue Share (%), by Country 2024 & 2032
- Figure 18: Europe Open Source Service Market Revenue (Million), by Service Type 2024 & 2032
- Figure 19: Europe Open Source Service Market Revenue Share (%), by Service Type 2024 & 2032
- Figure 20: Europe Open Source Service Market Revenue (Million), by End-user Industry 2024 & 2032
- Figure 21: Europe Open Source Service Market Revenue Share (%), by End-user Industry 2024 & 2032
- Figure 22: Europe Open Source Service Market Revenue (Million), by Country 2024 & 2032
- Figure 23: Europe Open Source Service Market Revenue Share (%), by Country 2024 & 2032
- Figure 24: Asia Pacific Open Source Service Market Revenue (Million), by Service Type 2024 & 2032
- Figure 25: Asia Pacific Open Source Service Market Revenue Share (%), by Service Type 2024 & 2032
- Figure 26: Asia Pacific Open Source Service Market Revenue (Million), by End-user Industry 2024 & 2032
- Figure 27: Asia Pacific Open Source Service Market Revenue Share (%), by End-user Industry 2024 & 2032
- Figure 28: Asia Pacific Open Source Service Market Revenue (Million), by Country 2024 & 2032
- Figure 29: Asia Pacific Open Source Service Market Revenue Share (%), by Country 2024 & 2032
- Figure 30: Latin America Open Source Service Market Revenue (Million), by Service Type 2024 & 2032
- Figure 31: Latin America Open Source Service Market Revenue Share (%), by Service Type 2024 & 2032
- Figure 32: Latin America Open Source Service Market Revenue (Million), by End-user Industry 2024 & 2032
- Figure 33: Latin America Open Source Service Market Revenue Share (%), by End-user Industry 2024 & 2032
- Figure 34: Latin America Open Source Service Market Revenue (Million), by Country 2024 & 2032
- Figure 35: Latin America Open Source Service Market Revenue Share (%), by Country 2024 & 2032
- Figure 36: Middle East and Africa Open Source Service Market Revenue (Million), by Service Type 2024 & 2032
- Figure 37: Middle East and Africa Open Source Service Market Revenue Share (%), by Service Type 2024 & 2032
- Figure 38: Middle East and Africa Open Source Service Market Revenue (Million), by End-user Industry 2024 & 2032
- Figure 39: Middle East and Africa Open Source Service Market Revenue Share (%), by End-user Industry 2024 & 2032
- Figure 40: Middle East and Africa Open Source Service Market Revenue (Million), by Country 2024 & 2032
- Figure 41: Middle East and Africa Open Source Service Market Revenue Share (%), by Country 2024 & 2032
List of Tables
- Table 1: Global Open Source Service Market Revenue Million Forecast, by Region 2019 & 2032
- Table 2: Global Open Source Service Market Revenue Million Forecast, by Service Type 2019 & 2032
- Table 3: Global Open Source Service Market Revenue Million Forecast, by End-user Industry 2019 & 2032
- Table 4: Global Open Source Service Market Revenue Million Forecast, by Region 2019 & 2032
- Table 5: Global Open Source Service Market Revenue Million Forecast, by Country 2019 & 2032
- Table 6: United States Open Source Service Market Revenue (Million) Forecast, by Application 2019 & 2032
- Table 7: Canada Open Source Service Market Revenue (Million) Forecast, by Application 2019 & 2032
- Table 8: Mexico Open Source Service Market Revenue (Million) Forecast, by Application 2019 & 2032
- Table 9: Global Open Source Service Market Revenue Million Forecast, by Country 2019 & 2032
- Table 10: Germany Open Source Service Market Revenue (Million) Forecast, by Application 2019 & 2032
- Table 11: United Kingdom Open Source Service Market Revenue (Million) Forecast, by Application 2019 & 2032
- Table 12: France Open Source Service Market Revenue (Million) Forecast, by Application 2019 & 2032
- Table 13: Spain Open Source Service Market Revenue (Million) Forecast, by Application 2019 & 2032
- Table 14: Italy Open Source Service Market Revenue (Million) Forecast, by Application 2019 & 2032
- Table 15: Spain Open Source Service Market Revenue (Million) Forecast, by Application 2019 & 2032
- Table 16: Belgium Open Source Service Market Revenue (Million) Forecast, by Application 2019 & 2032
- Table 17: Netherland Open Source Service Market Revenue (Million) Forecast, by Application 2019 & 2032
- Table 18: Nordics Open Source Service Market Revenue (Million) Forecast, by Application 2019 & 2032
- Table 19: Rest of Europe Open Source Service Market Revenue (Million) Forecast, by Application 2019 & 2032
- Table 20: Global Open Source Service Market Revenue Million Forecast, by Country 2019 & 2032
- Table 21: China Open Source Service Market Revenue (Million) Forecast, by Application 2019 & 2032
- Table 22: Japan Open Source Service Market Revenue (Million) Forecast, by Application 2019 & 2032
- Table 23: India Open Source Service Market Revenue (Million) Forecast, by Application 2019 & 2032
- Table 24: South Korea Open Source Service Market Revenue (Million) Forecast, by Application 2019 & 2032
- Table 25: Southeast Asia Open Source Service Market Revenue (Million) Forecast, by Application 2019 & 2032
- Table 26: Australia Open Source Service Market Revenue (Million) Forecast, by Application 2019 & 2032
- Table 27: Indonesia Open Source Service Market Revenue (Million) Forecast, by Application 2019 & 2032
- Table 28: Phillipes Open Source Service Market Revenue (Million) Forecast, by Application 2019 & 2032
- Table 29: Singapore Open Source Service Market Revenue (Million) Forecast, by Application 2019 & 2032
- Table 30: Thailandc Open Source Service Market Revenue (Million) Forecast, by Application 2019 & 2032
- Table 31: Rest of Asia Pacific Open Source Service Market Revenue (Million) Forecast, by Application 2019 & 2032
- Table 32: Global Open Source Service Market Revenue Million Forecast, by Country 2019 & 2032
- Table 33: Brazil Open Source Service Market Revenue (Million) Forecast, by Application 2019 & 2032
- Table 34: Argentina Open Source Service Market Revenue (Million) Forecast, by Application 2019 & 2032
- Table 35: Peru Open Source Service Market Revenue (Million) Forecast, by Application 2019 & 2032
- Table 36: Chile Open Source Service Market Revenue (Million) Forecast, by Application 2019 & 2032
- Table 37: Colombia Open Source Service Market Revenue (Million) Forecast, by Application 2019 & 2032
- Table 38: Ecuador Open Source Service Market Revenue (Million) Forecast, by Application 2019 & 2032
- Table 39: Venezuela Open Source Service Market Revenue (Million) Forecast, by Application 2019 & 2032
- Table 40: Rest of South America Open Source Service Market Revenue (Million) Forecast, by Application 2019 & 2032
- Table 41: Global Open Source Service Market Revenue Million Forecast, by Country 2019 & 2032
- Table 42: United Arab Emirates Open Source Service Market Revenue (Million) Forecast, by Application 2019 & 2032
- Table 43: Saudi Arabia Open Source Service Market Revenue (Million) Forecast, by Application 2019 & 2032
- Table 44: South Africa Open Source Service Market Revenue (Million) Forecast, by Application 2019 & 2032
- Table 45: Rest of Middle East and Africa Open Source Service Market Revenue (Million) Forecast, by Application 2019 & 2032
- Table 46: Global Open Source Service Market Revenue Million Forecast, by Service Type 2019 & 2032
- Table 47: Global Open Source Service Market Revenue Million Forecast, by End-user Industry 2019 & 2032
- Table 48: Global Open Source Service Market Revenue Million Forecast, by Country 2019 & 2032
- Table 49: United States Open Source Service Market Revenue (Million) Forecast, by Application 2019 & 2032
- Table 50: Canada Open Source Service Market Revenue (Million) Forecast, by Application 2019 & 2032
- Table 51: Global Open Source Service Market Revenue Million Forecast, by Service Type 2019 & 2032
- Table 52: Global Open Source Service Market Revenue Million Forecast, by End-user Industry 2019 & 2032
- Table 53: Global Open Source Service Market Revenue Million Forecast, by Country 2019 & 2032
- Table 54: United Kingdom Open Source Service Market Revenue (Million) Forecast, by Application 2019 & 2032
- Table 55: Germany Open Source Service Market Revenue (Million) Forecast, by Application 2019 & 2032
- Table 56: France Open Source Service Market Revenue (Million) Forecast, by Application 2019 & 2032
- Table 57: Rest of the Europe Open Source Service Market Revenue (Million) Forecast, by Application 2019 & 2032
- Table 58: Global Open Source Service Market Revenue Million Forecast, by Service Type 2019 & 2032
- Table 59: Global Open Source Service Market Revenue Million Forecast, by End-user Industry 2019 & 2032
- Table 60: Global Open Source Service Market Revenue Million Forecast, by Country 2019 & 2032
- Table 61: China Open Source Service Market Revenue (Million) Forecast, by Application 2019 & 2032
- Table 62: Japan Open Source Service Market Revenue (Million) Forecast, by Application 2019 & 2032
- Table 63: India Open Source Service Market Revenue (Million) Forecast, by Application 2019 & 2032
- Table 64: Rest of the Asia Pacific Open Source Service Market Revenue (Million) Forecast, by Application 2019 & 2032
- Table 65: Global Open Source Service Market Revenue Million Forecast, by Service Type 2019 & 2032
- Table 66: Global Open Source Service Market Revenue Million Forecast, by End-user Industry 2019 & 2032
- Table 67: Global Open Source Service Market Revenue Million Forecast, by Country 2019 & 2032
- Table 68: Global Open Source Service Market Revenue Million Forecast, by Service Type 2019 & 2032
- Table 69: Global Open Source Service Market Revenue Million Forecast, by End-user Industry 2019 & 2032
- Table 70: Global Open Source Service Market Revenue Million Forecast, by Country 2019 & 2032
Frequently Asked Questions
1. What is the projected Compound Annual Growth Rate (CAGR) of the Open Source Service Market?
The projected CAGR is approximately 16.80%.
2. Which companies are prominent players in the Open Source Service Market?
Key companies in the market include Infosys Limited, Open Source Services, Wipro Limited, Accenture PLC, HCL Technologies, IBM Corporation, ATOS SE, Hewlett Packard Enterprise Company, Cisco Systems Inc, Red Hat Inc, Oracle Corporation.
3. What are the main segments of the Open Source Service Market?
The market segments include Service Type, End-user Industry.
4. Can you provide details about the market size?
The market size is estimated to be USD 34.99 Million as of 2022.
5. What are some drivers contributing to market growth?
Reduced Cost of Ownership and Time to Market; Interoperability and Flexibility in Terms of Customization.
6. What are the notable trends driving market growth?
Emphasis on Reduced Cost of Ownership and Time to Market is Expected to Drive the Market Growth.
7. Are there any restraints impacting market growth?
Security Issues.
8. Can you provide examples of recent developments in the market?
N/A
9. What pricing options are available for accessing the report?
Pricing options include single-user, multi-user, and enterprise licenses priced at USD 4750, USD 5250, and USD 8750 respectively.
10. Is the market size provided in terms of value or volume?
The market size is provided in terms of value, measured in Million.
11. Are there any specific market keywords associated with the report?
Yes, the market keyword associated with the report is "Open Source Service Market," which aids in identifying and referencing the specific market segment covered.
12. How do I determine which pricing option suits my needs best?
The pricing options vary based on user requirements and access needs. Individual users may opt for single-user licenses, while businesses requiring broader access may choose multi-user or enterprise licenses for cost-effective access to the report.
13. Are there any additional resources or data provided in the Open Source Service Market report?
While the report offers comprehensive insights, it's advisable to review the specific contents or supplementary materials provided to ascertain if additional resources or data are available.
14. How can I stay updated on further developments or reports in the Open Source Service Market?
To stay informed about further developments, trends, and reports in the Open Source Service Market, consider subscribing to industry newsletters, following relevant companies and organizations, or regularly checking reputable industry news sources and publications.
Methodology
Step 1 - Identification of Relevant Samples Size from Population Database


Step 2 - Approaches for Defining Global Market Size (Value, Volume* & Price*)

Note*: In applicable scenarios
Step 3 - Data Sources
Primary Research
- Web Analytics
- Survey Reports
- Research Institute
- Latest Research Reports
- Opinion Leaders
Secondary Research
- Annual Reports
- White Paper
- Latest Press Release
- Industry Association
- Paid Database
- Investor Presentations

Step 4 - Data Triangulation
Involves using different sources of information in order to increase the validity of a study
These sources are likely to be stakeholders in a program - participants, other researchers, program staff, other community members, and so on.
Then we put all data in single framework & apply various statistical tools to find out the dynamic on the market.
During the analysis stage, feedback from the stakeholder groups would be compared to determine areas of agreement as well as areas of divergence


