
Key Insights
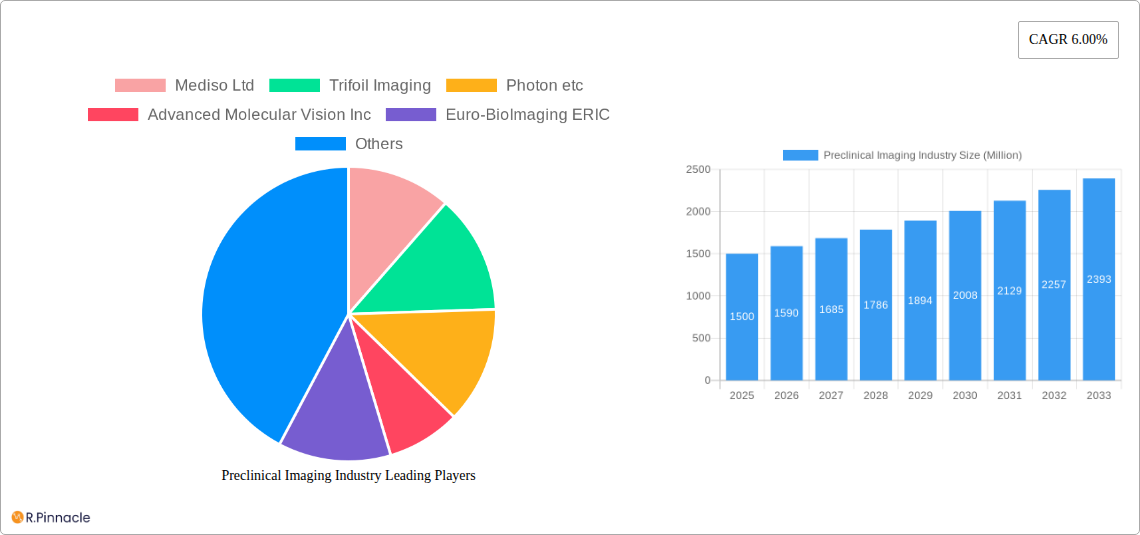
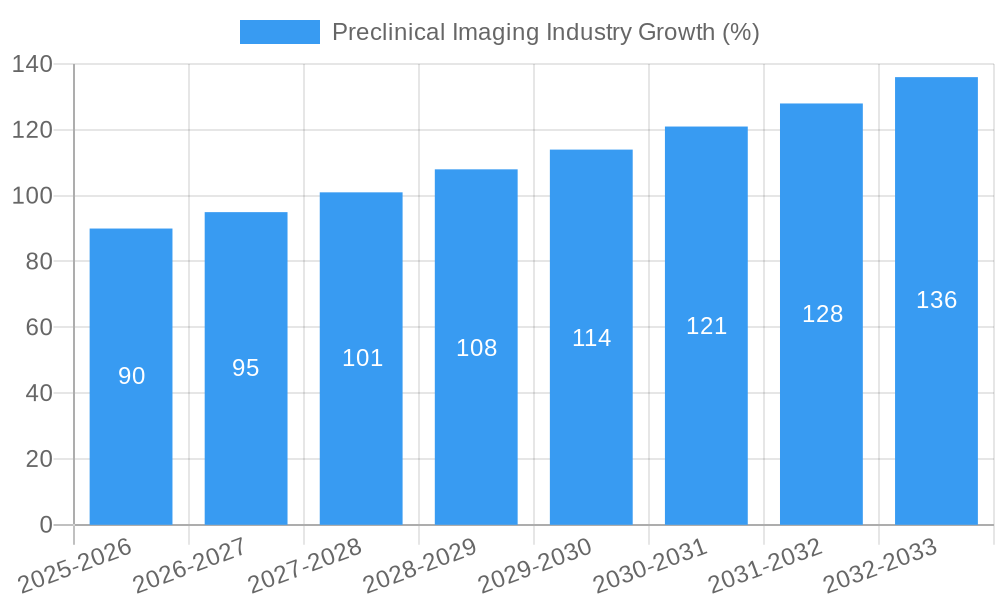
The preclinical imaging market, valued at approximately $1.5 billion in 2025, is projected to experience robust growth, driven by a compound annual growth rate (CAGR) of 6% from 2025 to 2033. This expansion is fueled by several key factors. Firstly, the increasing demand for advanced research tools in drug discovery and development is a major catalyst. Pharmaceutical and biotechnology companies are heavily investing in preclinical imaging technologies to accelerate the process of identifying and validating drug candidates, leading to faster time-to-market for new therapies. Secondly, technological advancements in various imaging modalities, such as micro-CT, optical imaging systems, and micro-MRI, are enhancing image resolution, sensitivity, and specificity, allowing researchers to obtain more detailed and accurate insights into biological processes. This improved data quality is crucial for optimizing preclinical studies and reducing the risk of failure in later clinical trials. Furthermore, the rising prevalence of chronic diseases globally is further driving demand for innovative preclinical imaging solutions, as researchers seek to understand the underlying mechanisms of these diseases and develop more effective treatments.
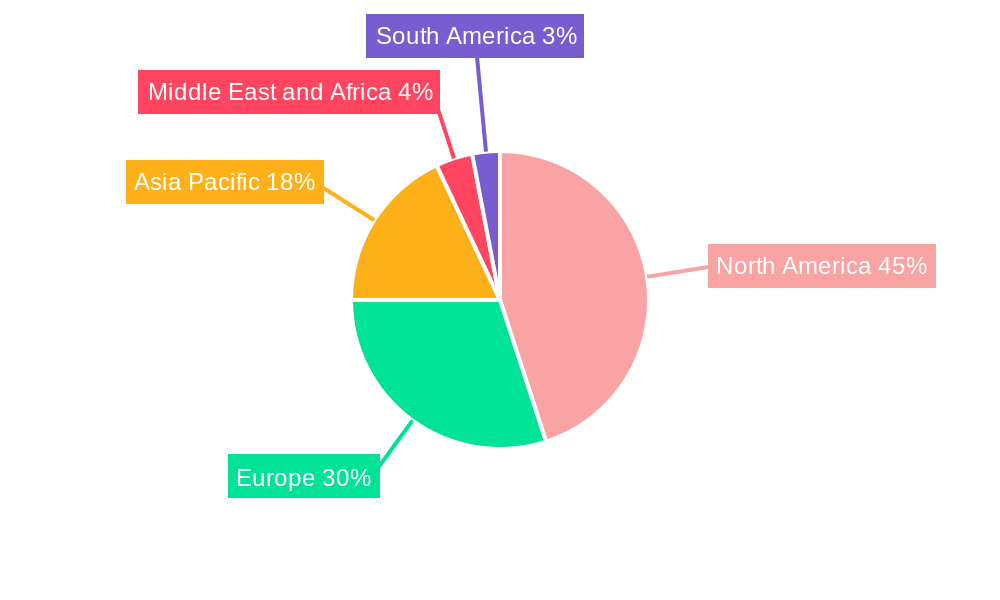
The market is segmented by modality, with optical imaging systems currently holding a significant market share due to their versatility and affordability. However, micro-CT and micro-MRI are witnessing rapid growth owing to their high-resolution capabilities and ability to provide three-dimensional anatomical information. Geographically, North America dominates the market, followed by Europe and Asia Pacific. However, emerging economies in Asia Pacific are expected to exhibit significant growth in the coming years, driven by increasing research investments and growing awareness of advanced imaging technologies. Despite the positive outlook, market growth may face certain restraints, including the high cost of advanced imaging equipment and the need for specialized training to operate and interpret the complex datasets generated by these systems. Nevertheless, the overall market trend points toward sustained growth, fueled by continuous technological innovation and the ever-increasing need for efficient and accurate preclinical research.
This comprehensive report provides a detailed analysis of the preclinical imaging industry, offering invaluable insights for industry professionals, investors, and researchers. Covering the period from 2019 to 2033, with a focus on 2025, this report examines market structure, dynamics, key players, and future trends. The global preclinical imaging market is projected to reach xx Million by 2033, exhibiting a robust CAGR of xx% during the forecast period (2025-2033).
Preclinical Imaging Industry Market Structure & Innovation Trends
The preclinical imaging market is characterized by a moderately concentrated landscape with several key players holding significant market share. Bruker Corporation, PerkinElmer Inc., and Fujifilm Holdings Corporation are among the leading companies, each contributing to a significant portion of the overall market revenue (xx Million, xx Million, and xx Million respectively in 2025). However, the market also features numerous smaller, specialized companies focusing on niche modalities or technologies. Market share dynamics are influenced by factors like technological advancements, regulatory approvals, and strategic mergers and acquisitions (M&A).
- Market Concentration: Moderately concentrated, with top 5 players accounting for approximately xx% of the market in 2025.
- Innovation Drivers: Advancements in imaging technologies, increasing demand for high-throughput screening, and growing R&D spending in the pharmaceutical and biotechnology sectors are key drivers.
- Regulatory Frameworks: Stringent regulatory requirements for medical devices influence market entry and product development.
- Product Substitutes: Limited direct substitutes exist, but alternative research methods can impact the demand for specific imaging modalities.
- End-User Demographics: Pharmaceutical and biotechnology companies, academic research institutions, and contract research organizations (CROs) are the primary end-users.
- M&A Activities: The past five years have witnessed several significant M&A deals valued at an estimated total of xx Million, primarily aimed at expanding product portfolios and market reach. Examples include (but are not limited to) strategic acquisitions by larger players to incorporate innovative technologies.
Preclinical Imaging Industry Market Dynamics & Trends
The preclinical imaging market is experiencing significant growth driven by several factors. The rising prevalence of chronic diseases globally fuels the demand for improved drug discovery and development processes. Technological advancements such as AI-powered image analysis and improved resolution in various imaging modalities are accelerating market expansion. The increasing adoption of preclinical imaging in personalized medicine and the development of novel imaging agents are also contributing to the market's growth trajectory. Competitive dynamics are shaped by continuous innovation, strategic partnerships, and the introduction of new products with enhanced features and capabilities. The market penetration of advanced imaging techniques like photoacoustic imaging is growing steadily, while the adoption of micro-CT remains high due to its established role in preclinical research. The overall market is expected to witness a CAGR of xx% from 2025 to 2033.
Dominant Regions & Segments in Preclinical Imaging Industry
North America currently dominates the preclinical imaging market, driven by strong R&D spending, a robust regulatory framework supportive of innovation, and the high concentration of pharmaceutical and biotechnology companies. Europe and Asia-Pacific are also witnessing significant growth, fueled by increasing healthcare spending and growing adoption of advanced imaging techniques.
Dominant Segments:
- Micro-CT: Holds the largest market share due to its widespread adoption and established role in preclinical research.
- Optical Imaging Systems: Experiencing rapid growth due to advancements in fluorescence and bioluminescence imaging technologies.
- Micro-MRI: A significant segment driven by the demand for high-resolution anatomical and functional imaging.
Key Drivers:
- North America: High R&D investment, strong presence of major players, and well-established regulatory framework.
- Europe: Growing focus on personalized medicine and increasing government support for research initiatives.
- Asia-Pacific: Rising healthcare expenditure, growing pharmaceutical industry, and increasing awareness of advanced medical technologies.
Preclinical Imaging Industry Product Innovations
Recent years have witnessed significant product innovations in the preclinical imaging field. Bruker's launch of its high-field MRI magnets exemplifies the trend towards higher resolution and sensitivity. PerkinElmer's introduction of the Vega imaging system highlights the integration of advanced automation and high-throughput capabilities for faster and more efficient research. These innovations cater to the increasing demand for faster and more accurate preclinical studies, pushing the boundaries of what is possible in drug discovery and development. The integration of AI and machine learning is another key innovation driver, enabling automated image analysis and faster data processing.
Report Scope & Segmentation Analysis
This report segments the preclinical imaging market by modality, encompassing: Optical Imaging Systems, Nuclear Imaging Systems, Micro-MRI, Micro-ultrasound, Micro-CT, Photoacoustic Imaging Systems, and Other Modality. Each segment is analyzed based on market size, growth rate, and competitive dynamics. For example, the Micro-CT segment is projected to maintain a significant market share throughout the forecast period driven by its established role and versatility. Optical imaging systems are poised for strong growth due to technological advancements. The nuclear imaging systems segment is expected to see steady growth based on continued applications in oncology research. Growth projections and market sizes are provided for each segment in the full report.
Key Drivers of Preclinical Imaging Industry Growth
Several factors are driving the growth of the preclinical imaging industry:
- Technological Advancements: Continuous improvement in imaging resolution, sensitivity, and speed is a key driver.
- Rising R&D Spending: Increased investment in drug discovery and development fuels demand for advanced preclinical imaging tools.
- Growing Prevalence of Chronic Diseases: This necessitates faster and more efficient drug development.
- Government Support: Funding for research and development in the healthcare sector stimulates market expansion.
Challenges in the Preclinical Imaging Industry Sector
The preclinical imaging industry faces several challenges:
- High Cost of Equipment: The high initial investment in advanced imaging systems poses a barrier to entry for some research institutions.
- Complex Regulatory Landscape: Navigating the regulatory pathways for new imaging agents and devices can be time-consuming and costly.
- Intense Competition: The presence of several established players creates a competitive environment.
- Data Analysis Complexity: Analyzing large datasets generated by advanced imaging technologies requires sophisticated tools and expertise.
Emerging Opportunities in Preclinical Imaging Industry
Emerging opportunities in preclinical imaging include:
- Integration of AI and Machine Learning: This facilitates automated image analysis and improves diagnostic accuracy.
- Development of Novel Imaging Agents: New agents with enhanced specificity and sensitivity are expanding research applications.
- Expansion into Emerging Markets: Growing healthcare expenditure in developing countries presents a significant opportunity.
- Development of Multimodal Imaging Systems: This allows researchers to obtain a more comprehensive view of biological processes.
Leading Players in the Preclinical Imaging Industry Market
- Mediso Ltd
- Trifoil Imaging
- Photon etc
- Advanced Molecular Vision Inc
- Euro-BioImaging ERIC
- MR Solutions Ltd
- Aspect Imaging Ltd
- PerkinElmer Inc
- IVIM Technology Corp
- Bruker Corporation
- AXT PTY LTD
- United Imaging Healthcare Co Ltd
- Fujifilm Holdings Corporation
Key Developments in Preclinical Imaging Industry Industry
- May 2022: Bruker launched innovative 7 Tesla and 9.4 Tesla conduction-cooled Maxwell magnets for its preclinical MRI systems. This significantly improved the resolution and sensitivity of MRI imaging.
- April 2022: PerkinElmer announced the Vega imaging system, a high-throughput ultrasound platform accelerating non-invasive research in various diseases. This expanded PerkinElmer's portfolio and offered researchers improved efficiency.
Future Outlook for Preclinical Imaging Industry Market
The preclinical imaging market is poised for continued growth, driven by technological advancements, increased R&D investment, and the growing demand for efficient drug discovery and development. The integration of artificial intelligence, the development of novel imaging agents, and the adoption of multimodal imaging systems will shape the future of the market. Companies focusing on innovation and strategic partnerships will be well-positioned to capitalize on the emerging opportunities in this dynamic sector.
Preclinical Imaging Industry Segmentation
-
1. Modality
- 1.1. Optical Imaging Systems
- 1.2. Nuclear Imaging Systems
- 1.3. Micro-MRI
- 1.4. Micro-ultrasound
- 1.5. Micro-CT
- 1.6. Photoacoustic Imaging Systems
- 1.7. Other Modality
Preclinical Imaging Industry Segmentation By Geography
-
1. North America
- 1.1. United States
- 1.2. Canada
- 1.3. Mexico
-
2. Europe
- 2.1. Germany
- 2.2. United Kingdom
- 2.3. France
- 2.4. Italy
- 2.5. Spain
- 2.6. Rest of Europe
-
3. Asia Pacific
- 3.1. China
- 3.2. Japan
- 3.3. India
- 3.4. Australia
- 3.5. South Korea
- 3.6. Rest of Asia Pacific
-
4. Middle East and Africa
- 4.1. GCC
- 4.2. South Africa
- 4.3. Rest of Middle East and Africa
-
5. South America
- 5.1. Brazil
- 5.2. Argentina
- 5.3. Rest of South America
Preclinical Imaging Industry REPORT HIGHLIGHTS
| Aspects | Details |
|---|---|
| Study Period | 2019-2033 |
| Base Year | 2024 |
| Estimated Year | 2025 |
| Forecast Period | 2025-2033 |
| Historical Period | 2019-2024 |
| Growth Rate | CAGR of 6.00% from 2019-2033 |
| Segmentation |
|
Table of Contents
- 1. Introduction
- 1.1. Research Scope
- 1.2. Market Segmentation
- 1.3. Research Methodology
- 1.4. Definitions and Assumptions
- 2. Executive Summary
- 2.1. Introduction
- 3. Market Dynamics
- 3.1. Introduction
- 3.2. Market Drivers
- 3.2.1 Technological Advancements in Molecular Imaging; Increasing Demand for Non-invasive Small Animal Imaging Techniques; Increase in Preclinical Research Funding
- 3.2.2 by Both Private and Public Organizations
- 3.3. Market Restrains
- 3.3.1. Strict Regulations in Preclinical Research; High Installation and Operational Costs associated with Preclinical Imaging Modalities
- 3.4. Market Trends
- 3.4.1. Micro-Ultrasound is the Segment by Modality and is Expected to be the Fastest Growing Market
- 4. Market Factor Analysis
- 4.1. Porters Five Forces
- 4.2. Supply/Value Chain
- 4.3. PESTEL analysis
- 4.4. Market Entropy
- 4.5. Patent/Trademark Analysis
- 5. Global Preclinical Imaging Industry Analysis, Insights and Forecast, 2019-2031
- 5.1. Market Analysis, Insights and Forecast - by Modality
- 5.1.1. Optical Imaging Systems
- 5.1.2. Nuclear Imaging Systems
- 5.1.3. Micro-MRI
- 5.1.4. Micro-ultrasound
- 5.1.5. Micro-CT
- 5.1.6. Photoacoustic Imaging Systems
- 5.1.7. Other Modality
- 5.2. Market Analysis, Insights and Forecast - by Region
- 5.2.1. North America
- 5.2.2. Europe
- 5.2.3. Asia Pacific
- 5.2.4. Middle East and Africa
- 5.2.5. South America
- 5.1. Market Analysis, Insights and Forecast - by Modality
- 6. North America Preclinical Imaging Industry Analysis, Insights and Forecast, 2019-2031
- 6.1. Market Analysis, Insights and Forecast - by Modality
- 6.1.1. Optical Imaging Systems
- 6.1.2. Nuclear Imaging Systems
- 6.1.3. Micro-MRI
- 6.1.4. Micro-ultrasound
- 6.1.5. Micro-CT
- 6.1.6. Photoacoustic Imaging Systems
- 6.1.7. Other Modality
- 6.1. Market Analysis, Insights and Forecast - by Modality
- 7. Europe Preclinical Imaging Industry Analysis, Insights and Forecast, 2019-2031
- 7.1. Market Analysis, Insights and Forecast - by Modality
- 7.1.1. Optical Imaging Systems
- 7.1.2. Nuclear Imaging Systems
- 7.1.3. Micro-MRI
- 7.1.4. Micro-ultrasound
- 7.1.5. Micro-CT
- 7.1.6. Photoacoustic Imaging Systems
- 7.1.7. Other Modality
- 7.1. Market Analysis, Insights and Forecast - by Modality
- 8. Asia Pacific Preclinical Imaging Industry Analysis, Insights and Forecast, 2019-2031
- 8.1. Market Analysis, Insights and Forecast - by Modality
- 8.1.1. Optical Imaging Systems
- 8.1.2. Nuclear Imaging Systems
- 8.1.3. Micro-MRI
- 8.1.4. Micro-ultrasound
- 8.1.5. Micro-CT
- 8.1.6. Photoacoustic Imaging Systems
- 8.1.7. Other Modality
- 8.1. Market Analysis, Insights and Forecast - by Modality
- 9. Middle East and Africa Preclinical Imaging Industry Analysis, Insights and Forecast, 2019-2031
- 9.1. Market Analysis, Insights and Forecast - by Modality
- 9.1.1. Optical Imaging Systems
- 9.1.2. Nuclear Imaging Systems
- 9.1.3. Micro-MRI
- 9.1.4. Micro-ultrasound
- 9.1.5. Micro-CT
- 9.1.6. Photoacoustic Imaging Systems
- 9.1.7. Other Modality
- 9.1. Market Analysis, Insights and Forecast - by Modality
- 10. South America Preclinical Imaging Industry Analysis, Insights and Forecast, 2019-2031
- 10.1. Market Analysis, Insights and Forecast - by Modality
- 10.1.1. Optical Imaging Systems
- 10.1.2. Nuclear Imaging Systems
- 10.1.3. Micro-MRI
- 10.1.4. Micro-ultrasound
- 10.1.5. Micro-CT
- 10.1.6. Photoacoustic Imaging Systems
- 10.1.7. Other Modality
- 10.1. Market Analysis, Insights and Forecast - by Modality
- 11. North America Preclinical Imaging Industry Analysis, Insights and Forecast, 2019-2031
- 11.1. Market Analysis, Insights and Forecast - By Country/Sub-region
- 11.1.1. undefined
- 12. Europe Preclinical Imaging Industry Analysis, Insights and Forecast, 2019-2031
- 12.1. Market Analysis, Insights and Forecast - By Country/Sub-region
- 12.1.1. undefined
- 13. Asia Pacific Preclinical Imaging Industry Analysis, Insights and Forecast, 2019-2031
- 13.1. Market Analysis, Insights and Forecast - By Country/Sub-region
- 13.1.1. undefined
- 14. Middle East and Africa Preclinical Imaging Industry Analysis, Insights and Forecast, 2019-2031
- 14.1. Market Analysis, Insights and Forecast - By Country/Sub-region
- 14.1.1. undefined
- 15. South America Preclinical Imaging Industry Analysis, Insights and Forecast, 2019-2031
- 15.1. Market Analysis, Insights and Forecast - By Country/Sub-region
- 15.1.1. undefined
- 16. Competitive Analysis
- 16.1. Global Market Share Analysis 2024
- 16.2. Company Profiles
- 16.2.1 Mediso Ltd
- 16.2.1.1. Overview
- 16.2.1.2. Products
- 16.2.1.3. SWOT Analysis
- 16.2.1.4. Recent Developments
- 16.2.1.5. Financials (Based on Availability)
- 16.2.2 Trifoil Imaging
- 16.2.2.1. Overview
- 16.2.2.2. Products
- 16.2.2.3. SWOT Analysis
- 16.2.2.4. Recent Developments
- 16.2.2.5. Financials (Based on Availability)
- 16.2.3 Photon etc
- 16.2.3.1. Overview
- 16.2.3.2. Products
- 16.2.3.3. SWOT Analysis
- 16.2.3.4. Recent Developments
- 16.2.3.5. Financials (Based on Availability)
- 16.2.4 Advanced Molecular Vision Inc
- 16.2.4.1. Overview
- 16.2.4.2. Products
- 16.2.4.3. SWOT Analysis
- 16.2.4.4. Recent Developments
- 16.2.4.5. Financials (Based on Availability)
- 16.2.5 Euro-BioImaging ERIC
- 16.2.5.1. Overview
- 16.2.5.2. Products
- 16.2.5.3. SWOT Analysis
- 16.2.5.4. Recent Developments
- 16.2.5.5. Financials (Based on Availability)
- 16.2.6 MR Solutions Ltd
- 16.2.6.1. Overview
- 16.2.6.2. Products
- 16.2.6.3. SWOT Analysis
- 16.2.6.4. Recent Developments
- 16.2.6.5. Financials (Based on Availability)
- 16.2.7 Aspect Imaging Ltd
- 16.2.7.1. Overview
- 16.2.7.2. Products
- 16.2.7.3. SWOT Analysis
- 16.2.7.4. Recent Developments
- 16.2.7.5. Financials (Based on Availability)
- 16.2.8 PerkinElmer Inc
- 16.2.8.1. Overview
- 16.2.8.2. Products
- 16.2.8.3. SWOT Analysis
- 16.2.8.4. Recent Developments
- 16.2.8.5. Financials (Based on Availability)
- 16.2.9 IVIM Technology Corp
- 16.2.9.1. Overview
- 16.2.9.2. Products
- 16.2.9.3. SWOT Analysis
- 16.2.9.4. Recent Developments
- 16.2.9.5. Financials (Based on Availability)
- 16.2.10 Bruker Corporation
- 16.2.10.1. Overview
- 16.2.10.2. Products
- 16.2.10.3. SWOT Analysis
- 16.2.10.4. Recent Developments
- 16.2.10.5. Financials (Based on Availability)
- 16.2.11 AXT PTY LTD
- 16.2.11.1. Overview
- 16.2.11.2. Products
- 16.2.11.3. SWOT Analysis
- 16.2.11.4. Recent Developments
- 16.2.11.5. Financials (Based on Availability)
- 16.2.12 United Imaging Healthcare Co Ltd
- 16.2.12.1. Overview
- 16.2.12.2. Products
- 16.2.12.3. SWOT Analysis
- 16.2.12.4. Recent Developments
- 16.2.12.5. Financials (Based on Availability)
- 16.2.13 Fujifilm Holdings Corporation
- 16.2.13.1. Overview
- 16.2.13.2. Products
- 16.2.13.3. SWOT Analysis
- 16.2.13.4. Recent Developments
- 16.2.13.5. Financials (Based on Availability)
- 16.2.1 Mediso Ltd
List of Figures
- Figure 1: Global Preclinical Imaging Industry Revenue Breakdown (Million, %) by Region 2024 & 2032
- Figure 2: Global Preclinical Imaging Industry Volume Breakdown (K Unit, %) by Region 2024 & 2032
- Figure 3: North America Preclinical Imaging Industry Revenue (Million), by Country 2024 & 2032
- Figure 4: North America Preclinical Imaging Industry Volume (K Unit), by Country 2024 & 2032
- Figure 5: North America Preclinical Imaging Industry Revenue Share (%), by Country 2024 & 2032
- Figure 6: North America Preclinical Imaging Industry Volume Share (%), by Country 2024 & 2032
- Figure 7: Europe Preclinical Imaging Industry Revenue (Million), by Country 2024 & 2032
- Figure 8: Europe Preclinical Imaging Industry Volume (K Unit), by Country 2024 & 2032
- Figure 9: Europe Preclinical Imaging Industry Revenue Share (%), by Country 2024 & 2032
- Figure 10: Europe Preclinical Imaging Industry Volume Share (%), by Country 2024 & 2032
- Figure 11: Asia Pacific Preclinical Imaging Industry Revenue (Million), by Country 2024 & 2032
- Figure 12: Asia Pacific Preclinical Imaging Industry Volume (K Unit), by Country 2024 & 2032
- Figure 13: Asia Pacific Preclinical Imaging Industry Revenue Share (%), by Country 2024 & 2032
- Figure 14: Asia Pacific Preclinical Imaging Industry Volume Share (%), by Country 2024 & 2032
- Figure 15: Middle East and Africa Preclinical Imaging Industry Revenue (Million), by Country 2024 & 2032
- Figure 16: Middle East and Africa Preclinical Imaging Industry Volume (K Unit), by Country 2024 & 2032
- Figure 17: Middle East and Africa Preclinical Imaging Industry Revenue Share (%), by Country 2024 & 2032
- Figure 18: Middle East and Africa Preclinical Imaging Industry Volume Share (%), by Country 2024 & 2032
- Figure 19: South America Preclinical Imaging Industry Revenue (Million), by Country 2024 & 2032
- Figure 20: South America Preclinical Imaging Industry Volume (K Unit), by Country 2024 & 2032
- Figure 21: South America Preclinical Imaging Industry Revenue Share (%), by Country 2024 & 2032
- Figure 22: South America Preclinical Imaging Industry Volume Share (%), by Country 2024 & 2032
- Figure 23: North America Preclinical Imaging Industry Revenue (Million), by Modality 2024 & 2032
- Figure 24: North America Preclinical Imaging Industry Volume (K Unit), by Modality 2024 & 2032
- Figure 25: North America Preclinical Imaging Industry Revenue Share (%), by Modality 2024 & 2032
- Figure 26: North America Preclinical Imaging Industry Volume Share (%), by Modality 2024 & 2032
- Figure 27: North America Preclinical Imaging Industry Revenue (Million), by Country 2024 & 2032
- Figure 28: North America Preclinical Imaging Industry Volume (K Unit), by Country 2024 & 2032
- Figure 29: North America Preclinical Imaging Industry Revenue Share (%), by Country 2024 & 2032
- Figure 30: North America Preclinical Imaging Industry Volume Share (%), by Country 2024 & 2032
- Figure 31: Europe Preclinical Imaging Industry Revenue (Million), by Modality 2024 & 2032
- Figure 32: Europe Preclinical Imaging Industry Volume (K Unit), by Modality 2024 & 2032
- Figure 33: Europe Preclinical Imaging Industry Revenue Share (%), by Modality 2024 & 2032
- Figure 34: Europe Preclinical Imaging Industry Volume Share (%), by Modality 2024 & 2032
- Figure 35: Europe Preclinical Imaging Industry Revenue (Million), by Country 2024 & 2032
- Figure 36: Europe Preclinical Imaging Industry Volume (K Unit), by Country 2024 & 2032
- Figure 37: Europe Preclinical Imaging Industry Revenue Share (%), by Country 2024 & 2032
- Figure 38: Europe Preclinical Imaging Industry Volume Share (%), by Country 2024 & 2032
- Figure 39: Asia Pacific Preclinical Imaging Industry Revenue (Million), by Modality 2024 & 2032
- Figure 40: Asia Pacific Preclinical Imaging Industry Volume (K Unit), by Modality 2024 & 2032
- Figure 41: Asia Pacific Preclinical Imaging Industry Revenue Share (%), by Modality 2024 & 2032
- Figure 42: Asia Pacific Preclinical Imaging Industry Volume Share (%), by Modality 2024 & 2032
- Figure 43: Asia Pacific Preclinical Imaging Industry Revenue (Million), by Country 2024 & 2032
- Figure 44: Asia Pacific Preclinical Imaging Industry Volume (K Unit), by Country 2024 & 2032
- Figure 45: Asia Pacific Preclinical Imaging Industry Revenue Share (%), by Country 2024 & 2032
- Figure 46: Asia Pacific Preclinical Imaging Industry Volume Share (%), by Country 2024 & 2032
- Figure 47: Middle East and Africa Preclinical Imaging Industry Revenue (Million), by Modality 2024 & 2032
- Figure 48: Middle East and Africa Preclinical Imaging Industry Volume (K Unit), by Modality 2024 & 2032
- Figure 49: Middle East and Africa Preclinical Imaging Industry Revenue Share (%), by Modality 2024 & 2032
- Figure 50: Middle East and Africa Preclinical Imaging Industry Volume Share (%), by Modality 2024 & 2032
- Figure 51: Middle East and Africa Preclinical Imaging Industry Revenue (Million), by Country 2024 & 2032
- Figure 52: Middle East and Africa Preclinical Imaging Industry Volume (K Unit), by Country 2024 & 2032
- Figure 53: Middle East and Africa Preclinical Imaging Industry Revenue Share (%), by Country 2024 & 2032
- Figure 54: Middle East and Africa Preclinical Imaging Industry Volume Share (%), by Country 2024 & 2032
- Figure 55: South America Preclinical Imaging Industry Revenue (Million), by Modality 2024 & 2032
- Figure 56: South America Preclinical Imaging Industry Volume (K Unit), by Modality 2024 & 2032
- Figure 57: South America Preclinical Imaging Industry Revenue Share (%), by Modality 2024 & 2032
- Figure 58: South America Preclinical Imaging Industry Volume Share (%), by Modality 2024 & 2032
- Figure 59: South America Preclinical Imaging Industry Revenue (Million), by Country 2024 & 2032
- Figure 60: South America Preclinical Imaging Industry Volume (K Unit), by Country 2024 & 2032
- Figure 61: South America Preclinical Imaging Industry Revenue Share (%), by Country 2024 & 2032
- Figure 62: South America Preclinical Imaging Industry Volume Share (%), by Country 2024 & 2032
List of Tables
- Table 1: Global Preclinical Imaging Industry Revenue Million Forecast, by Region 2019 & 2032
- Table 2: Global Preclinical Imaging Industry Volume K Unit Forecast, by Region 2019 & 2032
- Table 3: Global Preclinical Imaging Industry Revenue Million Forecast, by Modality 2019 & 2032
- Table 4: Global Preclinical Imaging Industry Volume K Unit Forecast, by Modality 2019 & 2032
- Table 5: Global Preclinical Imaging Industry Revenue Million Forecast, by Region 2019 & 2032
- Table 6: Global Preclinical Imaging Industry Volume K Unit Forecast, by Region 2019 & 2032
- Table 7: Global Preclinical Imaging Industry Revenue Million Forecast, by Country 2019 & 2032
- Table 8: Global Preclinical Imaging Industry Volume K Unit Forecast, by Country 2019 & 2032
- Table 9: Global Preclinical Imaging Industry Revenue Million Forecast, by Country 2019 & 2032
- Table 10: Global Preclinical Imaging Industry Volume K Unit Forecast, by Country 2019 & 2032
- Table 11: Global Preclinical Imaging Industry Revenue Million Forecast, by Country 2019 & 2032
- Table 12: Global Preclinical Imaging Industry Volume K Unit Forecast, by Country 2019 & 2032
- Table 13: Global Preclinical Imaging Industry Revenue Million Forecast, by Country 2019 & 2032
- Table 14: Global Preclinical Imaging Industry Volume K Unit Forecast, by Country 2019 & 2032
- Table 15: Global Preclinical Imaging Industry Revenue Million Forecast, by Country 2019 & 2032
- Table 16: Global Preclinical Imaging Industry Volume K Unit Forecast, by Country 2019 & 2032
- Table 17: Global Preclinical Imaging Industry Revenue Million Forecast, by Modality 2019 & 2032
- Table 18: Global Preclinical Imaging Industry Volume K Unit Forecast, by Modality 2019 & 2032
- Table 19: Global Preclinical Imaging Industry Revenue Million Forecast, by Country 2019 & 2032
- Table 20: Global Preclinical Imaging Industry Volume K Unit Forecast, by Country 2019 & 2032
- Table 21: United States Preclinical Imaging Industry Revenue (Million) Forecast, by Application 2019 & 2032
- Table 22: United States Preclinical Imaging Industry Volume (K Unit) Forecast, by Application 2019 & 2032
- Table 23: Canada Preclinical Imaging Industry Revenue (Million) Forecast, by Application 2019 & 2032
- Table 24: Canada Preclinical Imaging Industry Volume (K Unit) Forecast, by Application 2019 & 2032
- Table 25: Mexico Preclinical Imaging Industry Revenue (Million) Forecast, by Application 2019 & 2032
- Table 26: Mexico Preclinical Imaging Industry Volume (K Unit) Forecast, by Application 2019 & 2032
- Table 27: Global Preclinical Imaging Industry Revenue Million Forecast, by Modality 2019 & 2032
- Table 28: Global Preclinical Imaging Industry Volume K Unit Forecast, by Modality 2019 & 2032
- Table 29: Global Preclinical Imaging Industry Revenue Million Forecast, by Country 2019 & 2032
- Table 30: Global Preclinical Imaging Industry Volume K Unit Forecast, by Country 2019 & 2032
- Table 31: Germany Preclinical Imaging Industry Revenue (Million) Forecast, by Application 2019 & 2032
- Table 32: Germany Preclinical Imaging Industry Volume (K Unit) Forecast, by Application 2019 & 2032
- Table 33: United Kingdom Preclinical Imaging Industry Revenue (Million) Forecast, by Application 2019 & 2032
- Table 34: United Kingdom Preclinical Imaging Industry Volume (K Unit) Forecast, by Application 2019 & 2032
- Table 35: France Preclinical Imaging Industry Revenue (Million) Forecast, by Application 2019 & 2032
- Table 36: France Preclinical Imaging Industry Volume (K Unit) Forecast, by Application 2019 & 2032
- Table 37: Italy Preclinical Imaging Industry Revenue (Million) Forecast, by Application 2019 & 2032
- Table 38: Italy Preclinical Imaging Industry Volume (K Unit) Forecast, by Application 2019 & 2032
- Table 39: Spain Preclinical Imaging Industry Revenue (Million) Forecast, by Application 2019 & 2032
- Table 40: Spain Preclinical Imaging Industry Volume (K Unit) Forecast, by Application 2019 & 2032
- Table 41: Rest of Europe Preclinical Imaging Industry Revenue (Million) Forecast, by Application 2019 & 2032
- Table 42: Rest of Europe Preclinical Imaging Industry Volume (K Unit) Forecast, by Application 2019 & 2032
- Table 43: Global Preclinical Imaging Industry Revenue Million Forecast, by Modality 2019 & 2032
- Table 44: Global Preclinical Imaging Industry Volume K Unit Forecast, by Modality 2019 & 2032
- Table 45: Global Preclinical Imaging Industry Revenue Million Forecast, by Country 2019 & 2032
- Table 46: Global Preclinical Imaging Industry Volume K Unit Forecast, by Country 2019 & 2032
- Table 47: China Preclinical Imaging Industry Revenue (Million) Forecast, by Application 2019 & 2032
- Table 48: China Preclinical Imaging Industry Volume (K Unit) Forecast, by Application 2019 & 2032
- Table 49: Japan Preclinical Imaging Industry Revenue (Million) Forecast, by Application 2019 & 2032
- Table 50: Japan Preclinical Imaging Industry Volume (K Unit) Forecast, by Application 2019 & 2032
- Table 51: India Preclinical Imaging Industry Revenue (Million) Forecast, by Application 2019 & 2032
- Table 52: India Preclinical Imaging Industry Volume (K Unit) Forecast, by Application 2019 & 2032
- Table 53: Australia Preclinical Imaging Industry Revenue (Million) Forecast, by Application 2019 & 2032
- Table 54: Australia Preclinical Imaging Industry Volume (K Unit) Forecast, by Application 2019 & 2032
- Table 55: South Korea Preclinical Imaging Industry Revenue (Million) Forecast, by Application 2019 & 2032
- Table 56: South Korea Preclinical Imaging Industry Volume (K Unit) Forecast, by Application 2019 & 2032
- Table 57: Rest of Asia Pacific Preclinical Imaging Industry Revenue (Million) Forecast, by Application 2019 & 2032
- Table 58: Rest of Asia Pacific Preclinical Imaging Industry Volume (K Unit) Forecast, by Application 2019 & 2032
- Table 59: Global Preclinical Imaging Industry Revenue Million Forecast, by Modality 2019 & 2032
- Table 60: Global Preclinical Imaging Industry Volume K Unit Forecast, by Modality 2019 & 2032
- Table 61: Global Preclinical Imaging Industry Revenue Million Forecast, by Country 2019 & 2032
- Table 62: Global Preclinical Imaging Industry Volume K Unit Forecast, by Country 2019 & 2032
- Table 63: GCC Preclinical Imaging Industry Revenue (Million) Forecast, by Application 2019 & 2032
- Table 64: GCC Preclinical Imaging Industry Volume (K Unit) Forecast, by Application 2019 & 2032
- Table 65: South Africa Preclinical Imaging Industry Revenue (Million) Forecast, by Application 2019 & 2032
- Table 66: South Africa Preclinical Imaging Industry Volume (K Unit) Forecast, by Application 2019 & 2032
- Table 67: Rest of Middle East and Africa Preclinical Imaging Industry Revenue (Million) Forecast, by Application 2019 & 2032
- Table 68: Rest of Middle East and Africa Preclinical Imaging Industry Volume (K Unit) Forecast, by Application 2019 & 2032
- Table 69: Global Preclinical Imaging Industry Revenue Million Forecast, by Modality 2019 & 2032
- Table 70: Global Preclinical Imaging Industry Volume K Unit Forecast, by Modality 2019 & 2032
- Table 71: Global Preclinical Imaging Industry Revenue Million Forecast, by Country 2019 & 2032
- Table 72: Global Preclinical Imaging Industry Volume K Unit Forecast, by Country 2019 & 2032
- Table 73: Brazil Preclinical Imaging Industry Revenue (Million) Forecast, by Application 2019 & 2032
- Table 74: Brazil Preclinical Imaging Industry Volume (K Unit) Forecast, by Application 2019 & 2032
- Table 75: Argentina Preclinical Imaging Industry Revenue (Million) Forecast, by Application 2019 & 2032
- Table 76: Argentina Preclinical Imaging Industry Volume (K Unit) Forecast, by Application 2019 & 2032
- Table 77: Rest of South America Preclinical Imaging Industry Revenue (Million) Forecast, by Application 2019 & 2032
- Table 78: Rest of South America Preclinical Imaging Industry Volume (K Unit) Forecast, by Application 2019 & 2032
Frequently Asked Questions
1. What is the projected Compound Annual Growth Rate (CAGR) of the Preclinical Imaging Industry?
The projected CAGR is approximately 6.00%.
2. Which companies are prominent players in the Preclinical Imaging Industry?
Key companies in the market include Mediso Ltd, Trifoil Imaging, Photon etc, Advanced Molecular Vision Inc, Euro-BioImaging ERIC, MR Solutions Ltd, Aspect Imaging Ltd, PerkinElmer Inc, IVIM Technology Corp , Bruker Corporation, AXT PTY LTD, United Imaging Healthcare Co Ltd, Fujifilm Holdings Corporation.
3. What are the main segments of the Preclinical Imaging Industry?
The market segments include Modality.
4. Can you provide details about the market size?
The market size is estimated to be USD XX Million as of 2022.
5. What are some drivers contributing to market growth?
Technological Advancements in Molecular Imaging; Increasing Demand for Non-invasive Small Animal Imaging Techniques; Increase in Preclinical Research Funding. by Both Private and Public Organizations.
6. What are the notable trends driving market growth?
Micro-Ultrasound is the Segment by Modality and is Expected to be the Fastest Growing Market.
7. Are there any restraints impacting market growth?
Strict Regulations in Preclinical Research; High Installation and Operational Costs associated with Preclinical Imaging Modalities.
8. Can you provide examples of recent developments in the market?
In May 2022, Bruker launched innovative 7 Tesla and 9.4 Tesla conduction-cooled Maxwell magnets for its market-leading preclinical magnetic resonance imaging (MRI) systems portfolio.
9. What pricing options are available for accessing the report?
Pricing options include single-user, multi-user, and enterprise licenses priced at USD 4750, USD 5250, and USD 8750 respectively.
10. Is the market size provided in terms of value or volume?
The market size is provided in terms of value, measured in Million and volume, measured in K Unit.
11. Are there any specific market keywords associated with the report?
Yes, the market keyword associated with the report is "Preclinical Imaging Industry," which aids in identifying and referencing the specific market segment covered.
12. How do I determine which pricing option suits my needs best?
The pricing options vary based on user requirements and access needs. Individual users may opt for single-user licenses, while businesses requiring broader access may choose multi-user or enterprise licenses for cost-effective access to the report.
13. Are there any additional resources or data provided in the Preclinical Imaging Industry report?
While the report offers comprehensive insights, it's advisable to review the specific contents or supplementary materials provided to ascertain if additional resources or data are available.
14. How can I stay updated on further developments or reports in the Preclinical Imaging Industry?
To stay informed about further developments, trends, and reports in the Preclinical Imaging Industry, consider subscribing to industry newsletters, following relevant companies and organizations, or regularly checking reputable industry news sources and publications.
Methodology
Step 1 - Identification of Relevant Samples Size from Population Database


Step 2 - Approaches for Defining Global Market Size (Value, Volume* & Price*)

Note*: In applicable scenarios
Step 3 - Data Sources
Primary Research
- Web Analytics
- Survey Reports
- Research Institute
- Latest Research Reports
- Opinion Leaders
Secondary Research
- Annual Reports
- White Paper
- Latest Press Release
- Industry Association
- Paid Database
- Investor Presentations

Step 4 - Data Triangulation
Involves using different sources of information in order to increase the validity of a study
These sources are likely to be stakeholders in a program - participants, other researchers, program staff, other community members, and so on.
Then we put all data in single framework & apply various statistical tools to find out the dynamic on the market.
During the analysis stage, feedback from the stakeholder groups would be compared to determine areas of agreement as well as areas of divergence


