
Key Insights
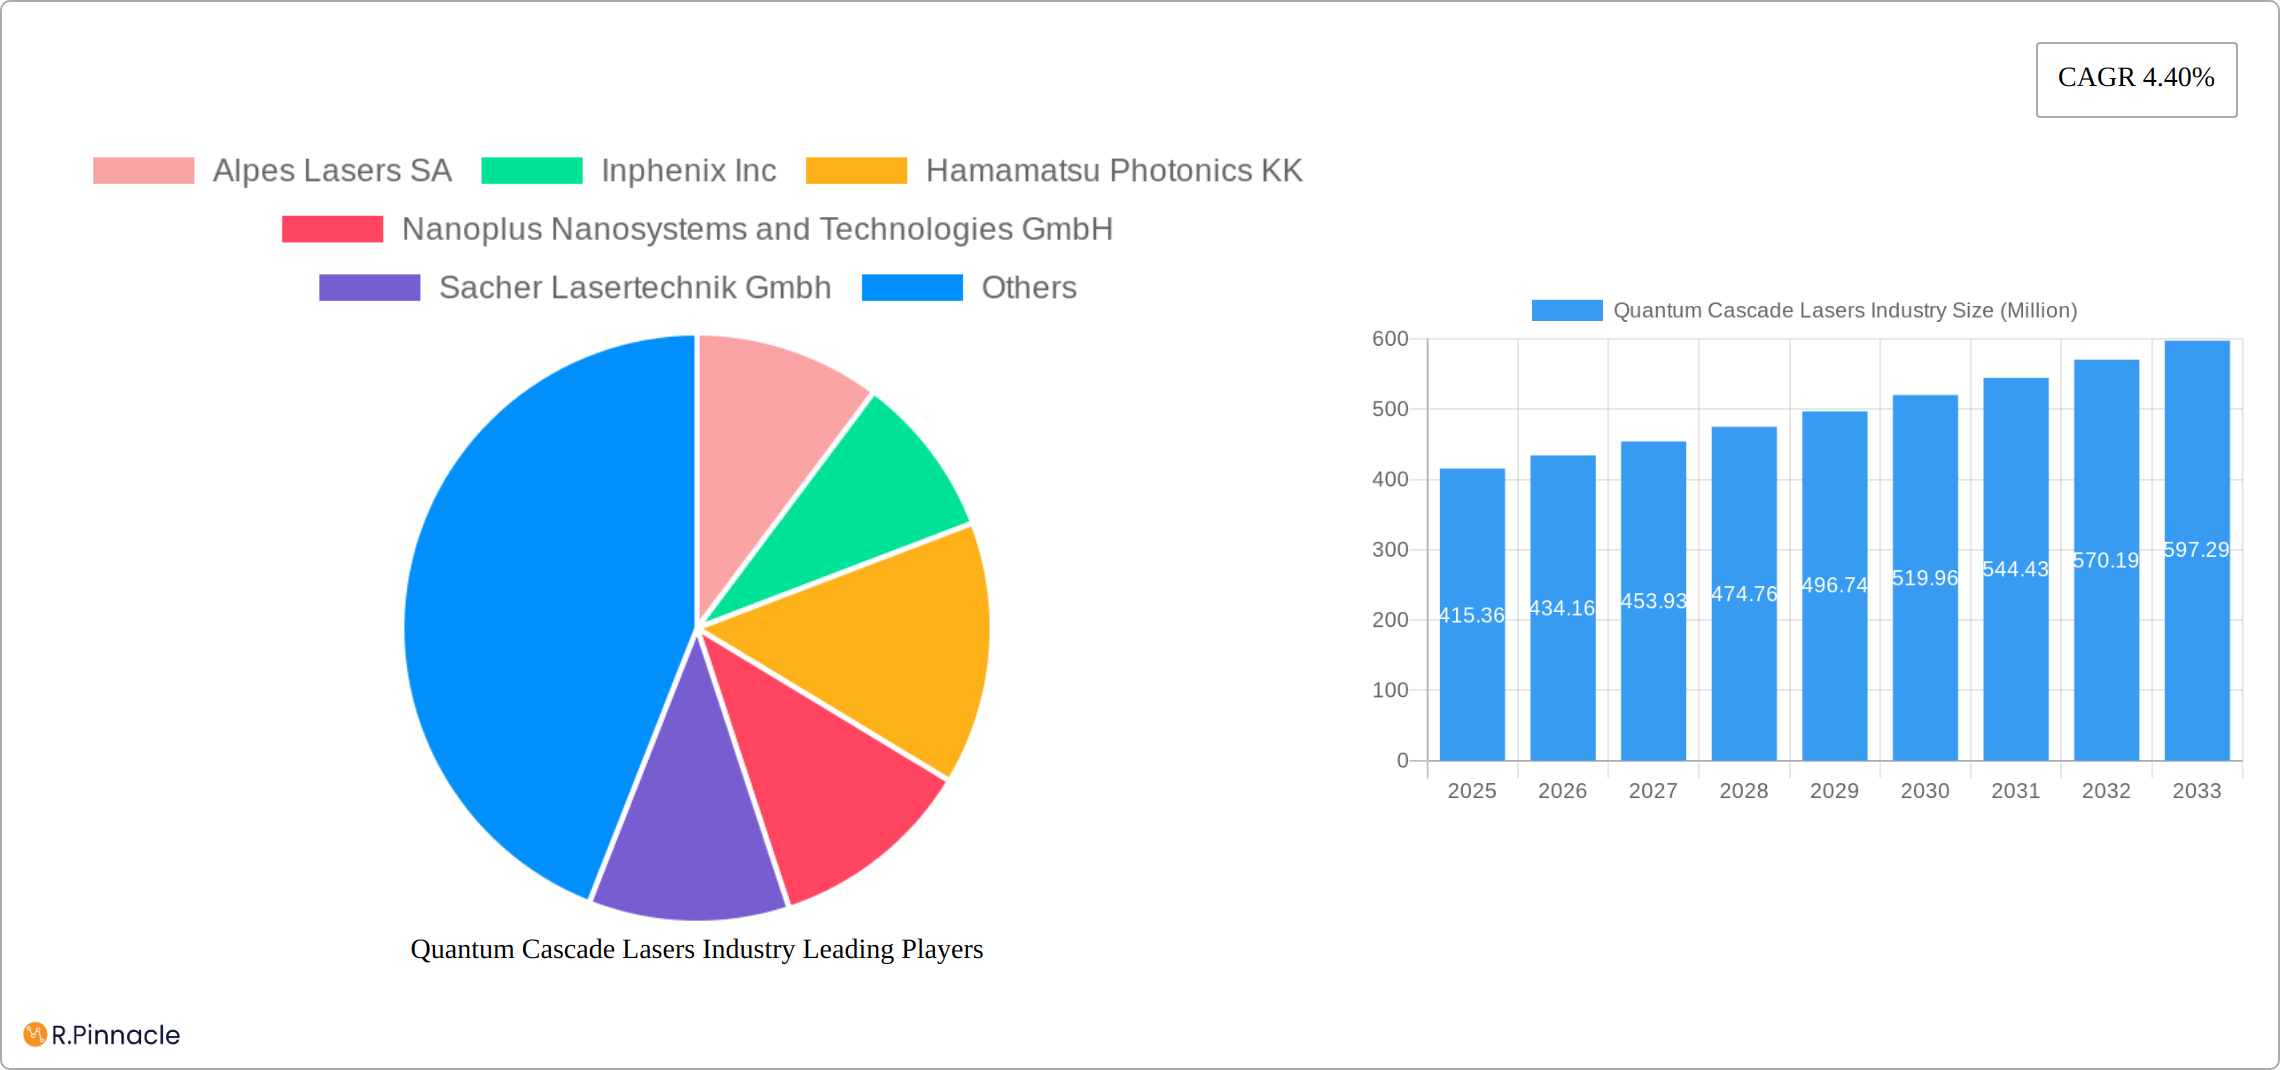
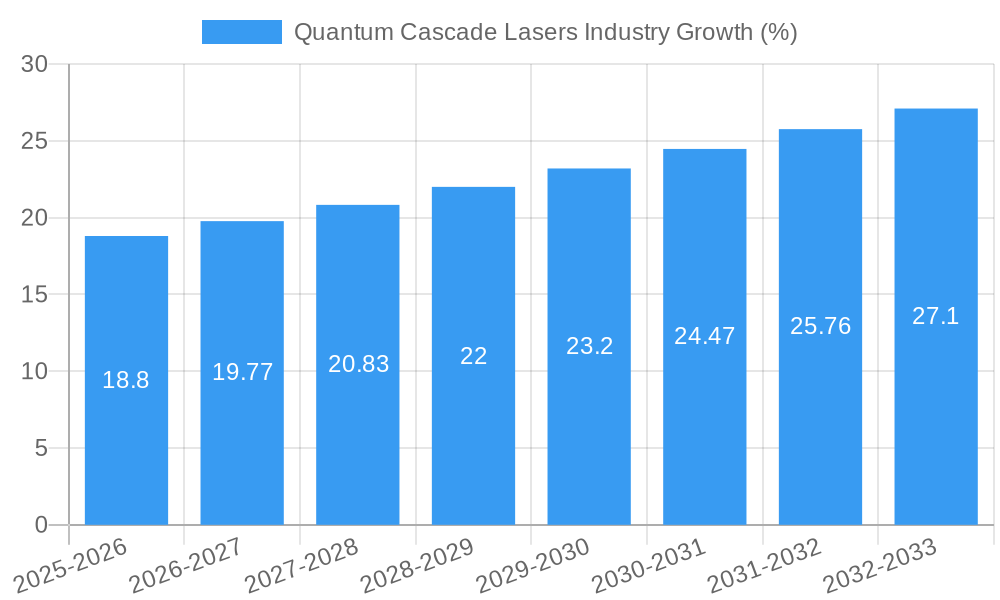
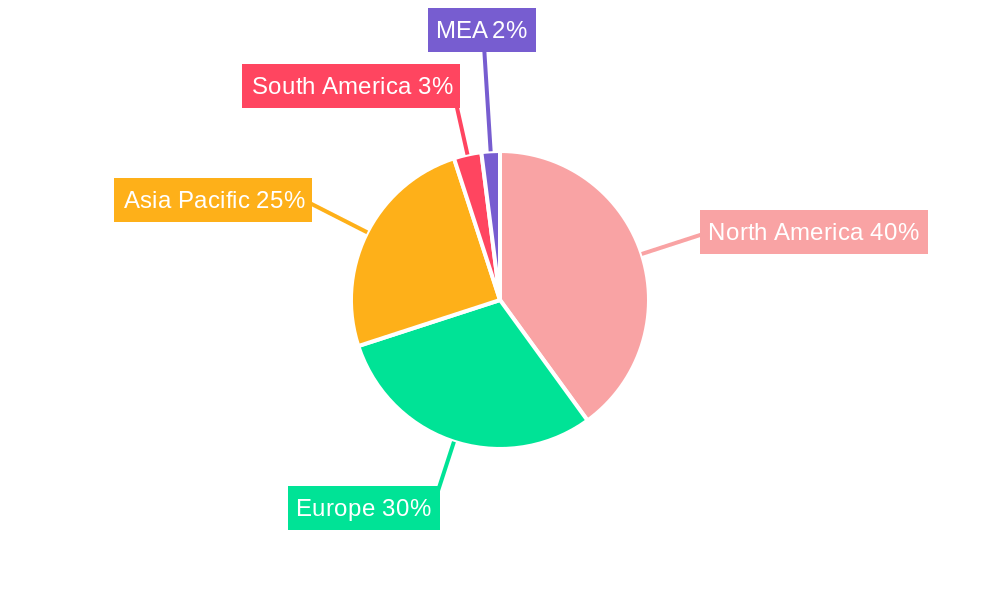
The Quantum Cascade Laser (QCL) market is experiencing robust growth, projected to reach \$415.36 million in 2025 and expand steadily over the forecast period (2025-2033) at a Compound Annual Growth Rate (CAGR) of 4.40%. This growth is driven by increasing demand across diverse sectors. The industrial sector, leveraging QCLs for precision manufacturing, material processing, and gas sensing applications, is a significant contributor. Simultaneously, advancements in medical technology, particularly in surgical procedures and diagnostics, are fueling market expansion. The military and defense sector's adoption of QCLs for advanced detection and ranging systems further bolsters market growth. Telecommunications, benefiting from the high-performance capabilities of QCLs in optical communication systems, also represents a key growth driver. The food and beverage industry utilizes QCLs for process monitoring and quality control, contributing to the overall market expansion. Technological advancements in tunable lasers and improved performance characteristics are key trends enhancing market appeal. However, the high cost of QCLs and the need for specialized expertise for operation and maintenance pose some restraints on market penetration, especially in smaller companies and developing nations. Further segmentation reveals that Fabry-Perot lasers currently dominate the type segment, while continuous wave lasers lead in the operation segment. North America currently holds a significant market share due to strong technological advancements and established research infrastructure, closely followed by Europe and Asia-Pacific regions experiencing rapid growth.
The competitive landscape is characterized by both established players and emerging companies. Key players like Alpes Lasers SA, Inphenix Inc., and Hamamatsu Photonics KK are focusing on product innovation and strategic partnerships to maintain their market positions. The emergence of innovative start-ups also adds dynamism to the market, pushing technological boundaries and further driving competition. The forecast suggests sustained growth, driven by ongoing technological improvements, expanding applications across various industries, and continued investments in R&D. While cost remains a barrier, ongoing miniaturization and manufacturing advancements are expected to improve affordability, contributing to broader market adoption in the coming years. Geographical expansion, especially into developing economies with growing industrialization and technological advancements, is expected to further fuel the QCL market's impressive growth trajectory.
Quantum Cascade Lasers Industry Report: 2019-2033
This comprehensive report provides an in-depth analysis of the Quantum Cascade Lasers (QCL) industry, offering invaluable insights for industry professionals, investors, and researchers. Covering the period 2019-2033, with a focus on 2025, this report forecasts significant growth and outlines key opportunities within this rapidly evolving sector. The global market is projected to reach xx Million by 2033.
Quantum Cascade Lasers Industry Market Structure & Innovation Trends
The Quantum Cascade Laser (QCL) market is characterized by a moderately concentrated structure, with several key players holding significant market share. Alpes Lasers SA, Inphenix Inc, Hamamatsu Photonics KK, Nanoplus Nanosystems and Technologies GmbH, Sacher Lasertechnik GmbH, Leonardo DRS Inc, Block Engineering Inc, Mirsense SAS, Thorlabs Inc, and Adtech Optics Inc are among the prominent companies shaping the landscape. Market share data for 2024 indicates that the top five companies collectively hold approximately 60% of the market, suggesting a degree of oligopolistic competition.
Innovation within the QCL industry is driven primarily by advancements in materials science, enabling the development of lasers with improved performance characteristics, such as higher power output, narrower linewidths, and extended operational wavelengths. Regulatory frameworks, including safety standards and environmental regulations, play a crucial role in shaping product development and market access. While there are few direct substitutes for QCLs in their specific niche applications, competing technologies in adjacent markets such as fiber lasers and other semiconductor lasers influence adoption.
Mergers and acquisitions (M&A) have played a relatively minor role in recent years, with a few notable deals valued at under xx Million. These transactions generally focused on expanding technological capabilities or geographic reach. The increasing demand for QCLs in various applications is expected to fuel further consolidation in the coming years.
- Market Concentration: Moderate, top 5 players holding ~60% market share (2024).
- Innovation Drivers: Advancements in materials science, improving power output, linewidth, and wavelength range.
- Regulatory Landscape: Safety and environmental standards influence product development.
- M&A Activity: Limited recent activity, with smaller deals (< xx Million) focused on technology and expansion.
Quantum Cascade Lasers Industry Market Dynamics & Trends
The Quantum Cascade Laser market is experiencing robust growth, fueled by increasing demand across diverse end-user industries. The compound annual growth rate (CAGR) is projected to be xx% during the forecast period (2025-2033), driven by several key factors. Technological advancements, such as the development of more efficient and cost-effective QCLs, are significantly improving market penetration across various sectors. Consumer preferences for high-performance and reliable laser technology further support market growth.
The competitive landscape is dynamic, with companies investing heavily in R&D to maintain a competitive edge. This translates into continuous improvements in QCL performance, leading to wider adoption in both established and emerging applications. Price competition is a factor but is often outweighed by the performance and reliability offered by leading QCL manufacturers. The market is further shaped by industry trends, including the miniaturization of QCLs, advancements in laser cooling technologies and the integration of QCLs into sophisticated systems.
- CAGR (2025-2033): xx%
- Market Penetration: Increasing across various sectors driven by technological advancements and consumer preference.
- Competitive Dynamics: Driven by R&D investment, focusing on performance improvements.
Dominant Regions & Segments in Quantum Cascade Lasers Industry
The North American region currently holds a significant share of the global QCL market, driven by strong demand from the medical and defense sectors, coupled with robust technological advancements. This dominance is further solidified by the presence of several key QCL manufacturers and significant R&D investment within the region. European markets also contribute significantly, fueled by strong industrial applications and government initiatives. The Asia-Pacific region, though currently smaller, displays high growth potential due to burgeoning industrialization and increasing investment in advanced technologies.
By Type:
Distributed Feedback (DFB) Lasers: This segment is experiencing the fastest growth rate due to its superior spectral characteristics, making it ideal for high-precision applications like gas sensing and spectroscopy. Nano plus Nanosystems and Technologies GmbH's recent launch of new CW-DFB QCLs underscores this segment's potential.
Fabry-Perot Lasers: This segment maintains a significant market share due to its cost-effectiveness and suitability for a broad range of applications.
Tunable External Cavity Lasers: This niche segment is expected to show moderate growth, driven by the demand for highly flexible and precise wavelength selection.
By Operation:
Continuous Wave (CW): CW QCLs hold a dominant market share due to their suitability for many applications. The new single-mode CW-QCL from Nanoplus further strengthens this segment.
Pulsed Wave: Pulsed wave QCLs are used in niche applications requiring high peak power, showing slower but steady growth.
By End-user Industry:
Medical: This segment is a major driver of QCL market growth, thanks to the growing demand for advanced medical diagnostic tools and laser surgery.
Military & Defense: Strong demand for high-performance lasers used in rangefinding, target designation, and other military applications propels this segment.
Industrial: Industrial applications, including sensing, process monitoring, and materials processing, contribute significantly to market growth.
Quantum Cascade Lasers Industry Product Innovations
Recent innovations in QCL technology have focused on enhancing performance metrics like power output, wavelength range, and operating temperature. The development of single-mode, continuous-wave QCLs operating in the far-infrared spectrum by Nanoplus, exemplified by their CW-DFB QCLs, represents a key advancement. These improvements are expanding the applications of QCLs in various sectors, including ultra-sensitive sensing and spectroscopy. The ongoing trend of miniaturization and increased integration is further improving the market fit of these lasers across diverse applications.
Report Scope & Segmentation Analysis
This report comprehensively analyzes the QCL market across various segments:
By Type: Fabry-Perot, Distributed Feedback (DFB), Tunable External Cavity Lasers. Each segment's growth trajectory is assessed, considering technological advancements and market demand. Market sizes and competitive landscapes are detailed for each type.
By Operation: Continuous Wave (CW) and Pulsed Wave. The report analyzes the market share and growth projections for each operational mode, based on specific application requirements.
By End-user Industry: Industrial, Medical, Military & Defense, Telecommunication, Food & Beverage, and Other End-user Industries. Each segment's market size, growth drivers, and challenges are explored.
Key Drivers of Quantum Cascade Lasers Industry Growth
The QCL market's expansion is driven by several key factors. Technological advancements constantly enhance QCL performance and efficiency, leading to wider adoption. The increasing demand from diverse end-user industries, particularly in medical diagnostics, environmental monitoring, and defense, fuels significant growth. Government initiatives and funding focused on quantum technologies, like the French PROQCIMA project (March 2024), are further catalyzing market development. Furthermore, cost reductions in QCL manufacturing improve affordability and expand market access.
Challenges in the Quantum Cascade Lasers Industry Sector
The QCL industry faces challenges, including high initial capital investment for manufacturing and R&D. Supply chain disruptions can impact production, leading to delays and potential price fluctuations. Intense competition among established players necessitates continuous innovation and cost management to maintain a competitive edge. Stringent regulatory requirements for laser safety also pose hurdles for new entrants and existing players.
Emerging Opportunities in Quantum Cascade Lasers Industry
Emerging opportunities abound, including advancements in mid-infrared and far-infrared spectroscopy, creating demand for highly sensitive and specific QCLs. The integration of QCLs into compact and portable systems expands applications across diverse industries. New applications in environmental monitoring, industrial process control, and medical imaging are opening up promising avenues for growth. Furthermore, the potential for miniaturization and the development of more robust QCLs opens up further market penetration.
Leading Players in the Quantum Cascade Lasers Industry Market
- Alpes Lasers SA
- Inphenix Inc
- Hamamatsu Photonics KK
- Nanoplus Nanosystems and Technologies GmbH
- Sacher Lasertechnik GmbH
- Leonardo DRS Inc
- Block Engineering Inc
- Mirsense SAS
- Thorlabs Inc
- Adtech Optics Inc
Key Developments in Quantum Cascade Lasers Industry
March 2024: The French quantum ecosystem announced PROQCIMA, aiming to develop universal quantum computers by 2030. This initiative may significantly boost demand for QCL technology in quantum sensing and communication applications.
October 2023: Nanoplus Nanosystems and Technologies GmbH launched new single-mode continuous-wave (CW) QCLs for the far-infrared range, expanding applications in ultra-sensitive and custom applications. The launch of CW Distributed Feedback QCLs further strengthened their product portfolio.
Future Outlook for Quantum Cascade Lasers Industry Market
The future of the QCL market looks bright, with significant growth projected across all segments. Continuous technological advancements, increasing demand across diverse applications, and supportive government initiatives will drive market expansion. Strategic partnerships and M&A activities are likely to shape the industry landscape, leading to further consolidation and technological innovation. The expansion into emerging applications and markets presents significant opportunities for growth in the coming years.
Quantum Cascade Lasers Industry Segmentation
-
1. Type
- 1.1. Fabry-Perot Lasers
- 1.2. Distributed Feedback Lasers
- 1.3. Tunable External Cavity Lasers
-
2. Operation
- 2.1. Continuous Wave
- 2.2. Pulsed Wave
-
3. End-user Industry
- 3.1. Industrial
- 3.2. Medical
- 3.3. Military and Defense
- 3.4. Telecommunication
- 3.5. Food and Beverage
- 3.6. Other End-user Industries
Quantum Cascade Lasers Industry Segmentation By Geography
-
1. North America
- 1.1. United States
- 1.2. Canada
-
2. Europe
- 2.1. United Kingdom
- 2.2. Germany
- 2.3. France
-
3. Asia
- 3.1. China
- 3.2. Japan
- 3.3. South Korea
- 3.4. India
- 4. Australia and New Zealand
- 5. Latin America
- 6. Middle East and Africa
Quantum Cascade Lasers Industry REPORT HIGHLIGHTS
| Aspects | Details |
|---|---|
| Study Period | 2019-2033 |
| Base Year | 2024 |
| Estimated Year | 2025 |
| Forecast Period | 2025-2033 |
| Historical Period | 2019-2024 |
| Growth Rate | CAGR of 4.40% from 2019-2033 |
| Segmentation |
|
Table of Contents
- 1. Introduction
- 1.1. Research Scope
- 1.2. Market Segmentation
- 1.3. Research Methodology
- 1.4. Definitions and Assumptions
- 2. Executive Summary
- 2.1. Introduction
- 3. Market Dynamics
- 3.1. Introduction
- 3.2. Market Drivers
- 3.2.1. Growing Need For Precision in the Medical Activities; Increased Demand of Gas Sensing and Chemical Detection Applications in the Military and Defense
- 3.3. Market Restrains
- 3.3.1. Cost and Absence of Standardization of pH Sensor Devices
- 3.4. Market Trends
- 3.4.1. Industrial End-User Industry to Hold Significant Market Share
- 4. Market Factor Analysis
- 4.1. Porters Five Forces
- 4.2. Supply/Value Chain
- 4.3. PESTEL analysis
- 4.4. Market Entropy
- 4.5. Patent/Trademark Analysis
- 5. Global Quantum Cascade Lasers Industry Analysis, Insights and Forecast, 2019-2031
- 5.1. Market Analysis, Insights and Forecast - by Type
- 5.1.1. Fabry-Perot Lasers
- 5.1.2. Distributed Feedback Lasers
- 5.1.3. Tunable External Cavity Lasers
- 5.2. Market Analysis, Insights and Forecast - by Operation
- 5.2.1. Continuous Wave
- 5.2.2. Pulsed Wave
- 5.3. Market Analysis, Insights and Forecast - by End-user Industry
- 5.3.1. Industrial
- 5.3.2. Medical
- 5.3.3. Military and Defense
- 5.3.4. Telecommunication
- 5.3.5. Food and Beverage
- 5.3.6. Other End-user Industries
- 5.4. Market Analysis, Insights and Forecast - by Region
- 5.4.1. North America
- 5.4.2. Europe
- 5.4.3. Asia
- 5.4.4. Australia and New Zealand
- 5.4.5. Latin America
- 5.4.6. Middle East and Africa
- 5.1. Market Analysis, Insights and Forecast - by Type
- 6. North America Quantum Cascade Lasers Industry Analysis, Insights and Forecast, 2019-2031
- 6.1. Market Analysis, Insights and Forecast - by Type
- 6.1.1. Fabry-Perot Lasers
- 6.1.2. Distributed Feedback Lasers
- 6.1.3. Tunable External Cavity Lasers
- 6.2. Market Analysis, Insights and Forecast - by Operation
- 6.2.1. Continuous Wave
- 6.2.2. Pulsed Wave
- 6.3. Market Analysis, Insights and Forecast - by End-user Industry
- 6.3.1. Industrial
- 6.3.2. Medical
- 6.3.3. Military and Defense
- 6.3.4. Telecommunication
- 6.3.5. Food and Beverage
- 6.3.6. Other End-user Industries
- 6.1. Market Analysis, Insights and Forecast - by Type
- 7. Europe Quantum Cascade Lasers Industry Analysis, Insights and Forecast, 2019-2031
- 7.1. Market Analysis, Insights and Forecast - by Type
- 7.1.1. Fabry-Perot Lasers
- 7.1.2. Distributed Feedback Lasers
- 7.1.3. Tunable External Cavity Lasers
- 7.2. Market Analysis, Insights and Forecast - by Operation
- 7.2.1. Continuous Wave
- 7.2.2. Pulsed Wave
- 7.3. Market Analysis, Insights and Forecast - by End-user Industry
- 7.3.1. Industrial
- 7.3.2. Medical
- 7.3.3. Military and Defense
- 7.3.4. Telecommunication
- 7.3.5. Food and Beverage
- 7.3.6. Other End-user Industries
- 7.1. Market Analysis, Insights and Forecast - by Type
- 8. Asia Quantum Cascade Lasers Industry Analysis, Insights and Forecast, 2019-2031
- 8.1. Market Analysis, Insights and Forecast - by Type
- 8.1.1. Fabry-Perot Lasers
- 8.1.2. Distributed Feedback Lasers
- 8.1.3. Tunable External Cavity Lasers
- 8.2. Market Analysis, Insights and Forecast - by Operation
- 8.2.1. Continuous Wave
- 8.2.2. Pulsed Wave
- 8.3. Market Analysis, Insights and Forecast - by End-user Industry
- 8.3.1. Industrial
- 8.3.2. Medical
- 8.3.3. Military and Defense
- 8.3.4. Telecommunication
- 8.3.5. Food and Beverage
- 8.3.6. Other End-user Industries
- 8.1. Market Analysis, Insights and Forecast - by Type
- 9. Australia and New Zealand Quantum Cascade Lasers Industry Analysis, Insights and Forecast, 2019-2031
- 9.1. Market Analysis, Insights and Forecast - by Type
- 9.1.1. Fabry-Perot Lasers
- 9.1.2. Distributed Feedback Lasers
- 9.1.3. Tunable External Cavity Lasers
- 9.2. Market Analysis, Insights and Forecast - by Operation
- 9.2.1. Continuous Wave
- 9.2.2. Pulsed Wave
- 9.3. Market Analysis, Insights and Forecast - by End-user Industry
- 9.3.1. Industrial
- 9.3.2. Medical
- 9.3.3. Military and Defense
- 9.3.4. Telecommunication
- 9.3.5. Food and Beverage
- 9.3.6. Other End-user Industries
- 9.1. Market Analysis, Insights and Forecast - by Type
- 10. Latin America Quantum Cascade Lasers Industry Analysis, Insights and Forecast, 2019-2031
- 10.1. Market Analysis, Insights and Forecast - by Type
- 10.1.1. Fabry-Perot Lasers
- 10.1.2. Distributed Feedback Lasers
- 10.1.3. Tunable External Cavity Lasers
- 10.2. Market Analysis, Insights and Forecast - by Operation
- 10.2.1. Continuous Wave
- 10.2.2. Pulsed Wave
- 10.3. Market Analysis, Insights and Forecast - by End-user Industry
- 10.3.1. Industrial
- 10.3.2. Medical
- 10.3.3. Military and Defense
- 10.3.4. Telecommunication
- 10.3.5. Food and Beverage
- 10.3.6. Other End-user Industries
- 10.1. Market Analysis, Insights and Forecast - by Type
- 11. Middle East and Africa Quantum Cascade Lasers Industry Analysis, Insights and Forecast, 2019-2031
- 11.1. Market Analysis, Insights and Forecast - by Type
- 11.1.1. Fabry-Perot Lasers
- 11.1.2. Distributed Feedback Lasers
- 11.1.3. Tunable External Cavity Lasers
- 11.2. Market Analysis, Insights and Forecast - by Operation
- 11.2.1. Continuous Wave
- 11.2.2. Pulsed Wave
- 11.3. Market Analysis, Insights and Forecast - by End-user Industry
- 11.3.1. Industrial
- 11.3.2. Medical
- 11.3.3. Military and Defense
- 11.3.4. Telecommunication
- 11.3.5. Food and Beverage
- 11.3.6. Other End-user Industries
- 11.1. Market Analysis, Insights and Forecast - by Type
- 12. North America Quantum Cascade Lasers Industry Analysis, Insights and Forecast, 2019-2031
- 12.1. Market Analysis, Insights and Forecast - By Country/Sub-region
- 12.1.1 United States
- 12.1.2 Canada
- 12.1.3 Mexico
- 13. Europe Quantum Cascade Lasers Industry Analysis, Insights and Forecast, 2019-2031
- 13.1. Market Analysis, Insights and Forecast - By Country/Sub-region
- 13.1.1 Germany
- 13.1.2 United Kingdom
- 13.1.3 France
- 13.1.4 Spain
- 13.1.5 Italy
- 13.1.6 Spain
- 13.1.7 Belgium
- 13.1.8 Netherland
- 13.1.9 Nordics
- 13.1.10 Rest of Europe
- 14. Asia Pacific Quantum Cascade Lasers Industry Analysis, Insights and Forecast, 2019-2031
- 14.1. Market Analysis, Insights and Forecast - By Country/Sub-region
- 14.1.1 China
- 14.1.2 Japan
- 14.1.3 India
- 14.1.4 South Korea
- 14.1.5 Southeast Asia
- 14.1.6 Australia
- 14.1.7 Indonesia
- 14.1.8 Phillipes
- 14.1.9 Singapore
- 14.1.10 Thailandc
- 14.1.11 Rest of Asia Pacific
- 15. South America Quantum Cascade Lasers Industry Analysis, Insights and Forecast, 2019-2031
- 15.1. Market Analysis, Insights and Forecast - By Country/Sub-region
- 15.1.1 Brazil
- 15.1.2 Argentina
- 15.1.3 Peru
- 15.1.4 Chile
- 15.1.5 Colombia
- 15.1.6 Ecuador
- 15.1.7 Venezuela
- 15.1.8 Rest of South America
- 16. North America Quantum Cascade Lasers Industry Analysis, Insights and Forecast, 2019-2031
- 16.1. Market Analysis, Insights and Forecast - By Country/Sub-region
- 16.1.1 United States
- 16.1.2 Canada
- 16.1.3 Mexico
- 17. MEA Quantum Cascade Lasers Industry Analysis, Insights and Forecast, 2019-2031
- 17.1. Market Analysis, Insights and Forecast - By Country/Sub-region
- 17.1.1 United Arab Emirates
- 17.1.2 Saudi Arabia
- 17.1.3 South Africa
- 17.1.4 Rest of Middle East and Africa
- 18. Competitive Analysis
- 18.1. Global Market Share Analysis 2024
- 18.2. Company Profiles
- 18.2.1 Alpes Lasers SA
- 18.2.1.1. Overview
- 18.2.1.2. Products
- 18.2.1.3. SWOT Analysis
- 18.2.1.4. Recent Developments
- 18.2.1.5. Financials (Based on Availability)
- 18.2.2 Inphenix Inc
- 18.2.2.1. Overview
- 18.2.2.2. Products
- 18.2.2.3. SWOT Analysis
- 18.2.2.4. Recent Developments
- 18.2.2.5. Financials (Based on Availability)
- 18.2.3 Hamamatsu Photonics KK
- 18.2.3.1. Overview
- 18.2.3.2. Products
- 18.2.3.3. SWOT Analysis
- 18.2.3.4. Recent Developments
- 18.2.3.5. Financials (Based on Availability)
- 18.2.4 Nanoplus Nanosystems and Technologies GmbH
- 18.2.4.1. Overview
- 18.2.4.2. Products
- 18.2.4.3. SWOT Analysis
- 18.2.4.4. Recent Developments
- 18.2.4.5. Financials (Based on Availability)
- 18.2.5 Sacher Lasertechnik Gmbh
- 18.2.5.1. Overview
- 18.2.5.2. Products
- 18.2.5.3. SWOT Analysis
- 18.2.5.4. Recent Developments
- 18.2.5.5. Financials (Based on Availability)
- 18.2.6 Leonardo Drs Inc
- 18.2.6.1. Overview
- 18.2.6.2. Products
- 18.2.6.3. SWOT Analysis
- 18.2.6.4. Recent Developments
- 18.2.6.5. Financials (Based on Availability)
- 18.2.7 Block Engineering Inc
- 18.2.7.1. Overview
- 18.2.7.2. Products
- 18.2.7.3. SWOT Analysis
- 18.2.7.4. Recent Developments
- 18.2.7.5. Financials (Based on Availability)
- 18.2.8 Mirsense SAS
- 18.2.8.1. Overview
- 18.2.8.2. Products
- 18.2.8.3. SWOT Analysis
- 18.2.8.4. Recent Developments
- 18.2.8.5. Financials (Based on Availability)
- 18.2.9 Thorlabs Inc
- 18.2.9.1. Overview
- 18.2.9.2. Products
- 18.2.9.3. SWOT Analysis
- 18.2.9.4. Recent Developments
- 18.2.9.5. Financials (Based on Availability)
- 18.2.10 Adtech Optics Inc
- 18.2.10.1. Overview
- 18.2.10.2. Products
- 18.2.10.3. SWOT Analysis
- 18.2.10.4. Recent Developments
- 18.2.10.5. Financials (Based on Availability)
- 18.2.1 Alpes Lasers SA
List of Figures
- Figure 1: Global Quantum Cascade Lasers Industry Revenue Breakdown (Million, %) by Region 2024 & 2032
- Figure 2: North America Quantum Cascade Lasers Industry Revenue (Million), by Country 2024 & 2032
- Figure 3: North America Quantum Cascade Lasers Industry Revenue Share (%), by Country 2024 & 2032
- Figure 4: Europe Quantum Cascade Lasers Industry Revenue (Million), by Country 2024 & 2032
- Figure 5: Europe Quantum Cascade Lasers Industry Revenue Share (%), by Country 2024 & 2032
- Figure 6: Asia Pacific Quantum Cascade Lasers Industry Revenue (Million), by Country 2024 & 2032
- Figure 7: Asia Pacific Quantum Cascade Lasers Industry Revenue Share (%), by Country 2024 & 2032
- Figure 8: South America Quantum Cascade Lasers Industry Revenue (Million), by Country 2024 & 2032
- Figure 9: South America Quantum Cascade Lasers Industry Revenue Share (%), by Country 2024 & 2032
- Figure 10: North America Quantum Cascade Lasers Industry Revenue (Million), by Country 2024 & 2032
- Figure 11: North America Quantum Cascade Lasers Industry Revenue Share (%), by Country 2024 & 2032
- Figure 12: MEA Quantum Cascade Lasers Industry Revenue (Million), by Country 2024 & 2032
- Figure 13: MEA Quantum Cascade Lasers Industry Revenue Share (%), by Country 2024 & 2032
- Figure 14: North America Quantum Cascade Lasers Industry Revenue (Million), by Type 2024 & 2032
- Figure 15: North America Quantum Cascade Lasers Industry Revenue Share (%), by Type 2024 & 2032
- Figure 16: North America Quantum Cascade Lasers Industry Revenue (Million), by Operation 2024 & 2032
- Figure 17: North America Quantum Cascade Lasers Industry Revenue Share (%), by Operation 2024 & 2032
- Figure 18: North America Quantum Cascade Lasers Industry Revenue (Million), by End-user Industry 2024 & 2032
- Figure 19: North America Quantum Cascade Lasers Industry Revenue Share (%), by End-user Industry 2024 & 2032
- Figure 20: North America Quantum Cascade Lasers Industry Revenue (Million), by Country 2024 & 2032
- Figure 21: North America Quantum Cascade Lasers Industry Revenue Share (%), by Country 2024 & 2032
- Figure 22: Europe Quantum Cascade Lasers Industry Revenue (Million), by Type 2024 & 2032
- Figure 23: Europe Quantum Cascade Lasers Industry Revenue Share (%), by Type 2024 & 2032
- Figure 24: Europe Quantum Cascade Lasers Industry Revenue (Million), by Operation 2024 & 2032
- Figure 25: Europe Quantum Cascade Lasers Industry Revenue Share (%), by Operation 2024 & 2032
- Figure 26: Europe Quantum Cascade Lasers Industry Revenue (Million), by End-user Industry 2024 & 2032
- Figure 27: Europe Quantum Cascade Lasers Industry Revenue Share (%), by End-user Industry 2024 & 2032
- Figure 28: Europe Quantum Cascade Lasers Industry Revenue (Million), by Country 2024 & 2032
- Figure 29: Europe Quantum Cascade Lasers Industry Revenue Share (%), by Country 2024 & 2032
- Figure 30: Asia Quantum Cascade Lasers Industry Revenue (Million), by Type 2024 & 2032
- Figure 31: Asia Quantum Cascade Lasers Industry Revenue Share (%), by Type 2024 & 2032
- Figure 32: Asia Quantum Cascade Lasers Industry Revenue (Million), by Operation 2024 & 2032
- Figure 33: Asia Quantum Cascade Lasers Industry Revenue Share (%), by Operation 2024 & 2032
- Figure 34: Asia Quantum Cascade Lasers Industry Revenue (Million), by End-user Industry 2024 & 2032
- Figure 35: Asia Quantum Cascade Lasers Industry Revenue Share (%), by End-user Industry 2024 & 2032
- Figure 36: Asia Quantum Cascade Lasers Industry Revenue (Million), by Country 2024 & 2032
- Figure 37: Asia Quantum Cascade Lasers Industry Revenue Share (%), by Country 2024 & 2032
- Figure 38: Australia and New Zealand Quantum Cascade Lasers Industry Revenue (Million), by Type 2024 & 2032
- Figure 39: Australia and New Zealand Quantum Cascade Lasers Industry Revenue Share (%), by Type 2024 & 2032
- Figure 40: Australia and New Zealand Quantum Cascade Lasers Industry Revenue (Million), by Operation 2024 & 2032
- Figure 41: Australia and New Zealand Quantum Cascade Lasers Industry Revenue Share (%), by Operation 2024 & 2032
- Figure 42: Australia and New Zealand Quantum Cascade Lasers Industry Revenue (Million), by End-user Industry 2024 & 2032
- Figure 43: Australia and New Zealand Quantum Cascade Lasers Industry Revenue Share (%), by End-user Industry 2024 & 2032
- Figure 44: Australia and New Zealand Quantum Cascade Lasers Industry Revenue (Million), by Country 2024 & 2032
- Figure 45: Australia and New Zealand Quantum Cascade Lasers Industry Revenue Share (%), by Country 2024 & 2032
- Figure 46: Latin America Quantum Cascade Lasers Industry Revenue (Million), by Type 2024 & 2032
- Figure 47: Latin America Quantum Cascade Lasers Industry Revenue Share (%), by Type 2024 & 2032
- Figure 48: Latin America Quantum Cascade Lasers Industry Revenue (Million), by Operation 2024 & 2032
- Figure 49: Latin America Quantum Cascade Lasers Industry Revenue Share (%), by Operation 2024 & 2032
- Figure 50: Latin America Quantum Cascade Lasers Industry Revenue (Million), by End-user Industry 2024 & 2032
- Figure 51: Latin America Quantum Cascade Lasers Industry Revenue Share (%), by End-user Industry 2024 & 2032
- Figure 52: Latin America Quantum Cascade Lasers Industry Revenue (Million), by Country 2024 & 2032
- Figure 53: Latin America Quantum Cascade Lasers Industry Revenue Share (%), by Country 2024 & 2032
- Figure 54: Middle East and Africa Quantum Cascade Lasers Industry Revenue (Million), by Type 2024 & 2032
- Figure 55: Middle East and Africa Quantum Cascade Lasers Industry Revenue Share (%), by Type 2024 & 2032
- Figure 56: Middle East and Africa Quantum Cascade Lasers Industry Revenue (Million), by Operation 2024 & 2032
- Figure 57: Middle East and Africa Quantum Cascade Lasers Industry Revenue Share (%), by Operation 2024 & 2032
- Figure 58: Middle East and Africa Quantum Cascade Lasers Industry Revenue (Million), by End-user Industry 2024 & 2032
- Figure 59: Middle East and Africa Quantum Cascade Lasers Industry Revenue Share (%), by End-user Industry 2024 & 2032
- Figure 60: Middle East and Africa Quantum Cascade Lasers Industry Revenue (Million), by Country 2024 & 2032
- Figure 61: Middle East and Africa Quantum Cascade Lasers Industry Revenue Share (%), by Country 2024 & 2032
List of Tables
- Table 1: Global Quantum Cascade Lasers Industry Revenue Million Forecast, by Region 2019 & 2032
- Table 2: Global Quantum Cascade Lasers Industry Revenue Million Forecast, by Type 2019 & 2032
- Table 3: Global Quantum Cascade Lasers Industry Revenue Million Forecast, by Operation 2019 & 2032
- Table 4: Global Quantum Cascade Lasers Industry Revenue Million Forecast, by End-user Industry 2019 & 2032
- Table 5: Global Quantum Cascade Lasers Industry Revenue Million Forecast, by Region 2019 & 2032
- Table 6: Global Quantum Cascade Lasers Industry Revenue Million Forecast, by Country 2019 & 2032
- Table 7: United States Quantum Cascade Lasers Industry Revenue (Million) Forecast, by Application 2019 & 2032
- Table 8: Canada Quantum Cascade Lasers Industry Revenue (Million) Forecast, by Application 2019 & 2032
- Table 9: Mexico Quantum Cascade Lasers Industry Revenue (Million) Forecast, by Application 2019 & 2032
- Table 10: Global Quantum Cascade Lasers Industry Revenue Million Forecast, by Country 2019 & 2032
- Table 11: Germany Quantum Cascade Lasers Industry Revenue (Million) Forecast, by Application 2019 & 2032
- Table 12: United Kingdom Quantum Cascade Lasers Industry Revenue (Million) Forecast, by Application 2019 & 2032
- Table 13: France Quantum Cascade Lasers Industry Revenue (Million) Forecast, by Application 2019 & 2032
- Table 14: Spain Quantum Cascade Lasers Industry Revenue (Million) Forecast, by Application 2019 & 2032
- Table 15: Italy Quantum Cascade Lasers Industry Revenue (Million) Forecast, by Application 2019 & 2032
- Table 16: Spain Quantum Cascade Lasers Industry Revenue (Million) Forecast, by Application 2019 & 2032
- Table 17: Belgium Quantum Cascade Lasers Industry Revenue (Million) Forecast, by Application 2019 & 2032
- Table 18: Netherland Quantum Cascade Lasers Industry Revenue (Million) Forecast, by Application 2019 & 2032
- Table 19: Nordics Quantum Cascade Lasers Industry Revenue (Million) Forecast, by Application 2019 & 2032
- Table 20: Rest of Europe Quantum Cascade Lasers Industry Revenue (Million) Forecast, by Application 2019 & 2032
- Table 21: Global Quantum Cascade Lasers Industry Revenue Million Forecast, by Country 2019 & 2032
- Table 22: China Quantum Cascade Lasers Industry Revenue (Million) Forecast, by Application 2019 & 2032
- Table 23: Japan Quantum Cascade Lasers Industry Revenue (Million) Forecast, by Application 2019 & 2032
- Table 24: India Quantum Cascade Lasers Industry Revenue (Million) Forecast, by Application 2019 & 2032
- Table 25: South Korea Quantum Cascade Lasers Industry Revenue (Million) Forecast, by Application 2019 & 2032
- Table 26: Southeast Asia Quantum Cascade Lasers Industry Revenue (Million) Forecast, by Application 2019 & 2032
- Table 27: Australia Quantum Cascade Lasers Industry Revenue (Million) Forecast, by Application 2019 & 2032
- Table 28: Indonesia Quantum Cascade Lasers Industry Revenue (Million) Forecast, by Application 2019 & 2032
- Table 29: Phillipes Quantum Cascade Lasers Industry Revenue (Million) Forecast, by Application 2019 & 2032
- Table 30: Singapore Quantum Cascade Lasers Industry Revenue (Million) Forecast, by Application 2019 & 2032
- Table 31: Thailandc Quantum Cascade Lasers Industry Revenue (Million) Forecast, by Application 2019 & 2032
- Table 32: Rest of Asia Pacific Quantum Cascade Lasers Industry Revenue (Million) Forecast, by Application 2019 & 2032
- Table 33: Global Quantum Cascade Lasers Industry Revenue Million Forecast, by Country 2019 & 2032
- Table 34: Brazil Quantum Cascade Lasers Industry Revenue (Million) Forecast, by Application 2019 & 2032
- Table 35: Argentina Quantum Cascade Lasers Industry Revenue (Million) Forecast, by Application 2019 & 2032
- Table 36: Peru Quantum Cascade Lasers Industry Revenue (Million) Forecast, by Application 2019 & 2032
- Table 37: Chile Quantum Cascade Lasers Industry Revenue (Million) Forecast, by Application 2019 & 2032
- Table 38: Colombia Quantum Cascade Lasers Industry Revenue (Million) Forecast, by Application 2019 & 2032
- Table 39: Ecuador Quantum Cascade Lasers Industry Revenue (Million) Forecast, by Application 2019 & 2032
- Table 40: Venezuela Quantum Cascade Lasers Industry Revenue (Million) Forecast, by Application 2019 & 2032
- Table 41: Rest of South America Quantum Cascade Lasers Industry Revenue (Million) Forecast, by Application 2019 & 2032
- Table 42: Global Quantum Cascade Lasers Industry Revenue Million Forecast, by Country 2019 & 2032
- Table 43: United States Quantum Cascade Lasers Industry Revenue (Million) Forecast, by Application 2019 & 2032
- Table 44: Canada Quantum Cascade Lasers Industry Revenue (Million) Forecast, by Application 2019 & 2032
- Table 45: Mexico Quantum Cascade Lasers Industry Revenue (Million) Forecast, by Application 2019 & 2032
- Table 46: Global Quantum Cascade Lasers Industry Revenue Million Forecast, by Country 2019 & 2032
- Table 47: United Arab Emirates Quantum Cascade Lasers Industry Revenue (Million) Forecast, by Application 2019 & 2032
- Table 48: Saudi Arabia Quantum Cascade Lasers Industry Revenue (Million) Forecast, by Application 2019 & 2032
- Table 49: South Africa Quantum Cascade Lasers Industry Revenue (Million) Forecast, by Application 2019 & 2032
- Table 50: Rest of Middle East and Africa Quantum Cascade Lasers Industry Revenue (Million) Forecast, by Application 2019 & 2032
- Table 51: Global Quantum Cascade Lasers Industry Revenue Million Forecast, by Type 2019 & 2032
- Table 52: Global Quantum Cascade Lasers Industry Revenue Million Forecast, by Operation 2019 & 2032
- Table 53: Global Quantum Cascade Lasers Industry Revenue Million Forecast, by End-user Industry 2019 & 2032
- Table 54: Global Quantum Cascade Lasers Industry Revenue Million Forecast, by Country 2019 & 2032
- Table 55: United States Quantum Cascade Lasers Industry Revenue (Million) Forecast, by Application 2019 & 2032
- Table 56: Canada Quantum Cascade Lasers Industry Revenue (Million) Forecast, by Application 2019 & 2032
- Table 57: Global Quantum Cascade Lasers Industry Revenue Million Forecast, by Type 2019 & 2032
- Table 58: Global Quantum Cascade Lasers Industry Revenue Million Forecast, by Operation 2019 & 2032
- Table 59: Global Quantum Cascade Lasers Industry Revenue Million Forecast, by End-user Industry 2019 & 2032
- Table 60: Global Quantum Cascade Lasers Industry Revenue Million Forecast, by Country 2019 & 2032
- Table 61: United Kingdom Quantum Cascade Lasers Industry Revenue (Million) Forecast, by Application 2019 & 2032
- Table 62: Germany Quantum Cascade Lasers Industry Revenue (Million) Forecast, by Application 2019 & 2032
- Table 63: France Quantum Cascade Lasers Industry Revenue (Million) Forecast, by Application 2019 & 2032
- Table 64: Global Quantum Cascade Lasers Industry Revenue Million Forecast, by Type 2019 & 2032
- Table 65: Global Quantum Cascade Lasers Industry Revenue Million Forecast, by Operation 2019 & 2032
- Table 66: Global Quantum Cascade Lasers Industry Revenue Million Forecast, by End-user Industry 2019 & 2032
- Table 67: Global Quantum Cascade Lasers Industry Revenue Million Forecast, by Country 2019 & 2032
- Table 68: China Quantum Cascade Lasers Industry Revenue (Million) Forecast, by Application 2019 & 2032
- Table 69: Japan Quantum Cascade Lasers Industry Revenue (Million) Forecast, by Application 2019 & 2032
- Table 70: South Korea Quantum Cascade Lasers Industry Revenue (Million) Forecast, by Application 2019 & 2032
- Table 71: India Quantum Cascade Lasers Industry Revenue (Million) Forecast, by Application 2019 & 2032
- Table 72: Global Quantum Cascade Lasers Industry Revenue Million Forecast, by Type 2019 & 2032
- Table 73: Global Quantum Cascade Lasers Industry Revenue Million Forecast, by Operation 2019 & 2032
- Table 74: Global Quantum Cascade Lasers Industry Revenue Million Forecast, by End-user Industry 2019 & 2032
- Table 75: Global Quantum Cascade Lasers Industry Revenue Million Forecast, by Country 2019 & 2032
- Table 76: Global Quantum Cascade Lasers Industry Revenue Million Forecast, by Type 2019 & 2032
- Table 77: Global Quantum Cascade Lasers Industry Revenue Million Forecast, by Operation 2019 & 2032
- Table 78: Global Quantum Cascade Lasers Industry Revenue Million Forecast, by End-user Industry 2019 & 2032
- Table 79: Global Quantum Cascade Lasers Industry Revenue Million Forecast, by Country 2019 & 2032
- Table 80: Global Quantum Cascade Lasers Industry Revenue Million Forecast, by Type 2019 & 2032
- Table 81: Global Quantum Cascade Lasers Industry Revenue Million Forecast, by Operation 2019 & 2032
- Table 82: Global Quantum Cascade Lasers Industry Revenue Million Forecast, by End-user Industry 2019 & 2032
- Table 83: Global Quantum Cascade Lasers Industry Revenue Million Forecast, by Country 2019 & 2032
Frequently Asked Questions
1. What is the projected Compound Annual Growth Rate (CAGR) of the Quantum Cascade Lasers Industry?
The projected CAGR is approximately 4.40%.
2. Which companies are prominent players in the Quantum Cascade Lasers Industry?
Key companies in the market include Alpes Lasers SA, Inphenix Inc, Hamamatsu Photonics KK, Nanoplus Nanosystems and Technologies GmbH, Sacher Lasertechnik Gmbh, Leonardo Drs Inc, Block Engineering Inc, Mirsense SAS, Thorlabs Inc, Adtech Optics Inc.
3. What are the main segments of the Quantum Cascade Lasers Industry?
The market segments include Type, Operation, End-user Industry.
4. Can you provide details about the market size?
The market size is estimated to be USD 415.36 Million as of 2022.
5. What are some drivers contributing to market growth?
Growing Need For Precision in the Medical Activities; Increased Demand of Gas Sensing and Chemical Detection Applications in the Military and Defense.
6. What are the notable trends driving market growth?
Industrial End-User Industry to Hold Significant Market Share.
7. Are there any restraints impacting market growth?
Cost and Absence of Standardization of pH Sensor Devices.
8. Can you provide examples of recent developments in the market?
March 2024 - The members of the French quantum ecosystem reviewed the results of the national quantum strategy three years after its launch by President Emmanuel Macron. They also announced the launch of PROQCIMA, which aims to have two prototypes of universal quantum computers of French design by 2030. The plan is structured around strategic objectives that include the development of quantum computing, quantum sensing, quantum cryptography, and quantum communication strategies. Such initiatives may create a demand for QCL technology in the forecasted period.
9. What pricing options are available for accessing the report?
Pricing options include single-user, multi-user, and enterprise licenses priced at USD 4750, USD 5250, and USD 8750 respectively.
10. Is the market size provided in terms of value or volume?
The market size is provided in terms of value, measured in Million.
11. Are there any specific market keywords associated with the report?
Yes, the market keyword associated with the report is "Quantum Cascade Lasers Industry," which aids in identifying and referencing the specific market segment covered.
12. How do I determine which pricing option suits my needs best?
The pricing options vary based on user requirements and access needs. Individual users may opt for single-user licenses, while businesses requiring broader access may choose multi-user or enterprise licenses for cost-effective access to the report.
13. Are there any additional resources or data provided in the Quantum Cascade Lasers Industry report?
While the report offers comprehensive insights, it's advisable to review the specific contents or supplementary materials provided to ascertain if additional resources or data are available.
14. How can I stay updated on further developments or reports in the Quantum Cascade Lasers Industry?
To stay informed about further developments, trends, and reports in the Quantum Cascade Lasers Industry, consider subscribing to industry newsletters, following relevant companies and organizations, or regularly checking reputable industry news sources and publications.
Methodology
Step 1 - Identification of Relevant Samples Size from Population Database


Step 2 - Approaches for Defining Global Market Size (Value, Volume* & Price*)

Note*: In applicable scenarios
Step 3 - Data Sources
Primary Research
- Web Analytics
- Survey Reports
- Research Institute
- Latest Research Reports
- Opinion Leaders
Secondary Research
- Annual Reports
- White Paper
- Latest Press Release
- Industry Association
- Paid Database
- Investor Presentations

Step 4 - Data Triangulation
Involves using different sources of information in order to increase the validity of a study
These sources are likely to be stakeholders in a program - participants, other researchers, program staff, other community members, and so on.
Then we put all data in single framework & apply various statistical tools to find out the dynamic on the market.
During the analysis stage, feedback from the stakeholder groups would be compared to determine areas of agreement as well as areas of divergence


