
Key Insights
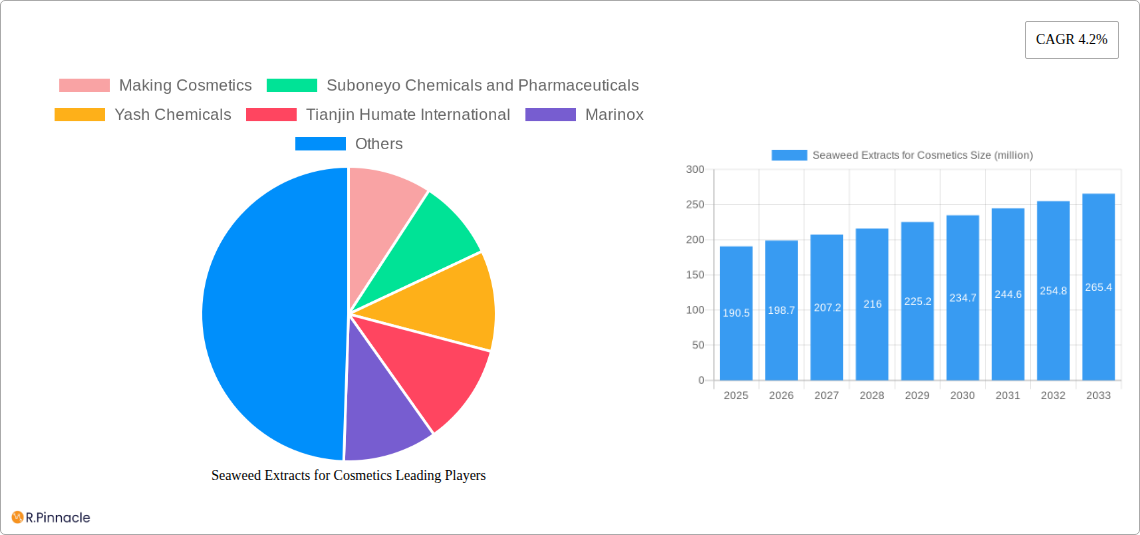
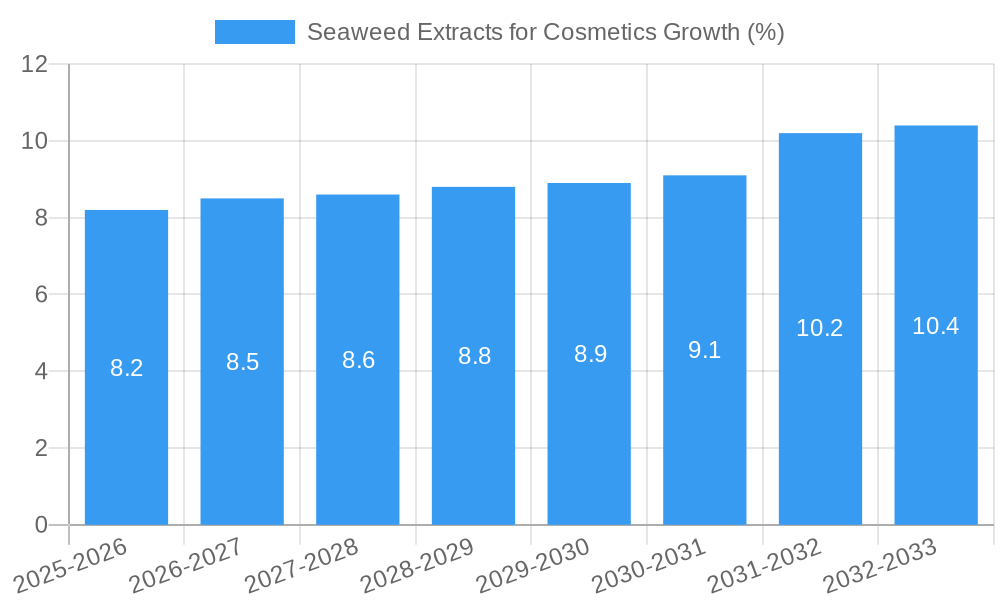
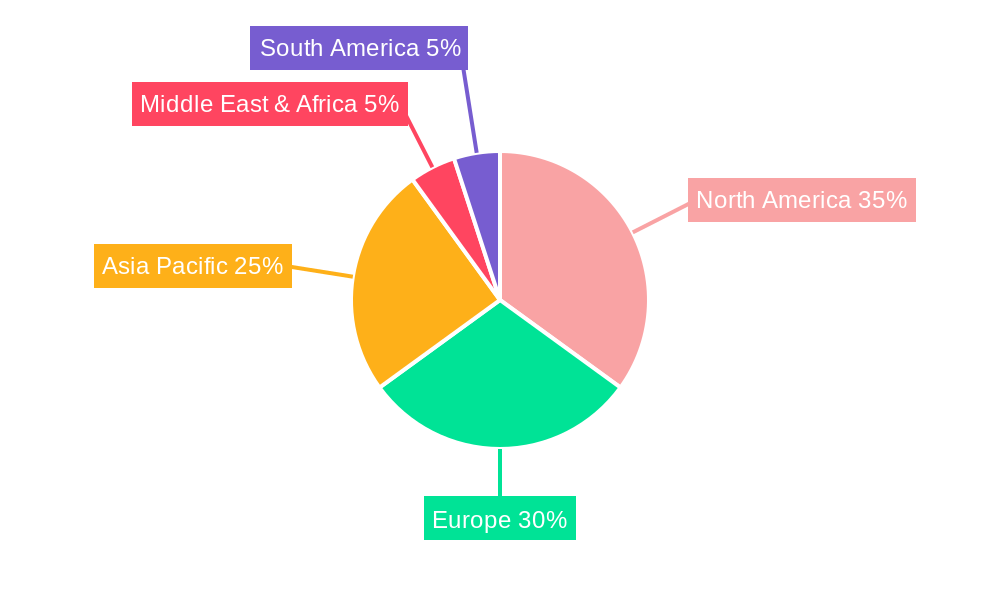
The global seaweed extracts for cosmetics market is poised for significant growth, projected to reach $190.5 million in 2025 and exhibiting a Compound Annual Growth Rate (CAGR) of 4.2% from 2025 to 2033. This expansion is driven by the increasing consumer demand for natural and sustainable beauty products. The rising awareness of the benefits of seaweed extracts, including their moisturizing, anti-aging, and skin-soothing properties, fuels this market growth. Furthermore, the versatility of seaweed extracts, suitable for both face and body applications in various forms like powders and liquids, contributes to its widespread adoption across diverse cosmetic formulations. The market is segmented by application (face and body), type (powder, liquid, and others), and region, allowing for targeted market penetration strategies. Key players like DuPont, MarinoX, and others are actively involved in research and development, leading to innovative product formulations and expanding market reach. Competitive landscape analysis reveals a blend of established players and emerging companies, indicating a dynamic and evolving market. The geographical distribution reveals robust growth across North America and Europe, driven by high consumer awareness and spending on premium skincare. However, Asia Pacific is projected to experience significant growth due to increasing disposable income and burgeoning demand for natural cosmetics in rapidly developing economies like China and India. The market faces some challenges such as price volatility of raw materials and the need for standardization of seaweed extract quality.
The continued growth of the market hinges on several factors. Sustained consumer interest in natural and organic cosmetics will remain a key driver. Furthermore, advancements in extraction technologies leading to higher quality and more cost-effective seaweed extracts will stimulate further market expansion. Industry collaborations focusing on research and development of innovative applications for seaweed extracts will also contribute to market growth. Effective marketing and communication strategies highlighting the benefits and sustainability aspects of seaweed-based cosmetics will be critical for capturing market share. Regulatory frameworks supporting the use of seaweed extracts in cosmetics will also play an important role in shaping the market's trajectory in the years to come. Therefore, a positive outlook for the seaweed extracts for cosmetics market is projected throughout the forecast period, fueled by a potent combination of consumer preference, technological advancements, and strategic industry initiatives.
Seaweed Extracts for Cosmetics Market Report: 2019-2033
This comprehensive report provides a detailed analysis of the global seaweed extracts for cosmetics market, offering invaluable insights for industry professionals, investors, and stakeholders. The study period covers 2019-2033, with 2025 serving as the base and estimated year. The report meticulously examines market dynamics, segmentation, leading players, and future growth potential, leveraging extensive data and expert analysis. Projected market value surpasses several million USD by 2033.
Seaweed Extracts for Cosmetics Market Structure & Innovation Trends
This section analyzes the competitive landscape, highlighting market concentration, innovation drivers, and regulatory influences shaping the seaweed extracts for cosmetics market. We delve into mergers and acquisitions (M&A) activity, assessing their impact on market share and consolidation. The report examines the substitution potential of synthetic alternatives and explores end-user demographics impacting demand.
Market Concentration: The market exhibits a moderately concentrated structure, with key players such as DuPont, Suboneyo Chemicals and Pharmaceuticals, and Yash Chemicals holding significant market shares (xx%). Smaller players, including AlgAran Seaweed Products and Aromantic, contribute to the market's vibrancy.
Innovation Drivers: Research into novel extraction methods and the development of seaweed-based actives with enhanced efficacy drive innovation. Sustainability concerns and growing consumer demand for natural cosmetics further fuel innovation.
Regulatory Framework: Stringent regulations concerning cosmetic ingredient safety and sustainability influence product development and market entry. Compliance with international standards (e.g., ISO) is crucial.
M&A Activity: The past five years have witnessed xx M&A deals in the seaweed extracts for cosmetics market, with a total transaction value of approximately xx million USD. These activities have reshaped market dynamics and increased industry consolidation.
Seaweed Extracts for Cosmetics Market Dynamics & Trends
This section provides a detailed examination of the market’s growth trajectory, analyzing key drivers, technological disruptions, consumer preferences, and competitive dynamics. We project a Compound Annual Growth Rate (CAGR) of xx% during the forecast period (2025-2033), driven by factors such as increasing consumer awareness of natural and sustainable beauty products. Market penetration of seaweed extracts in cosmetic formulations is expected to reach xx% by 2033.
The rising popularity of vegan and cruelty-free cosmetics significantly boosts market growth. Technological advancements in extraction processes leading to higher yields of bioactive compounds, coupled with the development of novel delivery systems, further enhance market expansion. The competitive landscape is characterized by both established players and emerging companies vying for market share. Price competitiveness and innovation in product formulation play critical roles.
Dominant Regions & Segments in Seaweed Extracts for Cosmetics
This section identifies the leading regions and segments within the seaweed extracts for cosmetics market. Analysis considers application (face, body), type (powder, liquid, others), and geographical distribution.
Dominant Regions: Asia-Pacific, specifically countries like China, Japan, and South Korea, currently dominate the market due to factors such as a large consumer base, high demand for natural cosmetics, and established seaweed cultivation practices. Europe and North America also represent significant markets, driven by consumer preference for natural beauty products.
- Key Drivers (Asia-Pacific):
- Strong economic growth fueling disposable income.
- Well-established seaweed cultivation infrastructure.
- Favorable government policies promoting the use of natural ingredients.
Dominant Segments: The face care segment currently holds the largest market share, followed by the body care segment. Liquid seaweed extracts currently dominate the market owing to their ease of incorporation into formulations.
Seaweed Extracts for Cosmetics Product Innovations
Recent innovations focus on developing seaweed extracts with enhanced efficacy and targeted functionalities, such as anti-aging, moisturizing, and brightening properties. Formulations incorporating diverse seaweed species and extraction methods are gaining popularity. Nanotechnology-enabled delivery systems and sustainable extraction processes contribute to competitive advantages. The development of standardized extracts with guaranteed bioactive content strengthens market credibility.
Report Scope & Segmentation Analysis
This report segments the seaweed extracts for cosmetics market based on application (Face, Body) and type (Powder, Liquid, Others). Each segment is analyzed individually, providing growth projections, market size estimations, and competitive dynamics. The Face segment exhibits a higher CAGR compared to Body due to the higher demand for facial skincare products. The Liquid segment dominates due to ease of use in formulations, while the Powder segment offers niche opportunities. The "Others" category represents novel delivery systems and specialized extracts.
Key Drivers of Seaweed Extracts for Cosmetics Growth
The growing consumer preference for natural and sustainable beauty products is a primary growth driver. Increasing awareness of the health benefits of seaweed extracts, along with supportive regulatory frameworks promoting natural ingredients, further fuel market expansion. Technological advancements in extraction techniques resulting in higher yields and improved quality also contribute significantly.
Challenges in the Seaweed Extracts for Cosmetics Sector
Challenges include supply chain management complexities, ensuring consistent quality and standardization of extracts, and navigating stringent regulatory requirements. Price fluctuations of raw materials and competition from synthetic alternatives also impact profitability. The sustainability of seaweed sourcing and its environmental impact are important concerns.
Emerging Opportunities in Seaweed Extracts for Cosmetics
Emerging opportunities include the expansion into new geographical markets, particularly in developing economies. Developing novel applications for seaweed extracts in specialized cosmetic products (e.g., sunscreens, hair care) presents further growth opportunities. The integration of seaweed extracts into personalized skincare solutions aligns with current consumer trends.
Leading Players in the Seaweed Extracts for Cosmetics Market
- Suboneyo Chemicals and Pharmaceuticals
- Yash Chemicals
- Tianjin Humate International
- Marinox
- AlgAran Seaweed Products
- Aromantic
- DuPont
- Shemberg
- Quingdao Nanshan Seaweed
- Ceamsa
- Greenfresh
- Making Cosmetics
Key Developments in Seaweed Extracts for Cosmetics Industry
- 2022-Q4: DuPont launched a new line of seaweed-based cosmetic ingredients.
- 2023-Q1: AlgAran Seaweed Products announced a strategic partnership for expanded distribution.
- 2023-Q2: Suboneyo Chemicals and Pharmaceuticals invested in a new extraction facility.
- 2024-Q1: Aromatic secured a major contract with a leading cosmetics company. (Further developments will be updated in future report iterations.)
Future Outlook for Seaweed Extracts for Cosmetics Market
The global seaweed extracts for cosmetics market is poised for robust growth, driven by increasing consumer demand for natural and sustainable products. The market's future success hinges on continuous innovation, sustainable sourcing, and navigating regulatory landscapes effectively. Companies focusing on product differentiation, efficient supply chains, and strategic partnerships are well-positioned to capitalize on emerging opportunities.
Seaweed Extracts for Cosmetics Segmentation
-
1. Application
- 1.1. Face
- 1.2. Body
-
2. Types
- 2.1. Powder
- 2.2. Liquid
- 2.3. Others
Seaweed Extracts for Cosmetics Segmentation By Geography
-
1. North America
- 1.1. United States
- 1.2. Canada
- 1.3. Mexico
-
2. South America
- 2.1. Brazil
- 2.2. Argentina
- 2.3. Rest of South America
-
3. Europe
- 3.1. United Kingdom
- 3.2. Germany
- 3.3. France
- 3.4. Italy
- 3.5. Spain
- 3.6. Russia
- 3.7. Benelux
- 3.8. Nordics
- 3.9. Rest of Europe
-
4. Middle East & Africa
- 4.1. Turkey
- 4.2. Israel
- 4.3. GCC
- 4.4. North Africa
- 4.5. South Africa
- 4.6. Rest of Middle East & Africa
-
5. Asia Pacific
- 5.1. China
- 5.2. India
- 5.3. Japan
- 5.4. South Korea
- 5.5. ASEAN
- 5.6. Oceania
- 5.7. Rest of Asia Pacific
Seaweed Extracts for Cosmetics REPORT HIGHLIGHTS
| Aspects | Details |
|---|---|
| Study Period | 2019-2033 |
| Base Year | 2024 |
| Estimated Year | 2025 |
| Forecast Period | 2025-2033 |
| Historical Period | 2019-2024 |
| Growth Rate | CAGR of 4.2% from 2019-2033 |
| Segmentation |
|
Table of Contents
- 1. Introduction
- 1.1. Research Scope
- 1.2. Market Segmentation
- 1.3. Research Methodology
- 1.4. Definitions and Assumptions
- 2. Executive Summary
- 2.1. Introduction
- 3. Market Dynamics
- 3.1. Introduction
- 3.2. Market Drivers
- 3.3. Market Restrains
- 3.4. Market Trends
- 4. Market Factor Analysis
- 4.1. Porters Five Forces
- 4.2. Supply/Value Chain
- 4.3. PESTEL analysis
- 4.4. Market Entropy
- 4.5. Patent/Trademark Analysis
- 5. Global Seaweed Extracts for Cosmetics Analysis, Insights and Forecast, 2019-2031
- 5.1. Market Analysis, Insights and Forecast - by Application
- 5.1.1. Face
- 5.1.2. Body
- 5.2. Market Analysis, Insights and Forecast - by Types
- 5.2.1. Powder
- 5.2.2. Liquid
- 5.2.3. Others
- 5.3. Market Analysis, Insights and Forecast - by Region
- 5.3.1. North America
- 5.3.2. South America
- 5.3.3. Europe
- 5.3.4. Middle East & Africa
- 5.3.5. Asia Pacific
- 5.1. Market Analysis, Insights and Forecast - by Application
- 6. North America Seaweed Extracts for Cosmetics Analysis, Insights and Forecast, 2019-2031
- 6.1. Market Analysis, Insights and Forecast - by Application
- 6.1.1. Face
- 6.1.2. Body
- 6.2. Market Analysis, Insights and Forecast - by Types
- 6.2.1. Powder
- 6.2.2. Liquid
- 6.2.3. Others
- 6.1. Market Analysis, Insights and Forecast - by Application
- 7. South America Seaweed Extracts for Cosmetics Analysis, Insights and Forecast, 2019-2031
- 7.1. Market Analysis, Insights and Forecast - by Application
- 7.1.1. Face
- 7.1.2. Body
- 7.2. Market Analysis, Insights and Forecast - by Types
- 7.2.1. Powder
- 7.2.2. Liquid
- 7.2.3. Others
- 7.1. Market Analysis, Insights and Forecast - by Application
- 8. Europe Seaweed Extracts for Cosmetics Analysis, Insights and Forecast, 2019-2031
- 8.1. Market Analysis, Insights and Forecast - by Application
- 8.1.1. Face
- 8.1.2. Body
- 8.2. Market Analysis, Insights and Forecast - by Types
- 8.2.1. Powder
- 8.2.2. Liquid
- 8.2.3. Others
- 8.1. Market Analysis, Insights and Forecast - by Application
- 9. Middle East & Africa Seaweed Extracts for Cosmetics Analysis, Insights and Forecast, 2019-2031
- 9.1. Market Analysis, Insights and Forecast - by Application
- 9.1.1. Face
- 9.1.2. Body
- 9.2. Market Analysis, Insights and Forecast - by Types
- 9.2.1. Powder
- 9.2.2. Liquid
- 9.2.3. Others
- 9.1. Market Analysis, Insights and Forecast - by Application
- 10. Asia Pacific Seaweed Extracts for Cosmetics Analysis, Insights and Forecast, 2019-2031
- 10.1. Market Analysis, Insights and Forecast - by Application
- 10.1.1. Face
- 10.1.2. Body
- 10.2. Market Analysis, Insights and Forecast - by Types
- 10.2.1. Powder
- 10.2.2. Liquid
- 10.2.3. Others
- 10.1. Market Analysis, Insights and Forecast - by Application
- 11. Competitive Analysis
- 11.1. Global Market Share Analysis 2024
- 11.2. Company Profiles
- 11.2.1 Making Cosmetics
- 11.2.1.1. Overview
- 11.2.1.2. Products
- 11.2.1.3. SWOT Analysis
- 11.2.1.4. Recent Developments
- 11.2.1.5. Financials (Based on Availability)
- 11.2.2 Suboneyo Chemicals and Pharmaceuticals
- 11.2.2.1. Overview
- 11.2.2.2. Products
- 11.2.2.3. SWOT Analysis
- 11.2.2.4. Recent Developments
- 11.2.2.5. Financials (Based on Availability)
- 11.2.3 Yash Chemicals
- 11.2.3.1. Overview
- 11.2.3.2. Products
- 11.2.3.3. SWOT Analysis
- 11.2.3.4. Recent Developments
- 11.2.3.5. Financials (Based on Availability)
- 11.2.4 Tianjin Humate International
- 11.2.4.1. Overview
- 11.2.4.2. Products
- 11.2.4.3. SWOT Analysis
- 11.2.4.4. Recent Developments
- 11.2.4.5. Financials (Based on Availability)
- 11.2.5 Marinox
- 11.2.5.1. Overview
- 11.2.5.2. Products
- 11.2.5.3. SWOT Analysis
- 11.2.5.4. Recent Developments
- 11.2.5.5. Financials (Based on Availability)
- 11.2.6 AlgAran Seaweed Products
- 11.2.6.1. Overview
- 11.2.6.2. Products
- 11.2.6.3. SWOT Analysis
- 11.2.6.4. Recent Developments
- 11.2.6.5. Financials (Based on Availability)
- 11.2.7 Aromantic
- 11.2.7.1. Overview
- 11.2.7.2. Products
- 11.2.7.3. SWOT Analysis
- 11.2.7.4. Recent Developments
- 11.2.7.5. Financials (Based on Availability)
- 11.2.8 DuPont
- 11.2.8.1. Overview
- 11.2.8.2. Products
- 11.2.8.3. SWOT Analysis
- 11.2.8.4. Recent Developments
- 11.2.8.5. Financials (Based on Availability)
- 11.2.9 Shemberg
- 11.2.9.1. Overview
- 11.2.9.2. Products
- 11.2.9.3. SWOT Analysis
- 11.2.9.4. Recent Developments
- 11.2.9.5. Financials (Based on Availability)
- 11.2.10 Quingdao Nanshan Seaweed
- 11.2.10.1. Overview
- 11.2.10.2. Products
- 11.2.10.3. SWOT Analysis
- 11.2.10.4. Recent Developments
- 11.2.10.5. Financials (Based on Availability)
- 11.2.11 Ceamsa
- 11.2.11.1. Overview
- 11.2.11.2. Products
- 11.2.11.3. SWOT Analysis
- 11.2.11.4. Recent Developments
- 11.2.11.5. Financials (Based on Availability)
- 11.2.12 Greenfresh
- 11.2.12.1. Overview
- 11.2.12.2. Products
- 11.2.12.3. SWOT Analysis
- 11.2.12.4. Recent Developments
- 11.2.12.5. Financials (Based on Availability)
- 11.2.1 Making Cosmetics
List of Figures
- Figure 1: Global Seaweed Extracts for Cosmetics Revenue Breakdown (million, %) by Region 2024 & 2032
- Figure 2: Global Seaweed Extracts for Cosmetics Volume Breakdown (K, %) by Region 2024 & 2032
- Figure 3: North America Seaweed Extracts for Cosmetics Revenue (million), by Application 2024 & 2032
- Figure 4: North America Seaweed Extracts for Cosmetics Volume (K), by Application 2024 & 2032
- Figure 5: North America Seaweed Extracts for Cosmetics Revenue Share (%), by Application 2024 & 2032
- Figure 6: North America Seaweed Extracts for Cosmetics Volume Share (%), by Application 2024 & 2032
- Figure 7: North America Seaweed Extracts for Cosmetics Revenue (million), by Types 2024 & 2032
- Figure 8: North America Seaweed Extracts for Cosmetics Volume (K), by Types 2024 & 2032
- Figure 9: North America Seaweed Extracts for Cosmetics Revenue Share (%), by Types 2024 & 2032
- Figure 10: North America Seaweed Extracts for Cosmetics Volume Share (%), by Types 2024 & 2032
- Figure 11: North America Seaweed Extracts for Cosmetics Revenue (million), by Country 2024 & 2032
- Figure 12: North America Seaweed Extracts for Cosmetics Volume (K), by Country 2024 & 2032
- Figure 13: North America Seaweed Extracts for Cosmetics Revenue Share (%), by Country 2024 & 2032
- Figure 14: North America Seaweed Extracts for Cosmetics Volume Share (%), by Country 2024 & 2032
- Figure 15: South America Seaweed Extracts for Cosmetics Revenue (million), by Application 2024 & 2032
- Figure 16: South America Seaweed Extracts for Cosmetics Volume (K), by Application 2024 & 2032
- Figure 17: South America Seaweed Extracts for Cosmetics Revenue Share (%), by Application 2024 & 2032
- Figure 18: South America Seaweed Extracts for Cosmetics Volume Share (%), by Application 2024 & 2032
- Figure 19: South America Seaweed Extracts for Cosmetics Revenue (million), by Types 2024 & 2032
- Figure 20: South America Seaweed Extracts for Cosmetics Volume (K), by Types 2024 & 2032
- Figure 21: South America Seaweed Extracts for Cosmetics Revenue Share (%), by Types 2024 & 2032
- Figure 22: South America Seaweed Extracts for Cosmetics Volume Share (%), by Types 2024 & 2032
- Figure 23: South America Seaweed Extracts for Cosmetics Revenue (million), by Country 2024 & 2032
- Figure 24: South America Seaweed Extracts for Cosmetics Volume (K), by Country 2024 & 2032
- Figure 25: South America Seaweed Extracts for Cosmetics Revenue Share (%), by Country 2024 & 2032
- Figure 26: South America Seaweed Extracts for Cosmetics Volume Share (%), by Country 2024 & 2032
- Figure 27: Europe Seaweed Extracts for Cosmetics Revenue (million), by Application 2024 & 2032
- Figure 28: Europe Seaweed Extracts for Cosmetics Volume (K), by Application 2024 & 2032
- Figure 29: Europe Seaweed Extracts for Cosmetics Revenue Share (%), by Application 2024 & 2032
- Figure 30: Europe Seaweed Extracts for Cosmetics Volume Share (%), by Application 2024 & 2032
- Figure 31: Europe Seaweed Extracts for Cosmetics Revenue (million), by Types 2024 & 2032
- Figure 32: Europe Seaweed Extracts for Cosmetics Volume (K), by Types 2024 & 2032
- Figure 33: Europe Seaweed Extracts for Cosmetics Revenue Share (%), by Types 2024 & 2032
- Figure 34: Europe Seaweed Extracts for Cosmetics Volume Share (%), by Types 2024 & 2032
- Figure 35: Europe Seaweed Extracts for Cosmetics Revenue (million), by Country 2024 & 2032
- Figure 36: Europe Seaweed Extracts for Cosmetics Volume (K), by Country 2024 & 2032
- Figure 37: Europe Seaweed Extracts for Cosmetics Revenue Share (%), by Country 2024 & 2032
- Figure 38: Europe Seaweed Extracts for Cosmetics Volume Share (%), by Country 2024 & 2032
- Figure 39: Middle East & Africa Seaweed Extracts for Cosmetics Revenue (million), by Application 2024 & 2032
- Figure 40: Middle East & Africa Seaweed Extracts for Cosmetics Volume (K), by Application 2024 & 2032
- Figure 41: Middle East & Africa Seaweed Extracts for Cosmetics Revenue Share (%), by Application 2024 & 2032
- Figure 42: Middle East & Africa Seaweed Extracts for Cosmetics Volume Share (%), by Application 2024 & 2032
- Figure 43: Middle East & Africa Seaweed Extracts for Cosmetics Revenue (million), by Types 2024 & 2032
- Figure 44: Middle East & Africa Seaweed Extracts for Cosmetics Volume (K), by Types 2024 & 2032
- Figure 45: Middle East & Africa Seaweed Extracts for Cosmetics Revenue Share (%), by Types 2024 & 2032
- Figure 46: Middle East & Africa Seaweed Extracts for Cosmetics Volume Share (%), by Types 2024 & 2032
- Figure 47: Middle East & Africa Seaweed Extracts for Cosmetics Revenue (million), by Country 2024 & 2032
- Figure 48: Middle East & Africa Seaweed Extracts for Cosmetics Volume (K), by Country 2024 & 2032
- Figure 49: Middle East & Africa Seaweed Extracts for Cosmetics Revenue Share (%), by Country 2024 & 2032
- Figure 50: Middle East & Africa Seaweed Extracts for Cosmetics Volume Share (%), by Country 2024 & 2032
- Figure 51: Asia Pacific Seaweed Extracts for Cosmetics Revenue (million), by Application 2024 & 2032
- Figure 52: Asia Pacific Seaweed Extracts for Cosmetics Volume (K), by Application 2024 & 2032
- Figure 53: Asia Pacific Seaweed Extracts for Cosmetics Revenue Share (%), by Application 2024 & 2032
- Figure 54: Asia Pacific Seaweed Extracts for Cosmetics Volume Share (%), by Application 2024 & 2032
- Figure 55: Asia Pacific Seaweed Extracts for Cosmetics Revenue (million), by Types 2024 & 2032
- Figure 56: Asia Pacific Seaweed Extracts for Cosmetics Volume (K), by Types 2024 & 2032
- Figure 57: Asia Pacific Seaweed Extracts for Cosmetics Revenue Share (%), by Types 2024 & 2032
- Figure 58: Asia Pacific Seaweed Extracts for Cosmetics Volume Share (%), by Types 2024 & 2032
- Figure 59: Asia Pacific Seaweed Extracts for Cosmetics Revenue (million), by Country 2024 & 2032
- Figure 60: Asia Pacific Seaweed Extracts for Cosmetics Volume (K), by Country 2024 & 2032
- Figure 61: Asia Pacific Seaweed Extracts for Cosmetics Revenue Share (%), by Country 2024 & 2032
- Figure 62: Asia Pacific Seaweed Extracts for Cosmetics Volume Share (%), by Country 2024 & 2032
List of Tables
- Table 1: Global Seaweed Extracts for Cosmetics Revenue million Forecast, by Region 2019 & 2032
- Table 2: Global Seaweed Extracts for Cosmetics Volume K Forecast, by Region 2019 & 2032
- Table 3: Global Seaweed Extracts for Cosmetics Revenue million Forecast, by Application 2019 & 2032
- Table 4: Global Seaweed Extracts for Cosmetics Volume K Forecast, by Application 2019 & 2032
- Table 5: Global Seaweed Extracts for Cosmetics Revenue million Forecast, by Types 2019 & 2032
- Table 6: Global Seaweed Extracts for Cosmetics Volume K Forecast, by Types 2019 & 2032
- Table 7: Global Seaweed Extracts for Cosmetics Revenue million Forecast, by Region 2019 & 2032
- Table 8: Global Seaweed Extracts for Cosmetics Volume K Forecast, by Region 2019 & 2032
- Table 9: Global Seaweed Extracts for Cosmetics Revenue million Forecast, by Application 2019 & 2032
- Table 10: Global Seaweed Extracts for Cosmetics Volume K Forecast, by Application 2019 & 2032
- Table 11: Global Seaweed Extracts for Cosmetics Revenue million Forecast, by Types 2019 & 2032
- Table 12: Global Seaweed Extracts for Cosmetics Volume K Forecast, by Types 2019 & 2032
- Table 13: Global Seaweed Extracts for Cosmetics Revenue million Forecast, by Country 2019 & 2032
- Table 14: Global Seaweed Extracts for Cosmetics Volume K Forecast, by Country 2019 & 2032
- Table 15: United States Seaweed Extracts for Cosmetics Revenue (million) Forecast, by Application 2019 & 2032
- Table 16: United States Seaweed Extracts for Cosmetics Volume (K) Forecast, by Application 2019 & 2032
- Table 17: Canada Seaweed Extracts for Cosmetics Revenue (million) Forecast, by Application 2019 & 2032
- Table 18: Canada Seaweed Extracts for Cosmetics Volume (K) Forecast, by Application 2019 & 2032
- Table 19: Mexico Seaweed Extracts for Cosmetics Revenue (million) Forecast, by Application 2019 & 2032
- Table 20: Mexico Seaweed Extracts for Cosmetics Volume (K) Forecast, by Application 2019 & 2032
- Table 21: Global Seaweed Extracts for Cosmetics Revenue million Forecast, by Application 2019 & 2032
- Table 22: Global Seaweed Extracts for Cosmetics Volume K Forecast, by Application 2019 & 2032
- Table 23: Global Seaweed Extracts for Cosmetics Revenue million Forecast, by Types 2019 & 2032
- Table 24: Global Seaweed Extracts for Cosmetics Volume K Forecast, by Types 2019 & 2032
- Table 25: Global Seaweed Extracts for Cosmetics Revenue million Forecast, by Country 2019 & 2032
- Table 26: Global Seaweed Extracts for Cosmetics Volume K Forecast, by Country 2019 & 2032
- Table 27: Brazil Seaweed Extracts for Cosmetics Revenue (million) Forecast, by Application 2019 & 2032
- Table 28: Brazil Seaweed Extracts for Cosmetics Volume (K) Forecast, by Application 2019 & 2032
- Table 29: Argentina Seaweed Extracts for Cosmetics Revenue (million) Forecast, by Application 2019 & 2032
- Table 30: Argentina Seaweed Extracts for Cosmetics Volume (K) Forecast, by Application 2019 & 2032
- Table 31: Rest of South America Seaweed Extracts for Cosmetics Revenue (million) Forecast, by Application 2019 & 2032
- Table 32: Rest of South America Seaweed Extracts for Cosmetics Volume (K) Forecast, by Application 2019 & 2032
- Table 33: Global Seaweed Extracts for Cosmetics Revenue million Forecast, by Application 2019 & 2032
- Table 34: Global Seaweed Extracts for Cosmetics Volume K Forecast, by Application 2019 & 2032
- Table 35: Global Seaweed Extracts for Cosmetics Revenue million Forecast, by Types 2019 & 2032
- Table 36: Global Seaweed Extracts for Cosmetics Volume K Forecast, by Types 2019 & 2032
- Table 37: Global Seaweed Extracts for Cosmetics Revenue million Forecast, by Country 2019 & 2032
- Table 38: Global Seaweed Extracts for Cosmetics Volume K Forecast, by Country 2019 & 2032
- Table 39: United Kingdom Seaweed Extracts for Cosmetics Revenue (million) Forecast, by Application 2019 & 2032
- Table 40: United Kingdom Seaweed Extracts for Cosmetics Volume (K) Forecast, by Application 2019 & 2032
- Table 41: Germany Seaweed Extracts for Cosmetics Revenue (million) Forecast, by Application 2019 & 2032
- Table 42: Germany Seaweed Extracts for Cosmetics Volume (K) Forecast, by Application 2019 & 2032
- Table 43: France Seaweed Extracts for Cosmetics Revenue (million) Forecast, by Application 2019 & 2032
- Table 44: France Seaweed Extracts for Cosmetics Volume (K) Forecast, by Application 2019 & 2032
- Table 45: Italy Seaweed Extracts for Cosmetics Revenue (million) Forecast, by Application 2019 & 2032
- Table 46: Italy Seaweed Extracts for Cosmetics Volume (K) Forecast, by Application 2019 & 2032
- Table 47: Spain Seaweed Extracts for Cosmetics Revenue (million) Forecast, by Application 2019 & 2032
- Table 48: Spain Seaweed Extracts for Cosmetics Volume (K) Forecast, by Application 2019 & 2032
- Table 49: Russia Seaweed Extracts for Cosmetics Revenue (million) Forecast, by Application 2019 & 2032
- Table 50: Russia Seaweed Extracts for Cosmetics Volume (K) Forecast, by Application 2019 & 2032
- Table 51: Benelux Seaweed Extracts for Cosmetics Revenue (million) Forecast, by Application 2019 & 2032
- Table 52: Benelux Seaweed Extracts for Cosmetics Volume (K) Forecast, by Application 2019 & 2032
- Table 53: Nordics Seaweed Extracts for Cosmetics Revenue (million) Forecast, by Application 2019 & 2032
- Table 54: Nordics Seaweed Extracts for Cosmetics Volume (K) Forecast, by Application 2019 & 2032
- Table 55: Rest of Europe Seaweed Extracts for Cosmetics Revenue (million) Forecast, by Application 2019 & 2032
- Table 56: Rest of Europe Seaweed Extracts for Cosmetics Volume (K) Forecast, by Application 2019 & 2032
- Table 57: Global Seaweed Extracts for Cosmetics Revenue million Forecast, by Application 2019 & 2032
- Table 58: Global Seaweed Extracts for Cosmetics Volume K Forecast, by Application 2019 & 2032
- Table 59: Global Seaweed Extracts for Cosmetics Revenue million Forecast, by Types 2019 & 2032
- Table 60: Global Seaweed Extracts for Cosmetics Volume K Forecast, by Types 2019 & 2032
- Table 61: Global Seaweed Extracts for Cosmetics Revenue million Forecast, by Country 2019 & 2032
- Table 62: Global Seaweed Extracts for Cosmetics Volume K Forecast, by Country 2019 & 2032
- Table 63: Turkey Seaweed Extracts for Cosmetics Revenue (million) Forecast, by Application 2019 & 2032
- Table 64: Turkey Seaweed Extracts for Cosmetics Volume (K) Forecast, by Application 2019 & 2032
- Table 65: Israel Seaweed Extracts for Cosmetics Revenue (million) Forecast, by Application 2019 & 2032
- Table 66: Israel Seaweed Extracts for Cosmetics Volume (K) Forecast, by Application 2019 & 2032
- Table 67: GCC Seaweed Extracts for Cosmetics Revenue (million) Forecast, by Application 2019 & 2032
- Table 68: GCC Seaweed Extracts for Cosmetics Volume (K) Forecast, by Application 2019 & 2032
- Table 69: North Africa Seaweed Extracts for Cosmetics Revenue (million) Forecast, by Application 2019 & 2032
- Table 70: North Africa Seaweed Extracts for Cosmetics Volume (K) Forecast, by Application 2019 & 2032
- Table 71: South Africa Seaweed Extracts for Cosmetics Revenue (million) Forecast, by Application 2019 & 2032
- Table 72: South Africa Seaweed Extracts for Cosmetics Volume (K) Forecast, by Application 2019 & 2032
- Table 73: Rest of Middle East & Africa Seaweed Extracts for Cosmetics Revenue (million) Forecast, by Application 2019 & 2032
- Table 74: Rest of Middle East & Africa Seaweed Extracts for Cosmetics Volume (K) Forecast, by Application 2019 & 2032
- Table 75: Global Seaweed Extracts for Cosmetics Revenue million Forecast, by Application 2019 & 2032
- Table 76: Global Seaweed Extracts for Cosmetics Volume K Forecast, by Application 2019 & 2032
- Table 77: Global Seaweed Extracts for Cosmetics Revenue million Forecast, by Types 2019 & 2032
- Table 78: Global Seaweed Extracts for Cosmetics Volume K Forecast, by Types 2019 & 2032
- Table 79: Global Seaweed Extracts for Cosmetics Revenue million Forecast, by Country 2019 & 2032
- Table 80: Global Seaweed Extracts for Cosmetics Volume K Forecast, by Country 2019 & 2032
- Table 81: China Seaweed Extracts for Cosmetics Revenue (million) Forecast, by Application 2019 & 2032
- Table 82: China Seaweed Extracts for Cosmetics Volume (K) Forecast, by Application 2019 & 2032
- Table 83: India Seaweed Extracts for Cosmetics Revenue (million) Forecast, by Application 2019 & 2032
- Table 84: India Seaweed Extracts for Cosmetics Volume (K) Forecast, by Application 2019 & 2032
- Table 85: Japan Seaweed Extracts for Cosmetics Revenue (million) Forecast, by Application 2019 & 2032
- Table 86: Japan Seaweed Extracts for Cosmetics Volume (K) Forecast, by Application 2019 & 2032
- Table 87: South Korea Seaweed Extracts for Cosmetics Revenue (million) Forecast, by Application 2019 & 2032
- Table 88: South Korea Seaweed Extracts for Cosmetics Volume (K) Forecast, by Application 2019 & 2032
- Table 89: ASEAN Seaweed Extracts for Cosmetics Revenue (million) Forecast, by Application 2019 & 2032
- Table 90: ASEAN Seaweed Extracts for Cosmetics Volume (K) Forecast, by Application 2019 & 2032
- Table 91: Oceania Seaweed Extracts for Cosmetics Revenue (million) Forecast, by Application 2019 & 2032
- Table 92: Oceania Seaweed Extracts for Cosmetics Volume (K) Forecast, by Application 2019 & 2032
- Table 93: Rest of Asia Pacific Seaweed Extracts for Cosmetics Revenue (million) Forecast, by Application 2019 & 2032
- Table 94: Rest of Asia Pacific Seaweed Extracts for Cosmetics Volume (K) Forecast, by Application 2019 & 2032
Frequently Asked Questions
1. What is the projected Compound Annual Growth Rate (CAGR) of the Seaweed Extracts for Cosmetics?
The projected CAGR is approximately 4.2%.
2. Which companies are prominent players in the Seaweed Extracts for Cosmetics?
Key companies in the market include Making Cosmetics, Suboneyo Chemicals and Pharmaceuticals, Yash Chemicals, Tianjin Humate International, Marinox, AlgAran Seaweed Products, Aromantic, DuPont, Shemberg, Quingdao Nanshan Seaweed, Ceamsa, Greenfresh.
3. What are the main segments of the Seaweed Extracts for Cosmetics?
The market segments include Application, Types.
4. Can you provide details about the market size?
The market size is estimated to be USD 190.5 million as of 2022.
5. What are some drivers contributing to market growth?
N/A
6. What are the notable trends driving market growth?
N/A
7. Are there any restraints impacting market growth?
N/A
8. Can you provide examples of recent developments in the market?
N/A
9. What pricing options are available for accessing the report?
Pricing options include single-user, multi-user, and enterprise licenses priced at USD 3950.00, USD 5925.00, and USD 7900.00 respectively.
10. Is the market size provided in terms of value or volume?
The market size is provided in terms of value, measured in million and volume, measured in K.
11. Are there any specific market keywords associated with the report?
Yes, the market keyword associated with the report is "Seaweed Extracts for Cosmetics," which aids in identifying and referencing the specific market segment covered.
12. How do I determine which pricing option suits my needs best?
The pricing options vary based on user requirements and access needs. Individual users may opt for single-user licenses, while businesses requiring broader access may choose multi-user or enterprise licenses for cost-effective access to the report.
13. Are there any additional resources or data provided in the Seaweed Extracts for Cosmetics report?
While the report offers comprehensive insights, it's advisable to review the specific contents or supplementary materials provided to ascertain if additional resources or data are available.
14. How can I stay updated on further developments or reports in the Seaweed Extracts for Cosmetics?
To stay informed about further developments, trends, and reports in the Seaweed Extracts for Cosmetics, consider subscribing to industry newsletters, following relevant companies and organizations, or regularly checking reputable industry news sources and publications.
Methodology
Step 1 - Identification of Relevant Samples Size from Population Database


Step 2 - Approaches for Defining Global Market Size (Value, Volume* & Price*)

Note*: In applicable scenarios
Step 3 - Data Sources
Primary Research
- Web Analytics
- Survey Reports
- Research Institute
- Latest Research Reports
- Opinion Leaders
Secondary Research
- Annual Reports
- White Paper
- Latest Press Release
- Industry Association
- Paid Database
- Investor Presentations

Step 4 - Data Triangulation
Involves using different sources of information in order to increase the validity of a study
These sources are likely to be stakeholders in a program - participants, other researchers, program staff, other community members, and so on.
Then we put all data in single framework & apply various statistical tools to find out the dynamic on the market.
During the analysis stage, feedback from the stakeholder groups would be compared to determine areas of agreement as well as areas of divergence


