

Key Insights
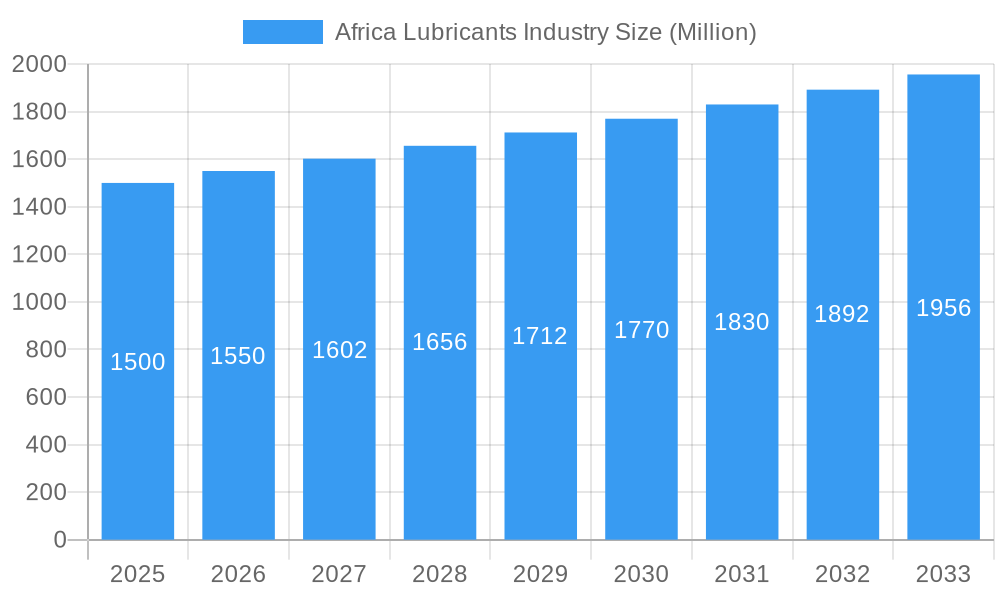
The African lubricants market, valued at approximately 2.52 billion in 2024, is projected to achieve a Compound Annual Growth Rate (CAGR) of 3.43% from 2025 to 2033. This growth is propelled by a rapidly expanding automotive sector across key nations, including South Africa, Egypt, and Nigeria. Urbanization and infrastructure development further stimulate demand for vehicle maintenance and lubrication. The increasing prominence of commercial vehicle transportation and the burgeoning motorcycle segment are also significant market drivers. Government initiatives focused on infrastructure enhancement and economic expansion are positively influencing lubricant demand.
Africa Lubricants Industry Market Size (In Billion)
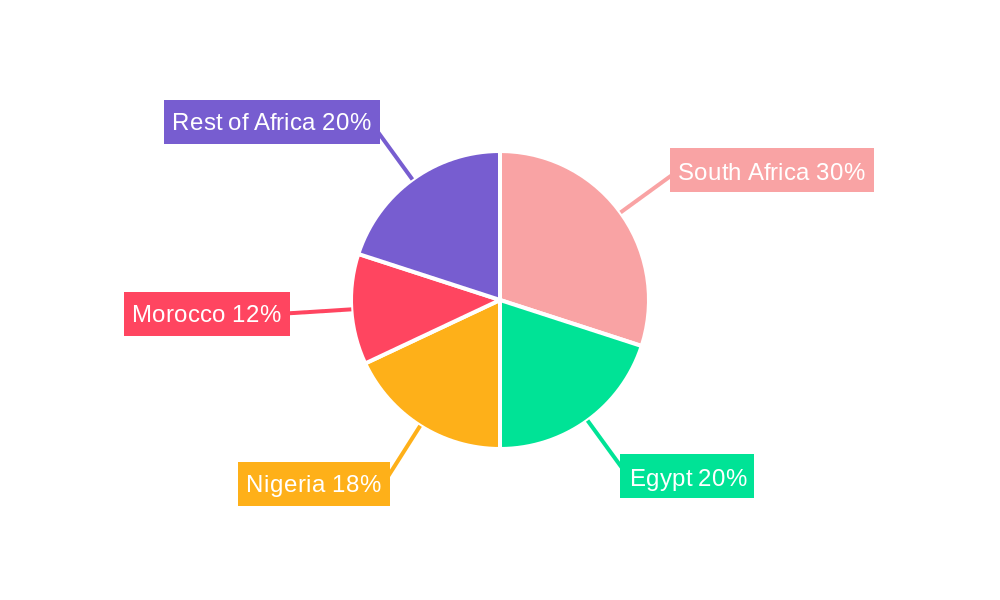
The market is segmented by vehicle type (commercial, motorcycle, passenger) and product type (engine oils, greases, hydraulic fluids, transmission & gear oils). Major national markets include South Africa, Egypt, Morocco, and Nigeria, with substantial growth potential also observed in the fragmented "Rest of Africa" segment. Competitive forces are driven by leading companies like ExxonMobil, TotalEnergies, Shell, and local entities such as Afriquia and Astron Energy, who focus on product innovation, distribution expansion, and brand development. Future growth trajectories will be shaped by technological advancements in lubricant formulations, a growing emphasis on environmental sustainability, and the adoption of stringent emission standards.
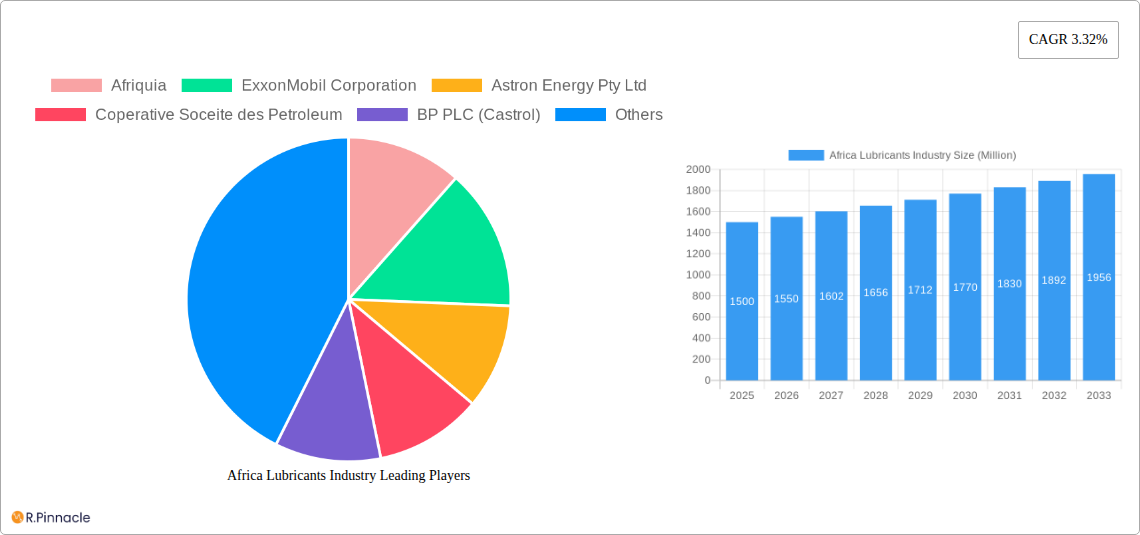
Africa Lubricants Industry Company Market Share
Africa Lubricants Industry: Market Analysis Report (2019-2033)
This comprehensive report analyzes the African lubricants industry, detailing market size, segmentation, growth drivers, challenges, and future outlook for the period 2019-2033. The base year is 2024, with a forecast period from 2025 to 2033. Key industry players, including Afriquia, ExxonMobil Corporation, Astron Energy Pty Ltd, Cooperative Societe des Petroleum, BP PLC (Castrol), TotalEnergies, Royal Dutch Shell PLC, Misr Petroleum, Engen Petroleum Ltd, and OLA Energy, are examined for their market share and strategic initiatives. This report is an essential resource for industry professionals, investors, and stakeholders seeking to understand the dynamics of this evolving market.
Africa Lubricants Industry Market Structure & Innovation Trends
This section analyzes the competitive landscape of the African lubricants market, focusing on market concentration, innovation drivers, regulatory frameworks, and M&A activity. The report estimates that the market size in 2025 will be approximately xx Million. Market share data for key players will be provided.
- Market Concentration: The market is moderately concentrated, with the top 5 players holding approximately xx% of the market share in 2025. This is expected to shift slightly by 2033.
- Innovation Drivers: Growing demand for high-performance lubricants, stricter emission regulations, and the increasing adoption of advanced technologies are key drivers of innovation.
- Regulatory Frameworks: Varying regulations across different African countries influence product specifications and distribution channels. The report will detail these regulations and their impact.
- Product Substitutes: Bio-lubricants and other sustainable alternatives are emerging as potential substitutes, although their market penetration remains relatively low.
- End-User Demographics: The report will analyze end-user segments (commercial vehicles, passenger vehicles, motorcycles) and their contribution to the overall market.
- M&A Activities: The report will cover significant mergers and acquisitions in the industry, analyzing their impact on market dynamics and deal values (estimated at xx Million in total during the historical period).
Africa Lubricants Industry Market Dynamics & Trends
This section explores the key factors influencing market growth, including technological advancements, consumer preferences, and competitive dynamics. The Compound Annual Growth Rate (CAGR) for the forecast period is projected to be xx%. Market penetration of various lubricant types will be analyzed regionally. The total market size is anticipated to reach xx Million by 2033.
(Detailed paragraph analysis of market growth drivers, technological disruptions, consumer preferences, and competitive dynamics will be provided here.)
Dominant Regions & Segments in Africa Lubricants Industry
This section identifies the leading regions, countries, and segments within the African lubricants market. The analysis will cover By Vehicle Type (Commercial Vehicles, Motorcycles, Passenger Vehicles), By Product Type (Engine Oils, Greases, Hydraulic Fluids, Transmission & Gear Oils), and By Country (Egypt, Morocco, Nigeria, South Africa, Rest of Africa).
Leading Region/Country: South Africa is expected to remain the dominant market throughout the forecast period due to its advanced automotive sector and strong economy. Nigeria shows significant potential for growth.
Key Drivers by Segment:
- Commercial Vehicles: Growth driven by the expanding transportation and logistics sectors.
- Passenger Vehicles: Growth driven by increasing vehicle ownership and rising disposable incomes.
- Motorcycles: Growth driven by their popularity as primary transportation in many African countries.
- Engine Oils: Highest market share due to essential vehicle maintenance requirements.
- Other Product Types: Growth driven by industrialization and infrastructure development.
(Detailed paragraph dominance analysis with market size and growth projections for each region and segment will be provided here.)
Africa Lubricants Industry Product Innovations
(This section will detail recent advancements in lubricant technology, focusing on improved performance, sustainability, and cost-effectiveness. Specific examples of new product launches and their market impact will be given.)
Report Scope & Segmentation Analysis
This report segments the African lubricants market by vehicle type, product type, and country. Detailed growth projections, market sizes, and competitive dynamics are provided for each segment. The total market size in 2025 is estimated at xx Million.
(Detailed paragraphs for each segment (By Vehicle Type, By Product Type, By Country) with growth projections, market sizes, and competitive dynamics will be provided here.)
Key Drivers of Africa Lubricants Industry Growth
(This section will detail the key factors driving the growth of the African lubricants market, including economic growth, infrastructure development, increasing vehicle ownership, and regulatory changes. Specific examples will be used to illustrate these drivers.)
Challenges in the Africa Lubricants Industry Sector
(This section will discuss the challenges faced by the African lubricants industry, including supply chain disruptions, regulatory hurdles, counterfeiting, and competition from cheaper, lower-quality products. Quantifiable impacts of these challenges will be addressed.)
Emerging Opportunities in Africa Lubricants Industry
(This section will highlight emerging opportunities in the African lubricants market, such as the growing demand for specialized lubricants, the increasing adoption of advanced technologies, and the potential for growth in untapped markets. Specific opportunities and market potential will be analyzed.)
Leading Players in the Africa Lubricants Industry Market
- Afriquia
- ExxonMobil Corporation
- Astron Energy Pty Ltd
- Cooperative Societe des Petroleum
- BP PLC (Castrol)
- TotalEnergies
- Royal Dutch Shell PLC
- Misr Petroleum
- Engen Petroleum Ltd
- OLA Energy
Key Developments in Africa Lubricants Industry
- September 2021: Engen launched its Engen App, boosting convenience and brand recognition, increasing lubricant sales.
- August 2021: OLA Energy invested EUR 200 Million and established 80 new service stations annually (2017-2020) across its pan-African network.
- January 2022: ExxonMobil Corporation reorganized into three business lines: Upstream Company, Product Solutions, and Low Carbon Solutions.
Future Outlook for Africa Lubricants Industry Market
(This section will summarize the future growth potential of the African lubricants market, highlighting key opportunities and strategic imperatives for success. The expected market size in 2033, along with potential growth accelerators will be discussed.)
Africa Lubricants Industry Segmentation
-
1. Vehicle Type
- 1.1. Commercial Vehicles
- 1.2. Motorcycles
- 1.3. Passenger Vehicles
-
2. Product Type
- 2.1. Engine Oils
- 2.2. Greases
- 2.3. Hydraulic Fluids
- 2.4. Transmission & Gear Oils
Africa Lubricants Industry Segmentation By Geography
-
1. Africa
- 1.1. Nigeria
- 1.2. South Africa
- 1.3. Egypt
- 1.4. Kenya
- 1.5. Ethiopia
- 1.6. Morocco
- 1.7. Ghana
- 1.8. Algeria
- 1.9. Tanzania
- 1.10. Ivory Coast
Africa Lubricants Industry Regional Market Share
Geographic Coverage of Africa Lubricants Industry
Africa Lubricants Industry REPORT HIGHLIGHTS
| Aspects | Details |
|---|---|
| Study Period | 2020-2034 |
| Base Year | 2025 |
| Estimated Year | 2026 |
| Forecast Period | 2026-2034 |
| Historical Period | 2020-2025 |
| Growth Rate | CAGR of 3.43% from 2020-2034 |
| Segmentation |
|
Table of Contents
- 1. Introduction
- 1.1. Research Scope
- 1.2. Market Segmentation
- 1.3. Research Objective
- 1.4. Definitions and Assumptions
- 2. Executive Summary
- 2.1. Market Snapshot
- 3. Market Dynamics
- 3.1. Market Drivers
- 3.2. Market Restrains
- 3.3. Market Trends
- 3.4. Market Opportunities
- 4. Market Factor Analysis
- 4.1. Porters Five Forces
- 4.1.1. Bargaining Power of Suppliers
- 4.1.2. Bargaining Power of Buyers
- 4.1.3. Threat of New Entrants
- 4.1.4. Threat of Substitutes
- 4.1.5. Competitive Rivalry
- 4.2. PESTEL analysis
- 4.3. BCG Analysis
- 4.3.1. Stars (High Growth, High Market Share)
- 4.3.2. Cash Cows (Low Growth, High Market Share)
- 4.3.3. Question Mark (High Growth, Low Market Share)
- 4.3.4. Dogs (Low Growth, Low Market Share)
- 4.4. Ansoff Matrix Analysis
- 4.5. Supply Chain Analysis
- 4.6. Regulatory Landscape
- 4.7. Current Market Potential and Opportunity Assessment (TAM–SAM–SOM Framework)
- 4.8. PRI Analyst Note
- 4.1. Porters Five Forces
- 5. Market Analysis, Insights and Forecast 2021-2033
- 5.1. Market Analysis, Insights and Forecast - by Vehicle Type
- 5.1.1. Commercial Vehicles
- 5.1.2. Motorcycles
- 5.1.3. Passenger Vehicles
- 5.2. Market Analysis, Insights and Forecast - by Product Type
- 5.2.1. Engine Oils
- 5.2.2. Greases
- 5.2.3. Hydraulic Fluids
- 5.2.4. Transmission & Gear Oils
- 5.3. Market Analysis, Insights and Forecast - by Region
- 5.3.1. Africa
- 5.1. Market Analysis, Insights and Forecast - by Vehicle Type
- 6. Africa Lubricants Industry Analysis, Insights and Forecast, 2021-2033
- 6.1. Market Analysis, Insights and Forecast - by Vehicle Type
- 6.1.1. Commercial Vehicles
- 6.1.2. Motorcycles
- 6.1.3. Passenger Vehicles
- 6.2. Market Analysis, Insights and Forecast - by Product Type
- 6.2.1. Engine Oils
- 6.2.2. Greases
- 6.2.3. Hydraulic Fluids
- 6.2.4. Transmission & Gear Oils
- 6.1. Market Analysis, Insights and Forecast - by Vehicle Type
- 7. Competitive Analysis
- 7.1. Company Profiles
- 7.1.1 Afriquia
- 7.1.1.1. Company Overview
- 7.1.1.2. Products
- 7.1.1.3. Company Financials
- 7.1.1.4. SWOT Analysis
- 7.1.2 ExxonMobil Corporation
- 7.1.2.1. Company Overview
- 7.1.2.2. Products
- 7.1.2.3. Company Financials
- 7.1.2.4. SWOT Analysis
- 7.1.3 Astron Energy Pty Ltd
- 7.1.3.1. Company Overview
- 7.1.3.2. Products
- 7.1.3.3. Company Financials
- 7.1.3.4. SWOT Analysis
- 7.1.4 Coperative Soceite des Petroleum
- 7.1.4.1. Company Overview
- 7.1.4.2. Products
- 7.1.4.3. Company Financials
- 7.1.4.4. SWOT Analysis
- 7.1.5 BP PLC (Castrol)
- 7.1.5.1. Company Overview
- 7.1.5.2. Products
- 7.1.5.3. Company Financials
- 7.1.5.4. SWOT Analysis
- 7.1.6 TotalEnergie
- 7.1.6.1. Company Overview
- 7.1.6.2. Products
- 7.1.6.3. Company Financials
- 7.1.6.4. SWOT Analysis
- 7.1.7 Royal Dutch Shell PLC
- 7.1.7.1. Company Overview
- 7.1.7.2. Products
- 7.1.7.3. Company Financials
- 7.1.7.4. SWOT Analysis
- 7.1.8 Misr Petroleum
- 7.1.8.1. Company Overview
- 7.1.8.2. Products
- 7.1.8.3. Company Financials
- 7.1.8.4. SWOT Analysis
- 7.1.9 Engen Petroleum Ltd
- 7.1.9.1. Company Overview
- 7.1.9.2. Products
- 7.1.9.3. Company Financials
- 7.1.9.4. SWOT Analysis
- 7.1.10 OLA Energy
- 7.1.10.1. Company Overview
- 7.1.10.2. Products
- 7.1.10.3. Company Financials
- 7.1.10.4. SWOT Analysis
- 7.1.1 Afriquia
- 7.2. Market Entropy
- 7.2.1 Company's Key Areas Served
- 7.2.2 Recent Developments
- 7.3. Company Market Share Analysis 2025
- 7.3.1 Top 5 Companies Market Share Analysis
- 7.3.2 Top 3 Companies Market Share Analysis
- 7.4. List of Potential Customers
- 8. Research Methodology
List of Figures
- Figure 1: Africa Lubricants Industry Revenue Breakdown (billion, %) by Product 2025 & 2033
- Figure 2: Africa Lubricants Industry Share (%) by Company 2025
List of Tables
- Table 1: Africa Lubricants Industry Revenue billion Forecast, by Vehicle Type 2020 & 2033
- Table 2: Africa Lubricants Industry Volume Billion Forecast, by Vehicle Type 2020 & 2033
- Table 3: Africa Lubricants Industry Revenue billion Forecast, by Product Type 2020 & 2033
- Table 4: Africa Lubricants Industry Volume Billion Forecast, by Product Type 2020 & 2033
- Table 5: Africa Lubricants Industry Revenue billion Forecast, by Region 2020 & 2033
- Table 6: Africa Lubricants Industry Volume Billion Forecast, by Region 2020 & 2033
- Table 7: Africa Lubricants Industry Revenue billion Forecast, by Vehicle Type 2020 & 2033
- Table 8: Africa Lubricants Industry Volume Billion Forecast, by Vehicle Type 2020 & 2033
- Table 9: Africa Lubricants Industry Revenue billion Forecast, by Product Type 2020 & 2033
- Table 10: Africa Lubricants Industry Volume Billion Forecast, by Product Type 2020 & 2033
- Table 11: Africa Lubricants Industry Revenue billion Forecast, by Country 2020 & 2033
- Table 12: Africa Lubricants Industry Volume Billion Forecast, by Country 2020 & 2033
- Table 13: Nigeria Africa Lubricants Industry Revenue (billion) Forecast, by Application 2020 & 2033
- Table 14: Nigeria Africa Lubricants Industry Volume (Billion) Forecast, by Application 2020 & 2033
- Table 15: South Africa Africa Lubricants Industry Revenue (billion) Forecast, by Application 2020 & 2033
- Table 16: South Africa Africa Lubricants Industry Volume (Billion) Forecast, by Application 2020 & 2033
- Table 17: Egypt Africa Lubricants Industry Revenue (billion) Forecast, by Application 2020 & 2033
- Table 18: Egypt Africa Lubricants Industry Volume (Billion) Forecast, by Application 2020 & 2033
- Table 19: Kenya Africa Lubricants Industry Revenue (billion) Forecast, by Application 2020 & 2033
- Table 20: Kenya Africa Lubricants Industry Volume (Billion) Forecast, by Application 2020 & 2033
- Table 21: Ethiopia Africa Lubricants Industry Revenue (billion) Forecast, by Application 2020 & 2033
- Table 22: Ethiopia Africa Lubricants Industry Volume (Billion) Forecast, by Application 2020 & 2033
- Table 23: Morocco Africa Lubricants Industry Revenue (billion) Forecast, by Application 2020 & 2033
- Table 24: Morocco Africa Lubricants Industry Volume (Billion) Forecast, by Application 2020 & 2033
- Table 25: Ghana Africa Lubricants Industry Revenue (billion) Forecast, by Application 2020 & 2033
- Table 26: Ghana Africa Lubricants Industry Volume (Billion) Forecast, by Application 2020 & 2033
- Table 27: Algeria Africa Lubricants Industry Revenue (billion) Forecast, by Application 2020 & 2033
- Table 28: Algeria Africa Lubricants Industry Volume (Billion) Forecast, by Application 2020 & 2033
- Table 29: Tanzania Africa Lubricants Industry Revenue (billion) Forecast, by Application 2020 & 2033
- Table 30: Tanzania Africa Lubricants Industry Volume (Billion) Forecast, by Application 2020 & 2033
- Table 31: Ivory Coast Africa Lubricants Industry Revenue (billion) Forecast, by Application 2020 & 2033
- Table 32: Ivory Coast Africa Lubricants Industry Volume (Billion) Forecast, by Application 2020 & 2033
Frequently Asked Questions
1. What is the projected Compound Annual Growth Rate (CAGR) of the Africa Lubricants Industry?
The projected CAGR is approximately 3.43%.
2. Which companies are prominent players in the Africa Lubricants Industry?
Key companies in the market include Afriquia, ExxonMobil Corporation, Astron Energy Pty Ltd, Coperative Soceite des Petroleum, BP PLC (Castrol), TotalEnergie, Royal Dutch Shell PLC, Misr Petroleum, Engen Petroleum Ltd, OLA Energy.
3. What are the main segments of the Africa Lubricants Industry?
The market segments include Vehicle Type, Product Type.
4. Can you provide details about the market size?
The market size is estimated to be USD 2.52 billion as of 2022.
5. What are some drivers contributing to market growth?
Growing Demand for Catalytic Converters from the Automotive Industry; Increasing Demand for Platinum. Palladium. and Ruthenium from the Electronics Industry; Growing Jewelry Consumption in Asia-Pacific Countries.
6. What are the notable trends driving market growth?
Largest Segment By Vehicle Type : <span style="font-family: 'regular_bold';color:#0e7db3;">Commercial Vehicles</span>.
7. Are there any restraints impacting market growth?
High Costs Involved in Production and Maintenance; Other Restraints.
8. Can you provide examples of recent developments in the market?
January 2022: Effective April 1, ExxonMobil Corporation was organized along three business lines - ExxonMobil Upstream Company, ExxonMobil Product Solutions and ExxonMobil Low Carbon Solutions.September 2021: Engen has made a ground-breaking development by launching its Engen App for the convenience of its customers. Engen will offer all its products and services through this app, making it easier for the consumers. This is expected to increase the sales of its lubricants and gain brand recognition in the region.August 2021: During 2017-2020, OLA Energy invested around EUR 200 million and established 80 new service stations every year across its pan-African network, including Gabon, Morocco, Kenya, Reunion, and Egypt.
9. What pricing options are available for accessing the report?
Pricing options include single-user, multi-user, and enterprise licenses priced at USD 3800, USD 4500, and USD 5800 respectively.
10. Is the market size provided in terms of value or volume?
The market size is provided in terms of value, measured in billion and volume, measured in Billion.
11. Are there any specific market keywords associated with the report?
Yes, the market keyword associated with the report is "Africa Lubricants Industry," which aids in identifying and referencing the specific market segment covered.
12. How do I determine which pricing option suits my needs best?
The pricing options vary based on user requirements and access needs. Individual users may opt for single-user licenses, while businesses requiring broader access may choose multi-user or enterprise licenses for cost-effective access to the report.
13. Are there any additional resources or data provided in the Africa Lubricants Industry report?
While the report offers comprehensive insights, it's advisable to review the specific contents or supplementary materials provided to ascertain if additional resources or data are available.
14. How can I stay updated on further developments or reports in the Africa Lubricants Industry?
To stay informed about further developments, trends, and reports in the Africa Lubricants Industry, consider subscribing to industry newsletters, following relevant companies and organizations, or regularly checking reputable industry news sources and publications.
Methodology
Step 1 - Identification of Relevant Samples Size from Population Database


Step 2 - Approaches for Defining Global Market Size (Value, Volume* & Price*)

Note*: In applicable scenarios
Step 3 - Data Sources
Primary Research
- Web Analytics
- Survey Reports
- Research Institute
- Latest Research Reports
- Opinion Leaders
Secondary Research
- Annual Reports
- White Paper
- Latest Press Release
- Industry Association
- Paid Database
- Investor Presentations

Step 4 - Data Triangulation
Involves using different sources of information in order to increase the validity of a study
These sources are likely to be stakeholders in a program - participants, other researchers, program staff, other community members, and so on.
Then we put all data in single framework & apply various statistical tools to find out the dynamic on the market.
During the analysis stage, feedback from the stakeholder groups would be compared to determine areas of agreement as well as areas of divergence