
Key Insights
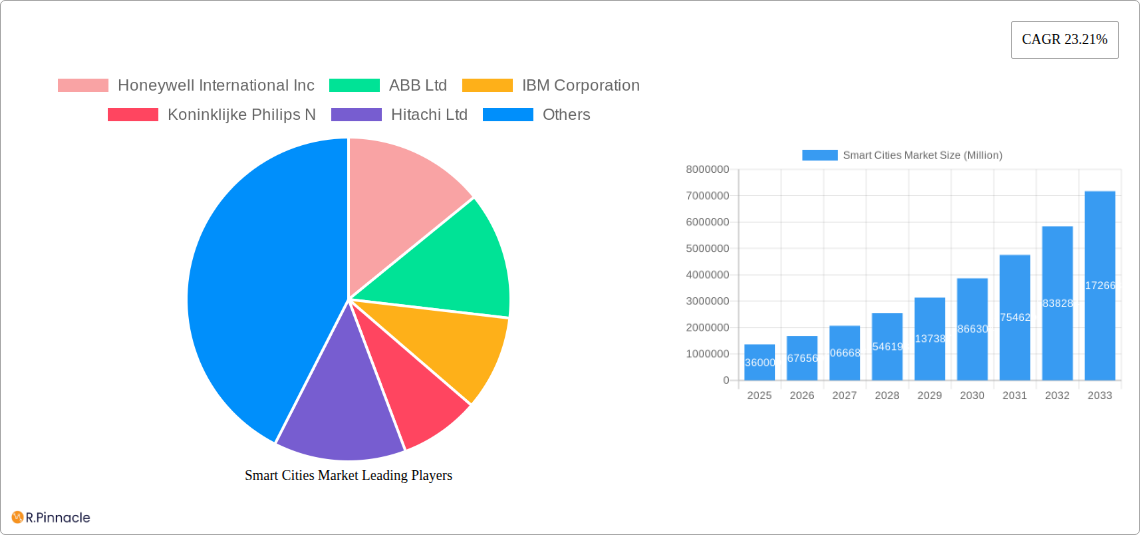
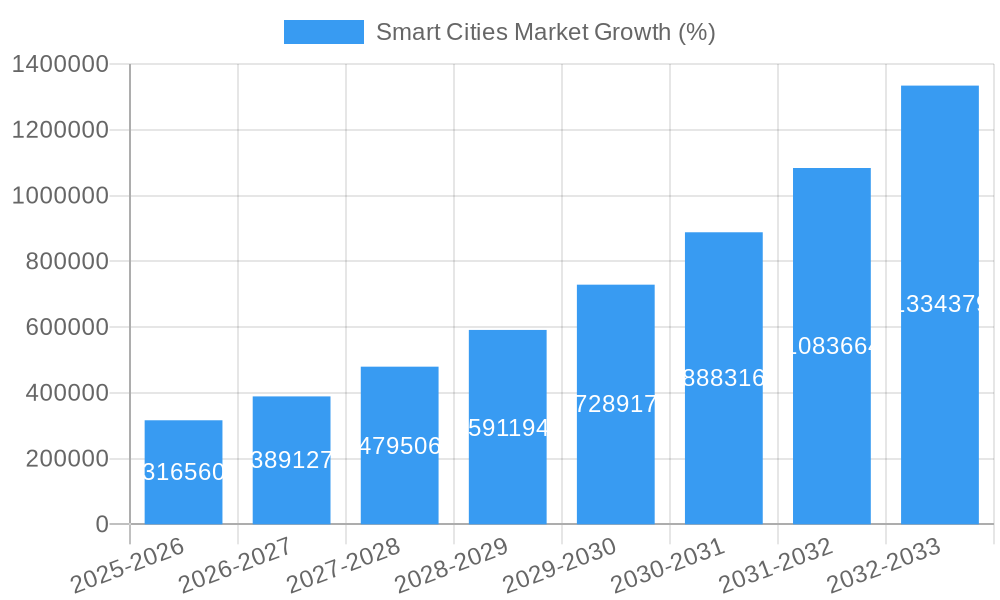
The global Smart Cities market is experiencing robust growth, projected to reach \$1.36 trillion in 2025 and exhibiting a remarkable Compound Annual Growth Rate (CAGR) of 23.21%. This expansion is fueled by several key drivers. Increasing urbanization necessitates efficient infrastructure management and improved quality of life, driving significant investments in smart city solutions. Furthermore, advancements in technologies such as IoT, AI, and big data analytics are enabling the development of sophisticated smart city applications across various sectors. Government initiatives promoting digital transformation and sustainable development further bolster market growth. The market is segmented by solution, with Smart Mobility Management, Smart Public Safety, and Smart Healthcare representing significant portions due to their direct impact on citizen well-being and economic productivity. Competitive dynamics are shaped by a diverse landscape of established technology giants like Honeywell, IBM, and Siemens, alongside emerging players specializing in niche smart city solutions. While data privacy concerns and high initial investment costs present challenges, the long-term benefits of improved efficiency, reduced operational expenses, and enhanced citizen engagement are overcoming these restraints, ensuring sustained market expansion.
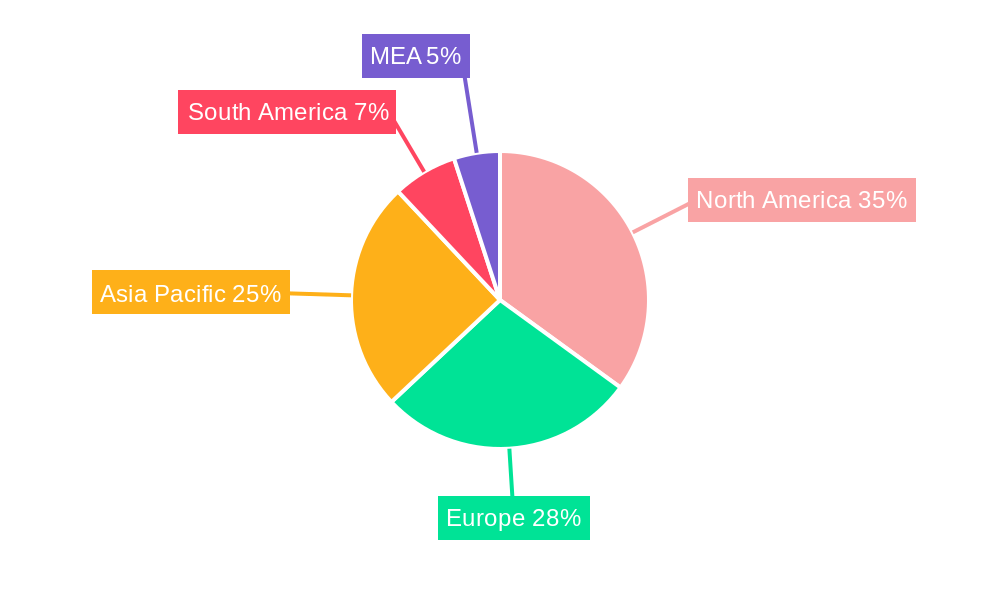
Geographic distribution reveals significant regional variations. North America currently holds a substantial market share due to early adoption and advanced technological infrastructure. However, the Asia-Pacific region is projected to witness the fastest growth rate, driven by rapid urbanization and substantial government investments in smart city projects across countries like China and India. Europe is also a key market, with strong government support for sustainable development and digital infrastructure upgrades. The competitive landscape is expected to become even more dynamic in the coming years, with mergers and acquisitions, strategic partnerships, and technological innovations shaping the market's trajectory. The continued focus on integrating various smart city solutions into cohesive, interconnected platforms will further propel market growth throughout the forecast period (2025-2033).
Smart Cities Market Report: 2019-2033 Forecast
This comprehensive report provides an in-depth analysis of the global Smart Cities Market, offering invaluable insights for industry professionals, investors, and strategists. With a study period spanning 2019-2033, a base year of 2025, and a forecast period of 2025-2033, this report presents a detailed overview of market dynamics, key players, and future trends. The market is expected to reach xx Million by 2033, exhibiting a robust CAGR.
Smart Cities Market Market Structure & Innovation Trends
The Smart Cities market is characterized by a moderately concentrated landscape, with key players like Honeywell International Inc, ABB Ltd, IBM Corporation, and Siemens AG holding significant market share. However, the market also exhibits considerable dynamism, driven by continuous innovation in areas such as AI, IoT, and big data analytics. Regulatory frameworks, varying across regions, significantly influence market growth, while the emergence of innovative solutions presents both opportunities and challenges for established players. Product substitutes, such as traditional infrastructure solutions, are gradually being replaced by smarter, more efficient alternatives. End-user demographics are shifting towards greater adoption of smart city solutions across various sectors, including transportation, healthcare, and energy. The market has witnessed significant M&A activity, with deal values exceeding xx Million in recent years. For instance, Emerson Electric Co.'s sale of InSinkErator highlights the strategic shifts within the broader ecosystem.
- Market Concentration: Moderately concentrated, with top players holding approximately xx% market share.
- Innovation Drivers: AI, IoT, Big Data Analytics, Cloud Computing.
- Regulatory Frameworks: Varying across regions, impacting market growth and adoption rates.
- M&A Activity: Significant activity with deal values exceeding xx Million in recent years.
Smart Cities Market Market Dynamics & Trends
The Smart Cities market is experiencing rapid growth fueled by several key factors. Increasing urbanization and the need for efficient resource management are major drivers, along with government initiatives promoting smart city development and investments in advanced technologies. Technological advancements, such as the widespread adoption of 5G and IoT devices, are transforming urban landscapes and creating new opportunities for innovation. Consumer preferences are shifting towards more sustainable, technologically advanced solutions, and competition is intensifying among established players and new entrants, resulting in increased innovation and price competitiveness. Market penetration continues to expand, reaching xx% in 2024 and is projected to reach xx% by 2033.
Dominant Regions & Segments in Smart Cities Market
The Smart Cities market exhibits regional variations in growth and adoption rates. North America and Europe currently lead the market, driven by robust economic policies and well-developed infrastructure, with Asia-Pacific showing significant growth potential. Among the segments, Smart Mobility Management and Smart Utilities currently dominate due to high initial investments and the potential for significant cost savings and efficiency improvements. However, Smart Healthcare and Smart Public Safety are emerging as rapidly growing sectors, driven by increasing urbanization and the need to improve public services.
- Leading Region: North America
- Key Drivers (North America): Strong economic conditions, advanced infrastructure, government support for smart city initiatives.
- Leading Segment: Smart Mobility Management
- Key Drivers (Smart Mobility): Increasing traffic congestion, need for efficient transportation systems, government regulations promoting sustainable transportation.
Smart Cities Market Product Innovations
Recent product innovations focus on integrating AI and machine learning for predictive maintenance, real-time traffic optimization, and improved resource allocation. The market is also witnessing the integration of various technologies such as edge computing and blockchain, to enhance data security and efficiency. These innovations cater to the growing need for improved city services, increased sustainability, and enhanced citizen engagement, effectively improving market fit and driving overall growth.
Report Scope & Segmentation Analysis
This report segments the Smart Cities market by solution: Smart Mobility Management, Smart Public Safety, Smart Healthcare, Smart Building, Smart Utilities, Smart Security, Smart Education, and Other Solutions. Each segment is analyzed based on market size, growth projections, competitive dynamics, and key trends. For example, the Smart Mobility Management segment is projected to witness significant growth due to the increasing adoption of intelligent transportation systems, while the Smart Utilities segment is expected to expand driven by growing demand for efficient energy management solutions.
Key Drivers of Smart Cities Market Growth
The Smart Cities market is propelled by several factors. Technological advancements such as AI, IoT, and big data analytics play a crucial role in enabling the development of smart solutions. Government initiatives and funding for smart city projects provide a strong impetus for market growth. Furthermore, increasing urbanization and the need for more efficient and sustainable cities further contribute to the market's expansion. For instance, investments in 5G networks are creating new opportunities for smart city applications.
Challenges in the Smart Cities Market Sector
Despite the significant growth potential, several challenges hinder the development of the Smart Cities market. High initial investment costs, concerns regarding data security and privacy, and the need for robust cybersecurity measures pose significant hurdles. Additionally, regulatory complexities and fragmented standards across different regions can impede market growth and adoption. Furthermore, the lack of skilled workforce is a factor affecting the market.
Emerging Opportunities in Smart Cities Market
The Smart Cities market presents various emerging opportunities. The growing adoption of edge computing technologies and the increasing use of AI and machine learning for predictive maintenance and resource optimization offer substantial growth prospects. The development of new smart city applications, such as smart agriculture and smart tourism, is also creating new markets and opportunities for innovation. Furthermore, growing private sector participation and investments are expected to fuel market expansion.
Leading Players in the Smart Cities Market Market
- Honeywell International Inc
- ABB Ltd
- IBM Corporation
- Koninklijke Philips N
- Hitachi Ltd
- Emerson Electric Co
- Cisco Systems Inc
- Siemens AG
- General Electric Co
- Schneider Electric SE
- Ericsson Inc
- Huawei Technologies Co Ltd
- Nokia Corporation
Key Developments in Smart Cities Market Industry
- June 2023: TIM and Ericsson announced increased investments in private networks and IoT projects in Brazil, focusing on smart city initiatives like public lighting. This signifies growing market penetration in emerging economies.
- November 2022: Emerson Electric Co. sold its InSinkErator business for USD 3 Billion. While not directly related to core smart city technologies, this highlights the strategic realignment of companies within the broader technology and infrastructure sectors.
Future Outlook for Smart Cities Market Market
The Smart Cities market is poised for continued strong growth, driven by technological advancements, increasing urbanization, and government initiatives. The integration of emerging technologies, such as AI and blockchain, will further enhance the capabilities of smart city solutions. This will drive adoption across various sectors, leading to a more efficient, sustainable, and resilient urban environment. Strategic partnerships between technology companies and municipalities are expected to play a significant role in accelerating the growth of the Smart Cities market.
Smart Cities Market Segmentation
-
1. Solution
- 1.1. Smart Mobility Management
- 1.2. Smart Public Safety
- 1.3. Smart Healthcare
- 1.4. Smart Building
- 1.5. Smart Utilities
- 1.6. Smart Security
- 1.7. Smart Education
- 1.8. Other Solutions
Smart Cities Market Segmentation By Geography
-
1. North America
- 1.1. United States
- 1.2. Canada
-
2. Europe
- 2.1. United Kingdom
- 2.2. Germany
- 2.3. France
- 2.4. Sweden
- 2.5. Rest of Europe
-
3. Asia Pacific
- 3.1. China
- 3.2. Japan
- 3.3. India
- 3.4. Australia
- 3.5. South Korea
- 3.6. Rest of Asia Pacific
-
4. Latin America
- 4.1. Mexico
- 4.2. Brazil
- 4.3. Argentina
- 4.4. Rest of Latin America
-
5. Middle East and Africa
- 5.1. Saudi Arabia
- 5.2. United Arab Emirates
- 5.3. South Africa
- 5.4. Rest of Middle East and Africa
Smart Cities Market REPORT HIGHLIGHTS
| Aspects | Details |
|---|---|
| Study Period | 2019-2033 |
| Base Year | 2024 |
| Estimated Year | 2025 |
| Forecast Period | 2025-2033 |
| Historical Period | 2019-2024 |
| Growth Rate | CAGR of 23.21% from 2019-2033 |
| Segmentation |
|
Table of Contents
- 1. Introduction
- 1.1. Research Scope
- 1.2. Market Segmentation
- 1.3. Research Methodology
- 1.4. Definitions and Assumptions
- 2. Executive Summary
- 2.1. Introduction
- 3. Market Dynamics
- 3.1. Introduction
- 3.2. Market Drivers
- 3.2.1. Rising Adoption of AI and IoT; Growth in the need for public safety and security
- 3.3. Market Restrains
- 3.3.1. The high cost of safety connection devices; Lack of awareness about its developments in the industry
- 3.4. Market Trends
- 3.4.1. Adoption of AI and IoT to be Major Drivers for the Market
- 4. Market Factor Analysis
- 4.1. Porters Five Forces
- 4.2. Supply/Value Chain
- 4.3. PESTEL analysis
- 4.4. Market Entropy
- 4.5. Patent/Trademark Analysis
- 5. Global Smart Cities Market Analysis, Insights and Forecast, 2019-2031
- 5.1. Market Analysis, Insights and Forecast - by Solution
- 5.1.1. Smart Mobility Management
- 5.1.2. Smart Public Safety
- 5.1.3. Smart Healthcare
- 5.1.4. Smart Building
- 5.1.5. Smart Utilities
- 5.1.6. Smart Security
- 5.1.7. Smart Education
- 5.1.8. Other Solutions
- 5.2. Market Analysis, Insights and Forecast - by Region
- 5.2.1. North America
- 5.2.2. Europe
- 5.2.3. Asia Pacific
- 5.2.4. Latin America
- 5.2.5. Middle East and Africa
- 5.1. Market Analysis, Insights and Forecast - by Solution
- 6. North America Smart Cities Market Analysis, Insights and Forecast, 2019-2031
- 6.1. Market Analysis, Insights and Forecast - by Solution
- 6.1.1. Smart Mobility Management
- 6.1.2. Smart Public Safety
- 6.1.3. Smart Healthcare
- 6.1.4. Smart Building
- 6.1.5. Smart Utilities
- 6.1.6. Smart Security
- 6.1.7. Smart Education
- 6.1.8. Other Solutions
- 6.1. Market Analysis, Insights and Forecast - by Solution
- 7. Europe Smart Cities Market Analysis, Insights and Forecast, 2019-2031
- 7.1. Market Analysis, Insights and Forecast - by Solution
- 7.1.1. Smart Mobility Management
- 7.1.2. Smart Public Safety
- 7.1.3. Smart Healthcare
- 7.1.4. Smart Building
- 7.1.5. Smart Utilities
- 7.1.6. Smart Security
- 7.1.7. Smart Education
- 7.1.8. Other Solutions
- 7.1. Market Analysis, Insights and Forecast - by Solution
- 8. Asia Pacific Smart Cities Market Analysis, Insights and Forecast, 2019-2031
- 8.1. Market Analysis, Insights and Forecast - by Solution
- 8.1.1. Smart Mobility Management
- 8.1.2. Smart Public Safety
- 8.1.3. Smart Healthcare
- 8.1.4. Smart Building
- 8.1.5. Smart Utilities
- 8.1.6. Smart Security
- 8.1.7. Smart Education
- 8.1.8. Other Solutions
- 8.1. Market Analysis, Insights and Forecast - by Solution
- 9. Latin America Smart Cities Market Analysis, Insights and Forecast, 2019-2031
- 9.1. Market Analysis, Insights and Forecast - by Solution
- 9.1.1. Smart Mobility Management
- 9.1.2. Smart Public Safety
- 9.1.3. Smart Healthcare
- 9.1.4. Smart Building
- 9.1.5. Smart Utilities
- 9.1.6. Smart Security
- 9.1.7. Smart Education
- 9.1.8. Other Solutions
- 9.1. Market Analysis, Insights and Forecast - by Solution
- 10. Middle East and Africa Smart Cities Market Analysis, Insights and Forecast, 2019-2031
- 10.1. Market Analysis, Insights and Forecast - by Solution
- 10.1.1. Smart Mobility Management
- 10.1.2. Smart Public Safety
- 10.1.3. Smart Healthcare
- 10.1.4. Smart Building
- 10.1.5. Smart Utilities
- 10.1.6. Smart Security
- 10.1.7. Smart Education
- 10.1.8. Other Solutions
- 10.1. Market Analysis, Insights and Forecast - by Solution
- 11. North America Smart Cities Market Analysis, Insights and Forecast, 2019-2031
- 11.1. Market Analysis, Insights and Forecast - By Country/Sub-region
- 11.1.1 United States
- 11.1.2 Canada
- 11.1.3 Mexico
- 12. Europe Smart Cities Market Analysis, Insights and Forecast, 2019-2031
- 12.1. Market Analysis, Insights and Forecast - By Country/Sub-region
- 12.1.1 Germany
- 12.1.2 United Kingdom
- 12.1.3 France
- 12.1.4 Spain
- 12.1.5 Italy
- 12.1.6 Spain
- 12.1.7 Belgium
- 12.1.8 Netherland
- 12.1.9 Nordics
- 12.1.10 Rest of Europe
- 13. Asia Pacific Smart Cities Market Analysis, Insights and Forecast, 2019-2031
- 13.1. Market Analysis, Insights and Forecast - By Country/Sub-region
- 13.1.1 China
- 13.1.2 Japan
- 13.1.3 India
- 13.1.4 South Korea
- 13.1.5 Southeast Asia
- 13.1.6 Australia
- 13.1.7 Indonesia
- 13.1.8 Phillipes
- 13.1.9 Singapore
- 13.1.10 Thailandc
- 13.1.11 Rest of Asia Pacific
- 14. South America Smart Cities Market Analysis, Insights and Forecast, 2019-2031
- 14.1. Market Analysis, Insights and Forecast - By Country/Sub-region
- 14.1.1 Brazil
- 14.1.2 Argentina
- 14.1.3 Peru
- 14.1.4 Chile
- 14.1.5 Colombia
- 14.1.6 Ecuador
- 14.1.7 Venezuela
- 14.1.8 Rest of South America
- 15. North America Smart Cities Market Analysis, Insights and Forecast, 2019-2031
- 15.1. Market Analysis, Insights and Forecast - By Country/Sub-region
- 15.1.1 United States
- 15.1.2 Canada
- 15.1.3 Mexico
- 16. MEA Smart Cities Market Analysis, Insights and Forecast, 2019-2031
- 16.1. Market Analysis, Insights and Forecast - By Country/Sub-region
- 16.1.1 United Arab Emirates
- 16.1.2 Saudi Arabia
- 16.1.3 South Africa
- 16.1.4 Rest of Middle East and Africa
- 17. Competitive Analysis
- 17.1. Global Market Share Analysis 2024
- 17.2. Company Profiles
- 17.2.1 Honeywell International Inc
- 17.2.1.1. Overview
- 17.2.1.2. Products
- 17.2.1.3. SWOT Analysis
- 17.2.1.4. Recent Developments
- 17.2.1.5. Financials (Based on Availability)
- 17.2.2 ABB Ltd
- 17.2.2.1. Overview
- 17.2.2.2. Products
- 17.2.2.3. SWOT Analysis
- 17.2.2.4. Recent Developments
- 17.2.2.5. Financials (Based on Availability)
- 17.2.3 IBM Corporation
- 17.2.3.1. Overview
- 17.2.3.2. Products
- 17.2.3.3. SWOT Analysis
- 17.2.3.4. Recent Developments
- 17.2.3.5. Financials (Based on Availability)
- 17.2.4 Koninklijke Philips N
- 17.2.4.1. Overview
- 17.2.4.2. Products
- 17.2.4.3. SWOT Analysis
- 17.2.4.4. Recent Developments
- 17.2.4.5. Financials (Based on Availability)
- 17.2.5 Hitachi Ltd
- 17.2.5.1. Overview
- 17.2.5.2. Products
- 17.2.5.3. SWOT Analysis
- 17.2.5.4. Recent Developments
- 17.2.5.5. Financials (Based on Availability)
- 17.2.6 Emerson Electric Co
- 17.2.6.1. Overview
- 17.2.6.2. Products
- 17.2.6.3. SWOT Analysis
- 17.2.6.4. Recent Developments
- 17.2.6.5. Financials (Based on Availability)
- 17.2.7 Cisco Systems Inc
- 17.2.7.1. Overview
- 17.2.7.2. Products
- 17.2.7.3. SWOT Analysis
- 17.2.7.4. Recent Developments
- 17.2.7.5. Financials (Based on Availability)
- 17.2.8 Siemens AG
- 17.2.8.1. Overview
- 17.2.8.2. Products
- 17.2.8.3. SWOT Analysis
- 17.2.8.4. Recent Developments
- 17.2.8.5. Financials (Based on Availability)
- 17.2.9 General Electric Co
- 17.2.9.1. Overview
- 17.2.9.2. Products
- 17.2.9.3. SWOT Analysis
- 17.2.9.4. Recent Developments
- 17.2.9.5. Financials (Based on Availability)
- 17.2.10 Schneider Electric SE
- 17.2.10.1. Overview
- 17.2.10.2. Products
- 17.2.10.3. SWOT Analysis
- 17.2.10.4. Recent Developments
- 17.2.10.5. Financials (Based on Availability)
- 17.2.11 Ericsson Inc
- 17.2.11.1. Overview
- 17.2.11.2. Products
- 17.2.11.3. SWOT Analysis
- 17.2.11.4. Recent Developments
- 17.2.11.5. Financials (Based on Availability)
- 17.2.12 Huawei Technologies Co Ltd
- 17.2.12.1. Overview
- 17.2.12.2. Products
- 17.2.12.3. SWOT Analysis
- 17.2.12.4. Recent Developments
- 17.2.12.5. Financials (Based on Availability)
- 17.2.13 Nokia Corporation
- 17.2.13.1. Overview
- 17.2.13.2. Products
- 17.2.13.3. SWOT Analysis
- 17.2.13.4. Recent Developments
- 17.2.13.5. Financials (Based on Availability)
- 17.2.1 Honeywell International Inc
List of Figures
- Figure 1: Global Smart Cities Market Revenue Breakdown (Million, %) by Region 2024 & 2032
- Figure 2: North America Smart Cities Market Revenue (Million), by Country 2024 & 2032
- Figure 3: North America Smart Cities Market Revenue Share (%), by Country 2024 & 2032
- Figure 4: Europe Smart Cities Market Revenue (Million), by Country 2024 & 2032
- Figure 5: Europe Smart Cities Market Revenue Share (%), by Country 2024 & 2032
- Figure 6: Asia Pacific Smart Cities Market Revenue (Million), by Country 2024 & 2032
- Figure 7: Asia Pacific Smart Cities Market Revenue Share (%), by Country 2024 & 2032
- Figure 8: South America Smart Cities Market Revenue (Million), by Country 2024 & 2032
- Figure 9: South America Smart Cities Market Revenue Share (%), by Country 2024 & 2032
- Figure 10: North America Smart Cities Market Revenue (Million), by Country 2024 & 2032
- Figure 11: North America Smart Cities Market Revenue Share (%), by Country 2024 & 2032
- Figure 12: MEA Smart Cities Market Revenue (Million), by Country 2024 & 2032
- Figure 13: MEA Smart Cities Market Revenue Share (%), by Country 2024 & 2032
- Figure 14: North America Smart Cities Market Revenue (Million), by Solution 2024 & 2032
- Figure 15: North America Smart Cities Market Revenue Share (%), by Solution 2024 & 2032
- Figure 16: North America Smart Cities Market Revenue (Million), by Country 2024 & 2032
- Figure 17: North America Smart Cities Market Revenue Share (%), by Country 2024 & 2032
- Figure 18: Europe Smart Cities Market Revenue (Million), by Solution 2024 & 2032
- Figure 19: Europe Smart Cities Market Revenue Share (%), by Solution 2024 & 2032
- Figure 20: Europe Smart Cities Market Revenue (Million), by Country 2024 & 2032
- Figure 21: Europe Smart Cities Market Revenue Share (%), by Country 2024 & 2032
- Figure 22: Asia Pacific Smart Cities Market Revenue (Million), by Solution 2024 & 2032
- Figure 23: Asia Pacific Smart Cities Market Revenue Share (%), by Solution 2024 & 2032
- Figure 24: Asia Pacific Smart Cities Market Revenue (Million), by Country 2024 & 2032
- Figure 25: Asia Pacific Smart Cities Market Revenue Share (%), by Country 2024 & 2032
- Figure 26: Latin America Smart Cities Market Revenue (Million), by Solution 2024 & 2032
- Figure 27: Latin America Smart Cities Market Revenue Share (%), by Solution 2024 & 2032
- Figure 28: Latin America Smart Cities Market Revenue (Million), by Country 2024 & 2032
- Figure 29: Latin America Smart Cities Market Revenue Share (%), by Country 2024 & 2032
- Figure 30: Middle East and Africa Smart Cities Market Revenue (Million), by Solution 2024 & 2032
- Figure 31: Middle East and Africa Smart Cities Market Revenue Share (%), by Solution 2024 & 2032
- Figure 32: Middle East and Africa Smart Cities Market Revenue (Million), by Country 2024 & 2032
- Figure 33: Middle East and Africa Smart Cities Market Revenue Share (%), by Country 2024 & 2032
List of Tables
- Table 1: Global Smart Cities Market Revenue Million Forecast, by Region 2019 & 2032
- Table 2: Global Smart Cities Market Revenue Million Forecast, by Solution 2019 & 2032
- Table 3: Global Smart Cities Market Revenue Million Forecast, by Region 2019 & 2032
- Table 4: Global Smart Cities Market Revenue Million Forecast, by Country 2019 & 2032
- Table 5: United States Smart Cities Market Revenue (Million) Forecast, by Application 2019 & 2032
- Table 6: Canada Smart Cities Market Revenue (Million) Forecast, by Application 2019 & 2032
- Table 7: Mexico Smart Cities Market Revenue (Million) Forecast, by Application 2019 & 2032
- Table 8: Global Smart Cities Market Revenue Million Forecast, by Country 2019 & 2032
- Table 9: Germany Smart Cities Market Revenue (Million) Forecast, by Application 2019 & 2032
- Table 10: United Kingdom Smart Cities Market Revenue (Million) Forecast, by Application 2019 & 2032
- Table 11: France Smart Cities Market Revenue (Million) Forecast, by Application 2019 & 2032
- Table 12: Spain Smart Cities Market Revenue (Million) Forecast, by Application 2019 & 2032
- Table 13: Italy Smart Cities Market Revenue (Million) Forecast, by Application 2019 & 2032
- Table 14: Spain Smart Cities Market Revenue (Million) Forecast, by Application 2019 & 2032
- Table 15: Belgium Smart Cities Market Revenue (Million) Forecast, by Application 2019 & 2032
- Table 16: Netherland Smart Cities Market Revenue (Million) Forecast, by Application 2019 & 2032
- Table 17: Nordics Smart Cities Market Revenue (Million) Forecast, by Application 2019 & 2032
- Table 18: Rest of Europe Smart Cities Market Revenue (Million) Forecast, by Application 2019 & 2032
- Table 19: Global Smart Cities Market Revenue Million Forecast, by Country 2019 & 2032
- Table 20: China Smart Cities Market Revenue (Million) Forecast, by Application 2019 & 2032
- Table 21: Japan Smart Cities Market Revenue (Million) Forecast, by Application 2019 & 2032
- Table 22: India Smart Cities Market Revenue (Million) Forecast, by Application 2019 & 2032
- Table 23: South Korea Smart Cities Market Revenue (Million) Forecast, by Application 2019 & 2032
- Table 24: Southeast Asia Smart Cities Market Revenue (Million) Forecast, by Application 2019 & 2032
- Table 25: Australia Smart Cities Market Revenue (Million) Forecast, by Application 2019 & 2032
- Table 26: Indonesia Smart Cities Market Revenue (Million) Forecast, by Application 2019 & 2032
- Table 27: Phillipes Smart Cities Market Revenue (Million) Forecast, by Application 2019 & 2032
- Table 28: Singapore Smart Cities Market Revenue (Million) Forecast, by Application 2019 & 2032
- Table 29: Thailandc Smart Cities Market Revenue (Million) Forecast, by Application 2019 & 2032
- Table 30: Rest of Asia Pacific Smart Cities Market Revenue (Million) Forecast, by Application 2019 & 2032
- Table 31: Global Smart Cities Market Revenue Million Forecast, by Country 2019 & 2032
- Table 32: Brazil Smart Cities Market Revenue (Million) Forecast, by Application 2019 & 2032
- Table 33: Argentina Smart Cities Market Revenue (Million) Forecast, by Application 2019 & 2032
- Table 34: Peru Smart Cities Market Revenue (Million) Forecast, by Application 2019 & 2032
- Table 35: Chile Smart Cities Market Revenue (Million) Forecast, by Application 2019 & 2032
- Table 36: Colombia Smart Cities Market Revenue (Million) Forecast, by Application 2019 & 2032
- Table 37: Ecuador Smart Cities Market Revenue (Million) Forecast, by Application 2019 & 2032
- Table 38: Venezuela Smart Cities Market Revenue (Million) Forecast, by Application 2019 & 2032
- Table 39: Rest of South America Smart Cities Market Revenue (Million) Forecast, by Application 2019 & 2032
- Table 40: Global Smart Cities Market Revenue Million Forecast, by Country 2019 & 2032
- Table 41: United States Smart Cities Market Revenue (Million) Forecast, by Application 2019 & 2032
- Table 42: Canada Smart Cities Market Revenue (Million) Forecast, by Application 2019 & 2032
- Table 43: Mexico Smart Cities Market Revenue (Million) Forecast, by Application 2019 & 2032
- Table 44: Global Smart Cities Market Revenue Million Forecast, by Country 2019 & 2032
- Table 45: United Arab Emirates Smart Cities Market Revenue (Million) Forecast, by Application 2019 & 2032
- Table 46: Saudi Arabia Smart Cities Market Revenue (Million) Forecast, by Application 2019 & 2032
- Table 47: South Africa Smart Cities Market Revenue (Million) Forecast, by Application 2019 & 2032
- Table 48: Rest of Middle East and Africa Smart Cities Market Revenue (Million) Forecast, by Application 2019 & 2032
- Table 49: Global Smart Cities Market Revenue Million Forecast, by Solution 2019 & 2032
- Table 50: Global Smart Cities Market Revenue Million Forecast, by Country 2019 & 2032
- Table 51: United States Smart Cities Market Revenue (Million) Forecast, by Application 2019 & 2032
- Table 52: Canada Smart Cities Market Revenue (Million) Forecast, by Application 2019 & 2032
- Table 53: Global Smart Cities Market Revenue Million Forecast, by Solution 2019 & 2032
- Table 54: Global Smart Cities Market Revenue Million Forecast, by Country 2019 & 2032
- Table 55: United Kingdom Smart Cities Market Revenue (Million) Forecast, by Application 2019 & 2032
- Table 56: Germany Smart Cities Market Revenue (Million) Forecast, by Application 2019 & 2032
- Table 57: France Smart Cities Market Revenue (Million) Forecast, by Application 2019 & 2032
- Table 58: Sweden Smart Cities Market Revenue (Million) Forecast, by Application 2019 & 2032
- Table 59: Rest of Europe Smart Cities Market Revenue (Million) Forecast, by Application 2019 & 2032
- Table 60: Global Smart Cities Market Revenue Million Forecast, by Solution 2019 & 2032
- Table 61: Global Smart Cities Market Revenue Million Forecast, by Country 2019 & 2032
- Table 62: China Smart Cities Market Revenue (Million) Forecast, by Application 2019 & 2032
- Table 63: Japan Smart Cities Market Revenue (Million) Forecast, by Application 2019 & 2032
- Table 64: India Smart Cities Market Revenue (Million) Forecast, by Application 2019 & 2032
- Table 65: Australia Smart Cities Market Revenue (Million) Forecast, by Application 2019 & 2032
- Table 66: South Korea Smart Cities Market Revenue (Million) Forecast, by Application 2019 & 2032
- Table 67: Rest of Asia Pacific Smart Cities Market Revenue (Million) Forecast, by Application 2019 & 2032
- Table 68: Global Smart Cities Market Revenue Million Forecast, by Solution 2019 & 2032
- Table 69: Global Smart Cities Market Revenue Million Forecast, by Country 2019 & 2032
- Table 70: Mexico Smart Cities Market Revenue (Million) Forecast, by Application 2019 & 2032
- Table 71: Brazil Smart Cities Market Revenue (Million) Forecast, by Application 2019 & 2032
- Table 72: Argentina Smart Cities Market Revenue (Million) Forecast, by Application 2019 & 2032
- Table 73: Rest of Latin America Smart Cities Market Revenue (Million) Forecast, by Application 2019 & 2032
- Table 74: Global Smart Cities Market Revenue Million Forecast, by Solution 2019 & 2032
- Table 75: Global Smart Cities Market Revenue Million Forecast, by Country 2019 & 2032
- Table 76: Saudi Arabia Smart Cities Market Revenue (Million) Forecast, by Application 2019 & 2032
- Table 77: United Arab Emirates Smart Cities Market Revenue (Million) Forecast, by Application 2019 & 2032
- Table 78: South Africa Smart Cities Market Revenue (Million) Forecast, by Application 2019 & 2032
- Table 79: Rest of Middle East and Africa Smart Cities Market Revenue (Million) Forecast, by Application 2019 & 2032
Frequently Asked Questions
1. What is the projected Compound Annual Growth Rate (CAGR) of the Smart Cities Market?
The projected CAGR is approximately 23.21%.
2. Which companies are prominent players in the Smart Cities Market?
Key companies in the market include Honeywell International Inc, ABB Ltd, IBM Corporation, Koninklijke Philips N, Hitachi Ltd, Emerson Electric Co, Cisco Systems Inc, Siemens AG, General Electric Co, Schneider Electric SE, Ericsson Inc, Huawei Technologies Co Ltd, Nokia Corporation.
3. What are the main segments of the Smart Cities Market?
The market segments include Solution.
4. Can you provide details about the market size?
The market size is estimated to be USD 1.36 Million as of 2022.
5. What are some drivers contributing to market growth?
Rising Adoption of AI and IoT; Growth in the need for public safety and security.
6. What are the notable trends driving market growth?
Adoption of AI and IoT to be Major Drivers for the Market.
7. Are there any restraints impacting market growth?
The high cost of safety connection devices; Lack of awareness about its developments in the industry.
8. Can you provide examples of recent developments in the market?
June 2023: TIM, a telecom operator, and Ericsson announced an increase in their investments in private networks and IoT projects in Brazil. TIM has announced various new projects, particularly in smart cities/public lighting. In the previous month, the company announced a smart lighting project in Porto Alegre, Rio Grande do Sul state, using 4G NB-IoT technology for IPSul, the concessionaire responsible for public lighting in the city.
9. What pricing options are available for accessing the report?
Pricing options include single-user, multi-user, and enterprise licenses priced at USD 4750, USD 5250, and USD 8750 respectively.
10. Is the market size provided in terms of value or volume?
The market size is provided in terms of value, measured in Million.
11. Are there any specific market keywords associated with the report?
Yes, the market keyword associated with the report is "Smart Cities Market," which aids in identifying and referencing the specific market segment covered.
12. How do I determine which pricing option suits my needs best?
The pricing options vary based on user requirements and access needs. Individual users may opt for single-user licenses, while businesses requiring broader access may choose multi-user or enterprise licenses for cost-effective access to the report.
13. Are there any additional resources or data provided in the Smart Cities Market report?
While the report offers comprehensive insights, it's advisable to review the specific contents or supplementary materials provided to ascertain if additional resources or data are available.
14. How can I stay updated on further developments or reports in the Smart Cities Market?
To stay informed about further developments, trends, and reports in the Smart Cities Market, consider subscribing to industry newsletters, following relevant companies and organizations, or regularly checking reputable industry news sources and publications.
Methodology
Step 1 - Identification of Relevant Samples Size from Population Database


Step 2 - Approaches for Defining Global Market Size (Value, Volume* & Price*)

Note*: In applicable scenarios
Step 3 - Data Sources
Primary Research
- Web Analytics
- Survey Reports
- Research Institute
- Latest Research Reports
- Opinion Leaders
Secondary Research
- Annual Reports
- White Paper
- Latest Press Release
- Industry Association
- Paid Database
- Investor Presentations

Step 4 - Data Triangulation
Involves using different sources of information in order to increase the validity of a study
These sources are likely to be stakeholders in a program - participants, other researchers, program staff, other community members, and so on.
Then we put all data in single framework & apply various statistical tools to find out the dynamic on the market.
During the analysis stage, feedback from the stakeholder groups would be compared to determine areas of agreement as well as areas of divergence


