
Key Insights
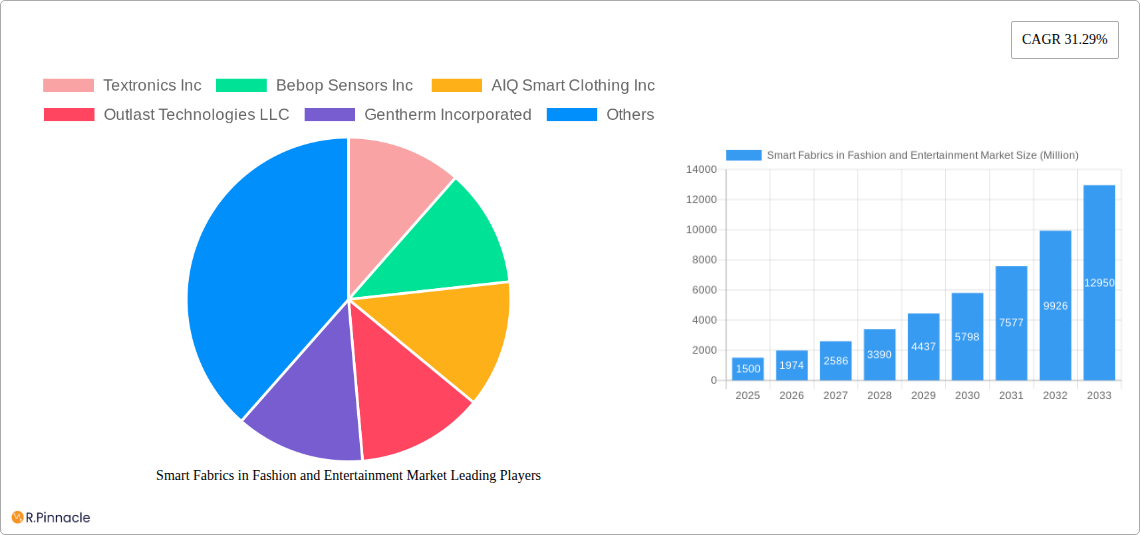
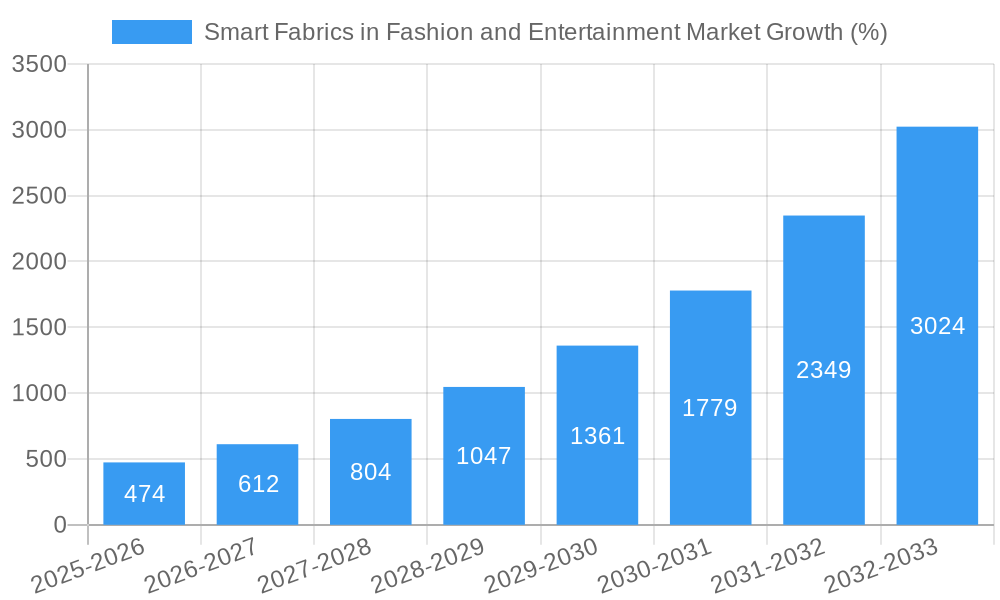
The Smart Fabrics in Fashion and Entertainment market is experiencing robust growth, projected to reach a substantial market size with a Compound Annual Growth Rate (CAGR) of 31.29% from 2025 to 2033. This expansion is fueled by several key drivers. The increasing demand for technologically advanced, comfortable, and functional apparel is a major catalyst. Consumers are increasingly drawn to garments incorporating features like integrated sensors for health monitoring, temperature regulation, and interactive experiences. Furthermore, the fashion industry's ongoing pursuit of innovation and sustainability is driving the adoption of smart fabrics. The development of new materials with enhanced properties, such as color-changing, light-emitting, and temperature-regulating capabilities, is broadening the applications of smart textiles in various fashion segments, from sportswear to high-end designer clothing. The entertainment industry is also embracing smart fabrics for creating interactive costumes, stage props, and immersive experiences, further boosting market growth.
However, challenges remain. High production costs associated with incorporating sophisticated technologies into fabrics are a significant restraint, limiting widespread adoption. Concerns regarding the durability and washability of smart fabrics, as well as potential health and environmental implications of the embedded technologies, need to be addressed. Nevertheless, ongoing technological advancements, coupled with increasing consumer awareness and acceptance, are poised to overcome these challenges. The market segmentation by product type (Passive, Active, Ultra Smart Textiles) and material (Color Changing, Light Emitting, Temperature Changing, Other) highlights the diverse applications and evolving nature of this dynamic sector. Geographical analysis reveals strong market presence across North America, Europe, and the Asia-Pacific region, with potential for significant growth in emerging markets. The continued innovation in material science and miniaturization of electronics within textiles are key factors that will shape the future trajectory of the Smart Fabrics market.
Smart Fabrics in Fashion and Entertainment Market: A Comprehensive Report (2019-2033)
This report provides a detailed analysis of the global Smart Fabrics in Fashion and Entertainment Market, offering invaluable insights for industry professionals, investors, and strategists. With a study period spanning 2019-2033, a base year of 2025, and a forecast period of 2025-2033, this report offers a comprehensive overview of market size, growth drivers, challenges, and future opportunities. The market is segmented by product type (Passive Smart Textiles, Active Smart Textiles, Ultra Smart Textiles) and material (Color Changing, Light Emitting, Temperature Changing, Other Materials). The report projects a market value of xx Million by 2033, with a CAGR of xx% during the forecast period.
Smart Fabrics in Fashion and Entertainment Market Structure & Innovation Trends
The Smart Fabrics market exhibits a moderately fragmented structure, with several key players vying for market share. While a few large companies dominate certain segments, numerous smaller, specialized firms contribute significantly to innovation. Market concentration is relatively low, fostering a dynamic competitive landscape.
Key Metrics & Observations:
- Market Share: Textronics Inc. holds an estimated xx% market share in 2025, followed by Gentherm Incorporated with xx%. Smaller players, including Bebop Sensors Inc and AIQ Smart Clothing Inc, account for the remaining share.
- Innovation Drivers: The increasing demand for wearable technology, advancements in material science, and the growing integration of smart textiles into apparel and entertainment create key drivers for innovation.
- Regulatory Frameworks: Government regulations regarding data privacy, product safety, and sustainability are shaping industry practices and influencing product development.
- Product Substitutes: Traditional fabrics and less sophisticated smart materials present competition, but the unique functionalities of advanced smart fabrics are driving market expansion.
- End-User Demographics: The primary end-users are fashion-conscious individuals, athletes, and entertainment companies seeking interactive experiences. Growth is significant among younger demographics.
- M&A Activities: In recent years, the market has witnessed several strategic mergers and acquisitions, valued at an estimated xx Million. These transactions reflect companies' efforts to expand their product portfolios and market reach. An example is Pyratex’s fundraising in 2022.
Smart Fabrics in Fashion and Entertainment Market Market Dynamics & Trends
The Smart Fabrics market is experiencing robust growth, propelled by several key factors. The increasing adoption of wearable technology, particularly in the fashion and entertainment industries, is a primary driver. Technological advancements in sensor technology, miniaturization, and energy efficiency are further enhancing the appeal of smart fabrics. Consumer preferences are shifting toward functional and stylish apparel integrated with smart functionalities. The rise of personalized experiences and interactive entertainment is further accelerating market demand.
Key Metrics & Observations:
- CAGR: The market is projected to grow at a CAGR of xx% from 2025 to 2033.
- Market Penetration: Market penetration is increasing rapidly, particularly in developed regions. By 2033, xx% of the target consumer base is expected to adopt smart fabrics.
- Competitive Dynamics: Intense competition exists among established players and emerging startups, driving innovation and price competition. The rapid pace of technological advancements ensures a dynamic market.
Dominant Regions & Segments in Smart Fabrics in Fashion and Entertainment Market
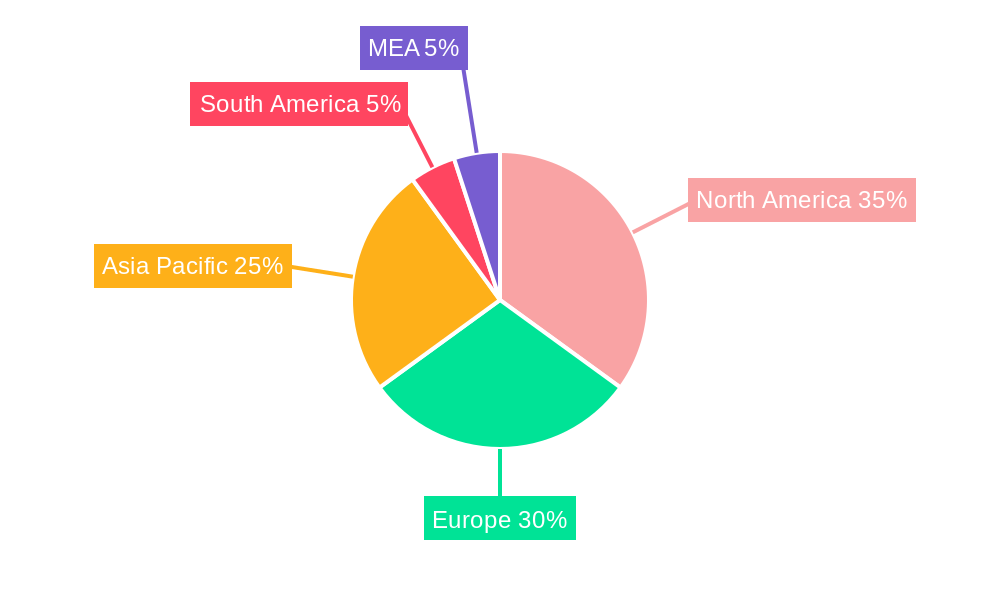
North America currently holds the leading position in the Smart Fabrics market, driven by strong demand from the fashion and entertainment sectors and the presence of key industry players. Europe and Asia Pacific are also experiencing substantial growth.
Leading Regions & Segments:
- North America: High disposable income and technological advancements fuel market growth.
- Europe: Growing interest in sustainable fashion and technological innovation contribute to the region's expansion.
- Asia Pacific: Rapid urbanization, rising disposable incomes, and a burgeoning fashion industry stimulate market growth.
Dominant Segments:
- Type of Product: Active Smart Textiles are currently the largest segment, driven by demand for functional apparel and interactive entertainment. Ultra-Smart Textiles are growing rapidly, showcasing high potential in future years.
- Material: Light-Emitting fabrics are increasingly popular in the entertainment industry due to their aesthetic appeal and creative applications. Color-changing fabrics are also gaining traction in the fashion sector.
Key Drivers:
- Economic Policies: Government incentives for innovation and technological advancements support market growth.
- Infrastructure: Robust technological infrastructure facilitates the adoption of smart fabric technology.
Smart Fabrics in Fashion and Entertainment Market Product Innovations
Recent product developments highlight the integration of advanced sensors, microprocessors, and energy harvesting technologies into fabrics. Innovations include improved breathability, enhanced comfort, and new functionalities such as health monitoring, gesture recognition, and haptic feedback. These innovations are expanding applications across fashion, entertainment, healthcare, and other sectors. The integration of AI and Machine Learning opens up new avenues for personalized experiences and data-driven functionalities.
Report Scope & Segmentation Analysis
This report comprehensively segments the Smart Fabrics market by product type (Passive Smart Textiles, Active Smart Textiles, and Ultra Smart Textiles) and material type (Color Changing, Light Emitting, Temperature Changing, and Other Materials). Each segment is analyzed based on its market size, growth projections, and competitive dynamics. Detailed insights into market share, revenue projections, and key trends are presented for each segment, providing a detailed understanding of its growth trajectory. The report also analyzes growth projections for each segment, projecting xx Million for Passive Smart Textiles, xx Million for Active Smart Textiles, and xx Million for Ultra Smart Textiles by 2033.
Key Drivers of Smart Fabrics in Fashion and Entertainment Market Growth
Several factors contribute to the growth of the Smart Fabrics market:
- Technological Advancements: Miniaturization of electronics, improved sensor technology, and development of energy-efficient power sources are driving innovation.
- Growing Demand for Wearable Technology: The increasing popularity of wearables is fuelling demand for integrated smart fabrics.
- Government Support: Government initiatives promoting technological advancement and sustainable fashion are supporting market growth.
Challenges in the Smart Fabrics in Fashion and Entertainment Market Sector
The Smart Fabrics market faces several challenges:
- High Production Costs: The complexity of manufacturing smart fabrics leads to higher production costs compared to traditional textiles.
- Limited Durability: Some smart fabrics have limited durability and may not withstand frequent washing or harsh conditions.
- Data Privacy Concerns: The collection and use of personal data through smart fabrics raise privacy concerns.
Emerging Opportunities in Smart Fabrics in Fashion and Entertainment Market
The Smart Fabrics market presents several emerging opportunities:
- Expansion into New Applications: Smart fabrics are finding applications beyond fashion and entertainment, including healthcare, sports, and industrial sectors.
- Development of Sustainable Materials: Increased focus on eco-friendly and sustainable smart fabrics will drive market growth.
- Integration with AI and IoT: Integrating smart fabrics with AI and IoT enhances functionalities and opens up new possibilities for personalization and data analysis.
Leading Players in the Smart Fabrics in Fashion and Entertainment Market Market
- Textronics Inc
- Bebop Sensors Inc
- AIQ Smart Clothing Inc
- Outlast Technologies LLC
- Gentherm Incorporated
- Intelligent Textiles Limited
- Schoeller Technologies AG
- Sensoria Inc
- Clothing Plus Ltd
- Interactive Wear AG
- E L Du Pont De Nemours and Company
Key Developments in Smart Fabrics in Fashion and Entertainment Market Industry
- July 2022: Microsoft developed a smart fabric that detects objects and gestures, showcasing significant advancements in sensor technology and data processing.
- January 2022: Pyratex secured USD 680,086 in funding, indicating investor confidence in the market and its growth potential.
Future Outlook for Smart Fabrics in Fashion and Entertainment Market Market
The future of the Smart Fabrics market is bright, with significant growth potential driven by technological innovation, increasing consumer demand, and expansion into new applications. Strategic partnerships, collaborations, and investments in R&D will further accelerate market growth. The integration of advanced technologies like AI and IoT will create new opportunities for personalized experiences and data-driven functionalities, shaping the future of fashion and entertainment.
Smart Fabrics in Fashion and Entertainment Market Segmentation
-
1. Type of Product
- 1.1. Passive Smart Textiles
- 1.2. Active Smart Textiles
- 1.3. Ultra Smart Textiles
-
2. Material
- 2.1. Color Changing
- 2.2. Light Emitting
- 2.3. Temperature Changing
- 2.4. Other Materials
-
3. Application
- 3.1. Fashion
- 3.2. Entertainment
- 3.3. Healthcare
- 3.4. Military and Defense
- 3.5. Automotive
Smart Fabrics in Fashion and Entertainment Market Segmentation By Geography
- 1. North America
- 2. Europe
- 3. Asia Pacific
- 4. Latin America
- 5. Middle East and Africa
Smart Fabrics in Fashion and Entertainment Market REPORT HIGHLIGHTS
| Aspects | Details |
|---|---|
| Study Period | 2019-2033 |
| Base Year | 2024 |
| Estimated Year | 2025 |
| Forecast Period | 2025-2033 |
| Historical Period | 2019-2024 |
| Growth Rate | CAGR of 31.29% from 2019-2033 |
| Segmentation |
|
Table of Contents
- 1. Introduction
- 1.1. Research Scope
- 1.2. Market Segmentation
- 1.3. Research Methodology
- 1.4. Definitions and Assumptions
- 2. Executive Summary
- 2.1. Introduction
- 3. Market Dynamics
- 3.1. Introduction
- 3.2. Market Drivers
- 3.2.1. Miniaturization of Electronic Components Influencing the Growth of the Market; Increasing Use of Wearable Electronics; Rapid Growth of Low-cost Smart Wireless Sensor Networks
- 3.3. Market Restrains
- 3.3.1. Very High Implementation Costs
- 3.4. Market Trends
- 3.4.1. Adoption of Wearable Devices to Drive the Market's Growth
- 4. Market Factor Analysis
- 4.1. Porters Five Forces
- 4.2. Supply/Value Chain
- 4.3. PESTEL analysis
- 4.4. Market Entropy
- 4.5. Patent/Trademark Analysis
- 5. Global Smart Fabrics in Fashion and Entertainment Market Analysis, Insights and Forecast, 2019-2031
- 5.1. Market Analysis, Insights and Forecast - by Type of Product
- 5.1.1. Passive Smart Textiles
- 5.1.2. Active Smart Textiles
- 5.1.3. Ultra Smart Textiles
- 5.2. Market Analysis, Insights and Forecast - by Material
- 5.2.1. Color Changing
- 5.2.2. Light Emitting
- 5.2.3. Temperature Changing
- 5.2.4. Other Materials
- 5.3. Market Analysis, Insights and Forecast - by Application
- 5.3.1. Fashion
- 5.3.2. Entertainment
- 5.3.3. Healthcare
- 5.3.4. Military and Defense
- 5.3.5. Automotive
- 5.4. Market Analysis, Insights and Forecast - by Region
- 5.4.1. North America
- 5.4.2. Europe
- 5.4.3. Asia Pacific
- 5.4.4. Latin America
- 5.4.5. Middle East and Africa
- 5.1. Market Analysis, Insights and Forecast - by Type of Product
- 6. North America Smart Fabrics in Fashion and Entertainment Market Analysis, Insights and Forecast, 2019-2031
- 6.1. Market Analysis, Insights and Forecast - by Type of Product
- 6.1.1. Passive Smart Textiles
- 6.1.2. Active Smart Textiles
- 6.1.3. Ultra Smart Textiles
- 6.2. Market Analysis, Insights and Forecast - by Material
- 6.2.1. Color Changing
- 6.2.2. Light Emitting
- 6.2.3. Temperature Changing
- 6.2.4. Other Materials
- 6.3. Market Analysis, Insights and Forecast - by Application
- 6.3.1. Fashion
- 6.3.2. Entertainment
- 6.3.3. Healthcare
- 6.3.4. Military and Defense
- 6.3.5. Automotive
- 6.1. Market Analysis, Insights and Forecast - by Type of Product
- 7. Europe Smart Fabrics in Fashion and Entertainment Market Analysis, Insights and Forecast, 2019-2031
- 7.1. Market Analysis, Insights and Forecast - by Type of Product
- 7.1.1. Passive Smart Textiles
- 7.1.2. Active Smart Textiles
- 7.1.3. Ultra Smart Textiles
- 7.2. Market Analysis, Insights and Forecast - by Material
- 7.2.1. Color Changing
- 7.2.2. Light Emitting
- 7.2.3. Temperature Changing
- 7.2.4. Other Materials
- 7.3. Market Analysis, Insights and Forecast - by Application
- 7.3.1. Fashion
- 7.3.2. Entertainment
- 7.3.3. Healthcare
- 7.3.4. Military and Defense
- 7.3.5. Automotive
- 7.1. Market Analysis, Insights and Forecast - by Type of Product
- 8. Asia Pacific Smart Fabrics in Fashion and Entertainment Market Analysis, Insights and Forecast, 2019-2031
- 8.1. Market Analysis, Insights and Forecast - by Type of Product
- 8.1.1. Passive Smart Textiles
- 8.1.2. Active Smart Textiles
- 8.1.3. Ultra Smart Textiles
- 8.2. Market Analysis, Insights and Forecast - by Material
- 8.2.1. Color Changing
- 8.2.2. Light Emitting
- 8.2.3. Temperature Changing
- 8.2.4. Other Materials
- 8.3. Market Analysis, Insights and Forecast - by Application
- 8.3.1. Fashion
- 8.3.2. Entertainment
- 8.3.3. Healthcare
- 8.3.4. Military and Defense
- 8.3.5. Automotive
- 8.1. Market Analysis, Insights and Forecast - by Type of Product
- 9. Latin America Smart Fabrics in Fashion and Entertainment Market Analysis, Insights and Forecast, 2019-2031
- 9.1. Market Analysis, Insights and Forecast - by Type of Product
- 9.1.1. Passive Smart Textiles
- 9.1.2. Active Smart Textiles
- 9.1.3. Ultra Smart Textiles
- 9.2. Market Analysis, Insights and Forecast - by Material
- 9.2.1. Color Changing
- 9.2.2. Light Emitting
- 9.2.3. Temperature Changing
- 9.2.4. Other Materials
- 9.3. Market Analysis, Insights and Forecast - by Application
- 9.3.1. Fashion
- 9.3.2. Entertainment
- 9.3.3. Healthcare
- 9.3.4. Military and Defense
- 9.3.5. Automotive
- 9.1. Market Analysis, Insights and Forecast - by Type of Product
- 10. Middle East and Africa Smart Fabrics in Fashion and Entertainment Market Analysis, Insights and Forecast, 2019-2031
- 10.1. Market Analysis, Insights and Forecast - by Type of Product
- 10.1.1. Passive Smart Textiles
- 10.1.2. Active Smart Textiles
- 10.1.3. Ultra Smart Textiles
- 10.2. Market Analysis, Insights and Forecast - by Material
- 10.2.1. Color Changing
- 10.2.2. Light Emitting
- 10.2.3. Temperature Changing
- 10.2.4. Other Materials
- 10.3. Market Analysis, Insights and Forecast - by Application
- 10.3.1. Fashion
- 10.3.2. Entertainment
- 10.3.3. Healthcare
- 10.3.4. Military and Defense
- 10.3.5. Automotive
- 10.1. Market Analysis, Insights and Forecast - by Type of Product
- 11. North America Smart Fabrics in Fashion and Entertainment Market Analysis, Insights and Forecast, 2019-2031
- 11.1. Market Analysis, Insights and Forecast - By Country/Sub-region
- 11.1.1 United States
- 11.1.2 Canada
- 11.1.3 Mexico
- 12. Europe Smart Fabrics in Fashion and Entertainment Market Analysis, Insights and Forecast, 2019-2031
- 12.1. Market Analysis, Insights and Forecast - By Country/Sub-region
- 12.1.1 Germany
- 12.1.2 United Kingdom
- 12.1.3 France
- 12.1.4 Spain
- 12.1.5 Italy
- 12.1.6 Spain
- 12.1.7 Belgium
- 12.1.8 Netherland
- 12.1.9 Nordics
- 12.1.10 Rest of Europe
- 13. Asia Pacific Smart Fabrics in Fashion and Entertainment Market Analysis, Insights and Forecast, 2019-2031
- 13.1. Market Analysis, Insights and Forecast - By Country/Sub-region
- 13.1.1 China
- 13.1.2 Japan
- 13.1.3 India
- 13.1.4 South Korea
- 13.1.5 Southeast Asia
- 13.1.6 Australia
- 13.1.7 Indonesia
- 13.1.8 Phillipes
- 13.1.9 Singapore
- 13.1.10 Thailandc
- 13.1.11 Rest of Asia Pacific
- 14. South America Smart Fabrics in Fashion and Entertainment Market Analysis, Insights and Forecast, 2019-2031
- 14.1. Market Analysis, Insights and Forecast - By Country/Sub-region
- 14.1.1 Brazil
- 14.1.2 Argentina
- 14.1.3 Peru
- 14.1.4 Chile
- 14.1.5 Colombia
- 14.1.6 Ecuador
- 14.1.7 Venezuela
- 14.1.8 Rest of South America
- 15. North America Smart Fabrics in Fashion and Entertainment Market Analysis, Insights and Forecast, 2019-2031
- 15.1. Market Analysis, Insights and Forecast - By Country/Sub-region
- 15.1.1 United States
- 15.1.2 Canada
- 15.1.3 Mexico
- 16. MEA Smart Fabrics in Fashion and Entertainment Market Analysis, Insights and Forecast, 2019-2031
- 16.1. Market Analysis, Insights and Forecast - By Country/Sub-region
- 16.1.1 United Arab Emirates
- 16.1.2 Saudi Arabia
- 16.1.3 South Africa
- 16.1.4 Rest of Middle East and Africa
- 17. Competitive Analysis
- 17.1. Global Market Share Analysis 2024
- 17.2. Company Profiles
- 17.2.1 Textronics Inc
- 17.2.1.1. Overview
- 17.2.1.2. Products
- 17.2.1.3. SWOT Analysis
- 17.2.1.4. Recent Developments
- 17.2.1.5. Financials (Based on Availability)
- 17.2.2 Bebop Sensors Inc
- 17.2.2.1. Overview
- 17.2.2.2. Products
- 17.2.2.3. SWOT Analysis
- 17.2.2.4. Recent Developments
- 17.2.2.5. Financials (Based on Availability)
- 17.2.3 AIQ Smart Clothing Inc
- 17.2.3.1. Overview
- 17.2.3.2. Products
- 17.2.3.3. SWOT Analysis
- 17.2.3.4. Recent Developments
- 17.2.3.5. Financials (Based on Availability)
- 17.2.4 Outlast Technologies LLC
- 17.2.4.1. Overview
- 17.2.4.2. Products
- 17.2.4.3. SWOT Analysis
- 17.2.4.4. Recent Developments
- 17.2.4.5. Financials (Based on Availability)
- 17.2.5 Gentherm Incorporated
- 17.2.5.1. Overview
- 17.2.5.2. Products
- 17.2.5.3. SWOT Analysis
- 17.2.5.4. Recent Developments
- 17.2.5.5. Financials (Based on Availability)
- 17.2.6 Intelligent Textiles Limited
- 17.2.6.1. Overview
- 17.2.6.2. Products
- 17.2.6.3. SWOT Analysis
- 17.2.6.4. Recent Developments
- 17.2.6.5. Financials (Based on Availability)
- 17.2.7 Schoeller Technologies AG
- 17.2.7.1. Overview
- 17.2.7.2. Products
- 17.2.7.3. SWOT Analysis
- 17.2.7.4. Recent Developments
- 17.2.7.5. Financials (Based on Availability)
- 17.2.8 Sensoria Inc
- 17.2.8.1. Overview
- 17.2.8.2. Products
- 17.2.8.3. SWOT Analysis
- 17.2.8.4. Recent Developments
- 17.2.8.5. Financials (Based on Availability)
- 17.2.9 Clothing Plus Ltd
- 17.2.9.1. Overview
- 17.2.9.2. Products
- 17.2.9.3. SWOT Analysis
- 17.2.9.4. Recent Developments
- 17.2.9.5. Financials (Based on Availability)
- 17.2.10 Interactive Wear AG
- 17.2.10.1. Overview
- 17.2.10.2. Products
- 17.2.10.3. SWOT Analysis
- 17.2.10.4. Recent Developments
- 17.2.10.5. Financials (Based on Availability)
- 17.2.11 E L Du Pont De Nemours and Company
- 17.2.11.1. Overview
- 17.2.11.2. Products
- 17.2.11.3. SWOT Analysis
- 17.2.11.4. Recent Developments
- 17.2.11.5. Financials (Based on Availability)
- 17.2.1 Textronics Inc
List of Figures
- Figure 1: Global Smart Fabrics in Fashion and Entertainment Market Revenue Breakdown (Million, %) by Region 2024 & 2032
- Figure 2: Global Smart Fabrics in Fashion and Entertainment Market Volume Breakdown (K Unit, %) by Region 2024 & 2032
- Figure 3: North America Smart Fabrics in Fashion and Entertainment Market Revenue (Million), by Country 2024 & 2032
- Figure 4: North America Smart Fabrics in Fashion and Entertainment Market Volume (K Unit), by Country 2024 & 2032
- Figure 5: North America Smart Fabrics in Fashion and Entertainment Market Revenue Share (%), by Country 2024 & 2032
- Figure 6: North America Smart Fabrics in Fashion and Entertainment Market Volume Share (%), by Country 2024 & 2032
- Figure 7: Europe Smart Fabrics in Fashion and Entertainment Market Revenue (Million), by Country 2024 & 2032
- Figure 8: Europe Smart Fabrics in Fashion and Entertainment Market Volume (K Unit), by Country 2024 & 2032
- Figure 9: Europe Smart Fabrics in Fashion and Entertainment Market Revenue Share (%), by Country 2024 & 2032
- Figure 10: Europe Smart Fabrics in Fashion and Entertainment Market Volume Share (%), by Country 2024 & 2032
- Figure 11: Asia Pacific Smart Fabrics in Fashion and Entertainment Market Revenue (Million), by Country 2024 & 2032
- Figure 12: Asia Pacific Smart Fabrics in Fashion and Entertainment Market Volume (K Unit), by Country 2024 & 2032
- Figure 13: Asia Pacific Smart Fabrics in Fashion and Entertainment Market Revenue Share (%), by Country 2024 & 2032
- Figure 14: Asia Pacific Smart Fabrics in Fashion and Entertainment Market Volume Share (%), by Country 2024 & 2032
- Figure 15: South America Smart Fabrics in Fashion and Entertainment Market Revenue (Million), by Country 2024 & 2032
- Figure 16: South America Smart Fabrics in Fashion and Entertainment Market Volume (K Unit), by Country 2024 & 2032
- Figure 17: South America Smart Fabrics in Fashion and Entertainment Market Revenue Share (%), by Country 2024 & 2032
- Figure 18: South America Smart Fabrics in Fashion and Entertainment Market Volume Share (%), by Country 2024 & 2032
- Figure 19: North America Smart Fabrics in Fashion and Entertainment Market Revenue (Million), by Country 2024 & 2032
- Figure 20: North America Smart Fabrics in Fashion and Entertainment Market Volume (K Unit), by Country 2024 & 2032
- Figure 21: North America Smart Fabrics in Fashion and Entertainment Market Revenue Share (%), by Country 2024 & 2032
- Figure 22: North America Smart Fabrics in Fashion and Entertainment Market Volume Share (%), by Country 2024 & 2032
- Figure 23: MEA Smart Fabrics in Fashion and Entertainment Market Revenue (Million), by Country 2024 & 2032
- Figure 24: MEA Smart Fabrics in Fashion and Entertainment Market Volume (K Unit), by Country 2024 & 2032
- Figure 25: MEA Smart Fabrics in Fashion and Entertainment Market Revenue Share (%), by Country 2024 & 2032
- Figure 26: MEA Smart Fabrics in Fashion and Entertainment Market Volume Share (%), by Country 2024 & 2032
- Figure 27: North America Smart Fabrics in Fashion and Entertainment Market Revenue (Million), by Type of Product 2024 & 2032
- Figure 28: North America Smart Fabrics in Fashion and Entertainment Market Volume (K Unit), by Type of Product 2024 & 2032
- Figure 29: North America Smart Fabrics in Fashion and Entertainment Market Revenue Share (%), by Type of Product 2024 & 2032
- Figure 30: North America Smart Fabrics in Fashion and Entertainment Market Volume Share (%), by Type of Product 2024 & 2032
- Figure 31: North America Smart Fabrics in Fashion and Entertainment Market Revenue (Million), by Material 2024 & 2032
- Figure 32: North America Smart Fabrics in Fashion and Entertainment Market Volume (K Unit), by Material 2024 & 2032
- Figure 33: North America Smart Fabrics in Fashion and Entertainment Market Revenue Share (%), by Material 2024 & 2032
- Figure 34: North America Smart Fabrics in Fashion and Entertainment Market Volume Share (%), by Material 2024 & 2032
- Figure 35: North America Smart Fabrics in Fashion and Entertainment Market Revenue (Million), by Application 2024 & 2032
- Figure 36: North America Smart Fabrics in Fashion and Entertainment Market Volume (K Unit), by Application 2024 & 2032
- Figure 37: North America Smart Fabrics in Fashion and Entertainment Market Revenue Share (%), by Application 2024 & 2032
- Figure 38: North America Smart Fabrics in Fashion and Entertainment Market Volume Share (%), by Application 2024 & 2032
- Figure 39: North America Smart Fabrics in Fashion and Entertainment Market Revenue (Million), by Country 2024 & 2032
- Figure 40: North America Smart Fabrics in Fashion and Entertainment Market Volume (K Unit), by Country 2024 & 2032
- Figure 41: North America Smart Fabrics in Fashion and Entertainment Market Revenue Share (%), by Country 2024 & 2032
- Figure 42: North America Smart Fabrics in Fashion and Entertainment Market Volume Share (%), by Country 2024 & 2032
- Figure 43: Europe Smart Fabrics in Fashion and Entertainment Market Revenue (Million), by Type of Product 2024 & 2032
- Figure 44: Europe Smart Fabrics in Fashion and Entertainment Market Volume (K Unit), by Type of Product 2024 & 2032
- Figure 45: Europe Smart Fabrics in Fashion and Entertainment Market Revenue Share (%), by Type of Product 2024 & 2032
- Figure 46: Europe Smart Fabrics in Fashion and Entertainment Market Volume Share (%), by Type of Product 2024 & 2032
- Figure 47: Europe Smart Fabrics in Fashion and Entertainment Market Revenue (Million), by Material 2024 & 2032
- Figure 48: Europe Smart Fabrics in Fashion and Entertainment Market Volume (K Unit), by Material 2024 & 2032
- Figure 49: Europe Smart Fabrics in Fashion and Entertainment Market Revenue Share (%), by Material 2024 & 2032
- Figure 50: Europe Smart Fabrics in Fashion and Entertainment Market Volume Share (%), by Material 2024 & 2032
- Figure 51: Europe Smart Fabrics in Fashion and Entertainment Market Revenue (Million), by Application 2024 & 2032
- Figure 52: Europe Smart Fabrics in Fashion and Entertainment Market Volume (K Unit), by Application 2024 & 2032
- Figure 53: Europe Smart Fabrics in Fashion and Entertainment Market Revenue Share (%), by Application 2024 & 2032
- Figure 54: Europe Smart Fabrics in Fashion and Entertainment Market Volume Share (%), by Application 2024 & 2032
- Figure 55: Europe Smart Fabrics in Fashion and Entertainment Market Revenue (Million), by Country 2024 & 2032
- Figure 56: Europe Smart Fabrics in Fashion and Entertainment Market Volume (K Unit), by Country 2024 & 2032
- Figure 57: Europe Smart Fabrics in Fashion and Entertainment Market Revenue Share (%), by Country 2024 & 2032
- Figure 58: Europe Smart Fabrics in Fashion and Entertainment Market Volume Share (%), by Country 2024 & 2032
- Figure 59: Asia Pacific Smart Fabrics in Fashion and Entertainment Market Revenue (Million), by Type of Product 2024 & 2032
- Figure 60: Asia Pacific Smart Fabrics in Fashion and Entertainment Market Volume (K Unit), by Type of Product 2024 & 2032
- Figure 61: Asia Pacific Smart Fabrics in Fashion and Entertainment Market Revenue Share (%), by Type of Product 2024 & 2032
- Figure 62: Asia Pacific Smart Fabrics in Fashion and Entertainment Market Volume Share (%), by Type of Product 2024 & 2032
- Figure 63: Asia Pacific Smart Fabrics in Fashion and Entertainment Market Revenue (Million), by Material 2024 & 2032
- Figure 64: Asia Pacific Smart Fabrics in Fashion and Entertainment Market Volume (K Unit), by Material 2024 & 2032
- Figure 65: Asia Pacific Smart Fabrics in Fashion and Entertainment Market Revenue Share (%), by Material 2024 & 2032
- Figure 66: Asia Pacific Smart Fabrics in Fashion and Entertainment Market Volume Share (%), by Material 2024 & 2032
- Figure 67: Asia Pacific Smart Fabrics in Fashion and Entertainment Market Revenue (Million), by Application 2024 & 2032
- Figure 68: Asia Pacific Smart Fabrics in Fashion and Entertainment Market Volume (K Unit), by Application 2024 & 2032
- Figure 69: Asia Pacific Smart Fabrics in Fashion and Entertainment Market Revenue Share (%), by Application 2024 & 2032
- Figure 70: Asia Pacific Smart Fabrics in Fashion and Entertainment Market Volume Share (%), by Application 2024 & 2032
- Figure 71: Asia Pacific Smart Fabrics in Fashion and Entertainment Market Revenue (Million), by Country 2024 & 2032
- Figure 72: Asia Pacific Smart Fabrics in Fashion and Entertainment Market Volume (K Unit), by Country 2024 & 2032
- Figure 73: Asia Pacific Smart Fabrics in Fashion and Entertainment Market Revenue Share (%), by Country 2024 & 2032
- Figure 74: Asia Pacific Smart Fabrics in Fashion and Entertainment Market Volume Share (%), by Country 2024 & 2032
- Figure 75: Latin America Smart Fabrics in Fashion and Entertainment Market Revenue (Million), by Type of Product 2024 & 2032
- Figure 76: Latin America Smart Fabrics in Fashion and Entertainment Market Volume (K Unit), by Type of Product 2024 & 2032
- Figure 77: Latin America Smart Fabrics in Fashion and Entertainment Market Revenue Share (%), by Type of Product 2024 & 2032
- Figure 78: Latin America Smart Fabrics in Fashion and Entertainment Market Volume Share (%), by Type of Product 2024 & 2032
- Figure 79: Latin America Smart Fabrics in Fashion and Entertainment Market Revenue (Million), by Material 2024 & 2032
- Figure 80: Latin America Smart Fabrics in Fashion and Entertainment Market Volume (K Unit), by Material 2024 & 2032
- Figure 81: Latin America Smart Fabrics in Fashion and Entertainment Market Revenue Share (%), by Material 2024 & 2032
- Figure 82: Latin America Smart Fabrics in Fashion and Entertainment Market Volume Share (%), by Material 2024 & 2032
- Figure 83: Latin America Smart Fabrics in Fashion and Entertainment Market Revenue (Million), by Application 2024 & 2032
- Figure 84: Latin America Smart Fabrics in Fashion and Entertainment Market Volume (K Unit), by Application 2024 & 2032
- Figure 85: Latin America Smart Fabrics in Fashion and Entertainment Market Revenue Share (%), by Application 2024 & 2032
- Figure 86: Latin America Smart Fabrics in Fashion and Entertainment Market Volume Share (%), by Application 2024 & 2032
- Figure 87: Latin America Smart Fabrics in Fashion and Entertainment Market Revenue (Million), by Country 2024 & 2032
- Figure 88: Latin America Smart Fabrics in Fashion and Entertainment Market Volume (K Unit), by Country 2024 & 2032
- Figure 89: Latin America Smart Fabrics in Fashion and Entertainment Market Revenue Share (%), by Country 2024 & 2032
- Figure 90: Latin America Smart Fabrics in Fashion and Entertainment Market Volume Share (%), by Country 2024 & 2032
- Figure 91: Middle East and Africa Smart Fabrics in Fashion and Entertainment Market Revenue (Million), by Type of Product 2024 & 2032
- Figure 92: Middle East and Africa Smart Fabrics in Fashion and Entertainment Market Volume (K Unit), by Type of Product 2024 & 2032
- Figure 93: Middle East and Africa Smart Fabrics in Fashion and Entertainment Market Revenue Share (%), by Type of Product 2024 & 2032
- Figure 94: Middle East and Africa Smart Fabrics in Fashion and Entertainment Market Volume Share (%), by Type of Product 2024 & 2032
- Figure 95: Middle East and Africa Smart Fabrics in Fashion and Entertainment Market Revenue (Million), by Material 2024 & 2032
- Figure 96: Middle East and Africa Smart Fabrics in Fashion and Entertainment Market Volume (K Unit), by Material 2024 & 2032
- Figure 97: Middle East and Africa Smart Fabrics in Fashion and Entertainment Market Revenue Share (%), by Material 2024 & 2032
- Figure 98: Middle East and Africa Smart Fabrics in Fashion and Entertainment Market Volume Share (%), by Material 2024 & 2032
- Figure 99: Middle East and Africa Smart Fabrics in Fashion and Entertainment Market Revenue (Million), by Application 2024 & 2032
- Figure 100: Middle East and Africa Smart Fabrics in Fashion and Entertainment Market Volume (K Unit), by Application 2024 & 2032
- Figure 101: Middle East and Africa Smart Fabrics in Fashion and Entertainment Market Revenue Share (%), by Application 2024 & 2032
- Figure 102: Middle East and Africa Smart Fabrics in Fashion and Entertainment Market Volume Share (%), by Application 2024 & 2032
- Figure 103: Middle East and Africa Smart Fabrics in Fashion and Entertainment Market Revenue (Million), by Country 2024 & 2032
- Figure 104: Middle East and Africa Smart Fabrics in Fashion and Entertainment Market Volume (K Unit), by Country 2024 & 2032
- Figure 105: Middle East and Africa Smart Fabrics in Fashion and Entertainment Market Revenue Share (%), by Country 2024 & 2032
- Figure 106: Middle East and Africa Smart Fabrics in Fashion and Entertainment Market Volume Share (%), by Country 2024 & 2032
List of Tables
- Table 1: Global Smart Fabrics in Fashion and Entertainment Market Revenue Million Forecast, by Region 2019 & 2032
- Table 2: Global Smart Fabrics in Fashion and Entertainment Market Volume K Unit Forecast, by Region 2019 & 2032
- Table 3: Global Smart Fabrics in Fashion and Entertainment Market Revenue Million Forecast, by Type of Product 2019 & 2032
- Table 4: Global Smart Fabrics in Fashion and Entertainment Market Volume K Unit Forecast, by Type of Product 2019 & 2032
- Table 5: Global Smart Fabrics in Fashion and Entertainment Market Revenue Million Forecast, by Material 2019 & 2032
- Table 6: Global Smart Fabrics in Fashion and Entertainment Market Volume K Unit Forecast, by Material 2019 & 2032
- Table 7: Global Smart Fabrics in Fashion and Entertainment Market Revenue Million Forecast, by Application 2019 & 2032
- Table 8: Global Smart Fabrics in Fashion and Entertainment Market Volume K Unit Forecast, by Application 2019 & 2032
- Table 9: Global Smart Fabrics in Fashion and Entertainment Market Revenue Million Forecast, by Region 2019 & 2032
- Table 10: Global Smart Fabrics in Fashion and Entertainment Market Volume K Unit Forecast, by Region 2019 & 2032
- Table 11: Global Smart Fabrics in Fashion and Entertainment Market Revenue Million Forecast, by Country 2019 & 2032
- Table 12: Global Smart Fabrics in Fashion and Entertainment Market Volume K Unit Forecast, by Country 2019 & 2032
- Table 13: United States Smart Fabrics in Fashion and Entertainment Market Revenue (Million) Forecast, by Application 2019 & 2032
- Table 14: United States Smart Fabrics in Fashion and Entertainment Market Volume (K Unit) Forecast, by Application 2019 & 2032
- Table 15: Canada Smart Fabrics in Fashion and Entertainment Market Revenue (Million) Forecast, by Application 2019 & 2032
- Table 16: Canada Smart Fabrics in Fashion and Entertainment Market Volume (K Unit) Forecast, by Application 2019 & 2032
- Table 17: Mexico Smart Fabrics in Fashion and Entertainment Market Revenue (Million) Forecast, by Application 2019 & 2032
- Table 18: Mexico Smart Fabrics in Fashion and Entertainment Market Volume (K Unit) Forecast, by Application 2019 & 2032
- Table 19: Global Smart Fabrics in Fashion and Entertainment Market Revenue Million Forecast, by Country 2019 & 2032
- Table 20: Global Smart Fabrics in Fashion and Entertainment Market Volume K Unit Forecast, by Country 2019 & 2032
- Table 21: Germany Smart Fabrics in Fashion and Entertainment Market Revenue (Million) Forecast, by Application 2019 & 2032
- Table 22: Germany Smart Fabrics in Fashion and Entertainment Market Volume (K Unit) Forecast, by Application 2019 & 2032
- Table 23: United Kingdom Smart Fabrics in Fashion and Entertainment Market Revenue (Million) Forecast, by Application 2019 & 2032
- Table 24: United Kingdom Smart Fabrics in Fashion and Entertainment Market Volume (K Unit) Forecast, by Application 2019 & 2032
- Table 25: France Smart Fabrics in Fashion and Entertainment Market Revenue (Million) Forecast, by Application 2019 & 2032
- Table 26: France Smart Fabrics in Fashion and Entertainment Market Volume (K Unit) Forecast, by Application 2019 & 2032
- Table 27: Spain Smart Fabrics in Fashion and Entertainment Market Revenue (Million) Forecast, by Application 2019 & 2032
- Table 28: Spain Smart Fabrics in Fashion and Entertainment Market Volume (K Unit) Forecast, by Application 2019 & 2032
- Table 29: Italy Smart Fabrics in Fashion and Entertainment Market Revenue (Million) Forecast, by Application 2019 & 2032
- Table 30: Italy Smart Fabrics in Fashion and Entertainment Market Volume (K Unit) Forecast, by Application 2019 & 2032
- Table 31: Spain Smart Fabrics in Fashion and Entertainment Market Revenue (Million) Forecast, by Application 2019 & 2032
- Table 32: Spain Smart Fabrics in Fashion and Entertainment Market Volume (K Unit) Forecast, by Application 2019 & 2032
- Table 33: Belgium Smart Fabrics in Fashion and Entertainment Market Revenue (Million) Forecast, by Application 2019 & 2032
- Table 34: Belgium Smart Fabrics in Fashion and Entertainment Market Volume (K Unit) Forecast, by Application 2019 & 2032
- Table 35: Netherland Smart Fabrics in Fashion and Entertainment Market Revenue (Million) Forecast, by Application 2019 & 2032
- Table 36: Netherland Smart Fabrics in Fashion and Entertainment Market Volume (K Unit) Forecast, by Application 2019 & 2032
- Table 37: Nordics Smart Fabrics in Fashion and Entertainment Market Revenue (Million) Forecast, by Application 2019 & 2032
- Table 38: Nordics Smart Fabrics in Fashion and Entertainment Market Volume (K Unit) Forecast, by Application 2019 & 2032
- Table 39: Rest of Europe Smart Fabrics in Fashion and Entertainment Market Revenue (Million) Forecast, by Application 2019 & 2032
- Table 40: Rest of Europe Smart Fabrics in Fashion and Entertainment Market Volume (K Unit) Forecast, by Application 2019 & 2032
- Table 41: Global Smart Fabrics in Fashion and Entertainment Market Revenue Million Forecast, by Country 2019 & 2032
- Table 42: Global Smart Fabrics in Fashion and Entertainment Market Volume K Unit Forecast, by Country 2019 & 2032
- Table 43: China Smart Fabrics in Fashion and Entertainment Market Revenue (Million) Forecast, by Application 2019 & 2032
- Table 44: China Smart Fabrics in Fashion and Entertainment Market Volume (K Unit) Forecast, by Application 2019 & 2032
- Table 45: Japan Smart Fabrics in Fashion and Entertainment Market Revenue (Million) Forecast, by Application 2019 & 2032
- Table 46: Japan Smart Fabrics in Fashion and Entertainment Market Volume (K Unit) Forecast, by Application 2019 & 2032
- Table 47: India Smart Fabrics in Fashion and Entertainment Market Revenue (Million) Forecast, by Application 2019 & 2032
- Table 48: India Smart Fabrics in Fashion and Entertainment Market Volume (K Unit) Forecast, by Application 2019 & 2032
- Table 49: South Korea Smart Fabrics in Fashion and Entertainment Market Revenue (Million) Forecast, by Application 2019 & 2032
- Table 50: South Korea Smart Fabrics in Fashion and Entertainment Market Volume (K Unit) Forecast, by Application 2019 & 2032
- Table 51: Southeast Asia Smart Fabrics in Fashion and Entertainment Market Revenue (Million) Forecast, by Application 2019 & 2032
- Table 52: Southeast Asia Smart Fabrics in Fashion and Entertainment Market Volume (K Unit) Forecast, by Application 2019 & 2032
- Table 53: Australia Smart Fabrics in Fashion and Entertainment Market Revenue (Million) Forecast, by Application 2019 & 2032
- Table 54: Australia Smart Fabrics in Fashion and Entertainment Market Volume (K Unit) Forecast, by Application 2019 & 2032
- Table 55: Indonesia Smart Fabrics in Fashion and Entertainment Market Revenue (Million) Forecast, by Application 2019 & 2032
- Table 56: Indonesia Smart Fabrics in Fashion and Entertainment Market Volume (K Unit) Forecast, by Application 2019 & 2032
- Table 57: Phillipes Smart Fabrics in Fashion and Entertainment Market Revenue (Million) Forecast, by Application 2019 & 2032
- Table 58: Phillipes Smart Fabrics in Fashion and Entertainment Market Volume (K Unit) Forecast, by Application 2019 & 2032
- Table 59: Singapore Smart Fabrics in Fashion and Entertainment Market Revenue (Million) Forecast, by Application 2019 & 2032
- Table 60: Singapore Smart Fabrics in Fashion and Entertainment Market Volume (K Unit) Forecast, by Application 2019 & 2032
- Table 61: Thailandc Smart Fabrics in Fashion and Entertainment Market Revenue (Million) Forecast, by Application 2019 & 2032
- Table 62: Thailandc Smart Fabrics in Fashion and Entertainment Market Volume (K Unit) Forecast, by Application 2019 & 2032
- Table 63: Rest of Asia Pacific Smart Fabrics in Fashion and Entertainment Market Revenue (Million) Forecast, by Application 2019 & 2032
- Table 64: Rest of Asia Pacific Smart Fabrics in Fashion and Entertainment Market Volume (K Unit) Forecast, by Application 2019 & 2032
- Table 65: Global Smart Fabrics in Fashion and Entertainment Market Revenue Million Forecast, by Country 2019 & 2032
- Table 66: Global Smart Fabrics in Fashion and Entertainment Market Volume K Unit Forecast, by Country 2019 & 2032
- Table 67: Brazil Smart Fabrics in Fashion and Entertainment Market Revenue (Million) Forecast, by Application 2019 & 2032
- Table 68: Brazil Smart Fabrics in Fashion and Entertainment Market Volume (K Unit) Forecast, by Application 2019 & 2032
- Table 69: Argentina Smart Fabrics in Fashion and Entertainment Market Revenue (Million) Forecast, by Application 2019 & 2032
- Table 70: Argentina Smart Fabrics in Fashion and Entertainment Market Volume (K Unit) Forecast, by Application 2019 & 2032
- Table 71: Peru Smart Fabrics in Fashion and Entertainment Market Revenue (Million) Forecast, by Application 2019 & 2032
- Table 72: Peru Smart Fabrics in Fashion and Entertainment Market Volume (K Unit) Forecast, by Application 2019 & 2032
- Table 73: Chile Smart Fabrics in Fashion and Entertainment Market Revenue (Million) Forecast, by Application 2019 & 2032
- Table 74: Chile Smart Fabrics in Fashion and Entertainment Market Volume (K Unit) Forecast, by Application 2019 & 2032
- Table 75: Colombia Smart Fabrics in Fashion and Entertainment Market Revenue (Million) Forecast, by Application 2019 & 2032
- Table 76: Colombia Smart Fabrics in Fashion and Entertainment Market Volume (K Unit) Forecast, by Application 2019 & 2032
- Table 77: Ecuador Smart Fabrics in Fashion and Entertainment Market Revenue (Million) Forecast, by Application 2019 & 2032
- Table 78: Ecuador Smart Fabrics in Fashion and Entertainment Market Volume (K Unit) Forecast, by Application 2019 & 2032
- Table 79: Venezuela Smart Fabrics in Fashion and Entertainment Market Revenue (Million) Forecast, by Application 2019 & 2032
- Table 80: Venezuela Smart Fabrics in Fashion and Entertainment Market Volume (K Unit) Forecast, by Application 2019 & 2032
- Table 81: Rest of South America Smart Fabrics in Fashion and Entertainment Market Revenue (Million) Forecast, by Application 2019 & 2032
- Table 82: Rest of South America Smart Fabrics in Fashion and Entertainment Market Volume (K Unit) Forecast, by Application 2019 & 2032
- Table 83: Global Smart Fabrics in Fashion and Entertainment Market Revenue Million Forecast, by Country 2019 & 2032
- Table 84: Global Smart Fabrics in Fashion and Entertainment Market Volume K Unit Forecast, by Country 2019 & 2032
- Table 85: United States Smart Fabrics in Fashion and Entertainment Market Revenue (Million) Forecast, by Application 2019 & 2032
- Table 86: United States Smart Fabrics in Fashion and Entertainment Market Volume (K Unit) Forecast, by Application 2019 & 2032
- Table 87: Canada Smart Fabrics in Fashion and Entertainment Market Revenue (Million) Forecast, by Application 2019 & 2032
- Table 88: Canada Smart Fabrics in Fashion and Entertainment Market Volume (K Unit) Forecast, by Application 2019 & 2032
- Table 89: Mexico Smart Fabrics in Fashion and Entertainment Market Revenue (Million) Forecast, by Application 2019 & 2032
- Table 90: Mexico Smart Fabrics in Fashion and Entertainment Market Volume (K Unit) Forecast, by Application 2019 & 2032
- Table 91: Global Smart Fabrics in Fashion and Entertainment Market Revenue Million Forecast, by Country 2019 & 2032
- Table 92: Global Smart Fabrics in Fashion and Entertainment Market Volume K Unit Forecast, by Country 2019 & 2032
- Table 93: United Arab Emirates Smart Fabrics in Fashion and Entertainment Market Revenue (Million) Forecast, by Application 2019 & 2032
- Table 94: United Arab Emirates Smart Fabrics in Fashion and Entertainment Market Volume (K Unit) Forecast, by Application 2019 & 2032
- Table 95: Saudi Arabia Smart Fabrics in Fashion and Entertainment Market Revenue (Million) Forecast, by Application 2019 & 2032
- Table 96: Saudi Arabia Smart Fabrics in Fashion and Entertainment Market Volume (K Unit) Forecast, by Application 2019 & 2032
- Table 97: South Africa Smart Fabrics in Fashion and Entertainment Market Revenue (Million) Forecast, by Application 2019 & 2032
- Table 98: South Africa Smart Fabrics in Fashion and Entertainment Market Volume (K Unit) Forecast, by Application 2019 & 2032
- Table 99: Rest of Middle East and Africa Smart Fabrics in Fashion and Entertainment Market Revenue (Million) Forecast, by Application 2019 & 2032
- Table 100: Rest of Middle East and Africa Smart Fabrics in Fashion and Entertainment Market Volume (K Unit) Forecast, by Application 2019 & 2032
- Table 101: Global Smart Fabrics in Fashion and Entertainment Market Revenue Million Forecast, by Type of Product 2019 & 2032
- Table 102: Global Smart Fabrics in Fashion and Entertainment Market Volume K Unit Forecast, by Type of Product 2019 & 2032
- Table 103: Global Smart Fabrics in Fashion and Entertainment Market Revenue Million Forecast, by Material 2019 & 2032
- Table 104: Global Smart Fabrics in Fashion and Entertainment Market Volume K Unit Forecast, by Material 2019 & 2032
- Table 105: Global Smart Fabrics in Fashion and Entertainment Market Revenue Million Forecast, by Application 2019 & 2032
- Table 106: Global Smart Fabrics in Fashion and Entertainment Market Volume K Unit Forecast, by Application 2019 & 2032
- Table 107: Global Smart Fabrics in Fashion and Entertainment Market Revenue Million Forecast, by Country 2019 & 2032
- Table 108: Global Smart Fabrics in Fashion and Entertainment Market Volume K Unit Forecast, by Country 2019 & 2032
- Table 109: Global Smart Fabrics in Fashion and Entertainment Market Revenue Million Forecast, by Type of Product 2019 & 2032
- Table 110: Global Smart Fabrics in Fashion and Entertainment Market Volume K Unit Forecast, by Type of Product 2019 & 2032
- Table 111: Global Smart Fabrics in Fashion and Entertainment Market Revenue Million Forecast, by Material 2019 & 2032
- Table 112: Global Smart Fabrics in Fashion and Entertainment Market Volume K Unit Forecast, by Material 2019 & 2032
- Table 113: Global Smart Fabrics in Fashion and Entertainment Market Revenue Million Forecast, by Application 2019 & 2032
- Table 114: Global Smart Fabrics in Fashion and Entertainment Market Volume K Unit Forecast, by Application 2019 & 2032
- Table 115: Global Smart Fabrics in Fashion and Entertainment Market Revenue Million Forecast, by Country 2019 & 2032
- Table 116: Global Smart Fabrics in Fashion and Entertainment Market Volume K Unit Forecast, by Country 2019 & 2032
- Table 117: Global Smart Fabrics in Fashion and Entertainment Market Revenue Million Forecast, by Type of Product 2019 & 2032
- Table 118: Global Smart Fabrics in Fashion and Entertainment Market Volume K Unit Forecast, by Type of Product 2019 & 2032
- Table 119: Global Smart Fabrics in Fashion and Entertainment Market Revenue Million Forecast, by Material 2019 & 2032
- Table 120: Global Smart Fabrics in Fashion and Entertainment Market Volume K Unit Forecast, by Material 2019 & 2032
- Table 121: Global Smart Fabrics in Fashion and Entertainment Market Revenue Million Forecast, by Application 2019 & 2032
- Table 122: Global Smart Fabrics in Fashion and Entertainment Market Volume K Unit Forecast, by Application 2019 & 2032
- Table 123: Global Smart Fabrics in Fashion and Entertainment Market Revenue Million Forecast, by Country 2019 & 2032
- Table 124: Global Smart Fabrics in Fashion and Entertainment Market Volume K Unit Forecast, by Country 2019 & 2032
- Table 125: Global Smart Fabrics in Fashion and Entertainment Market Revenue Million Forecast, by Type of Product 2019 & 2032
- Table 126: Global Smart Fabrics in Fashion and Entertainment Market Volume K Unit Forecast, by Type of Product 2019 & 2032
- Table 127: Global Smart Fabrics in Fashion and Entertainment Market Revenue Million Forecast, by Material 2019 & 2032
- Table 128: Global Smart Fabrics in Fashion and Entertainment Market Volume K Unit Forecast, by Material 2019 & 2032
- Table 129: Global Smart Fabrics in Fashion and Entertainment Market Revenue Million Forecast, by Application 2019 & 2032
- Table 130: Global Smart Fabrics in Fashion and Entertainment Market Volume K Unit Forecast, by Application 2019 & 2032
- Table 131: Global Smart Fabrics in Fashion and Entertainment Market Revenue Million Forecast, by Country 2019 & 2032
- Table 132: Global Smart Fabrics in Fashion and Entertainment Market Volume K Unit Forecast, by Country 2019 & 2032
- Table 133: Global Smart Fabrics in Fashion and Entertainment Market Revenue Million Forecast, by Type of Product 2019 & 2032
- Table 134: Global Smart Fabrics in Fashion and Entertainment Market Volume K Unit Forecast, by Type of Product 2019 & 2032
- Table 135: Global Smart Fabrics in Fashion and Entertainment Market Revenue Million Forecast, by Material 2019 & 2032
- Table 136: Global Smart Fabrics in Fashion and Entertainment Market Volume K Unit Forecast, by Material 2019 & 2032
- Table 137: Global Smart Fabrics in Fashion and Entertainment Market Revenue Million Forecast, by Application 2019 & 2032
- Table 138: Global Smart Fabrics in Fashion and Entertainment Market Volume K Unit Forecast, by Application 2019 & 2032
- Table 139: Global Smart Fabrics in Fashion and Entertainment Market Revenue Million Forecast, by Country 2019 & 2032
- Table 140: Global Smart Fabrics in Fashion and Entertainment Market Volume K Unit Forecast, by Country 2019 & 2032
Frequently Asked Questions
1. What is the projected Compound Annual Growth Rate (CAGR) of the Smart Fabrics in Fashion and Entertainment Market?
The projected CAGR is approximately 31.29%.
2. Which companies are prominent players in the Smart Fabrics in Fashion and Entertainment Market?
Key companies in the market include Textronics Inc, Bebop Sensors Inc , AIQ Smart Clothing Inc, Outlast Technologies LLC, Gentherm Incorporated, Intelligent Textiles Limited, Schoeller Technologies AG, Sensoria Inc, Clothing Plus Ltd, Interactive Wear AG, E L Du Pont De Nemours and Company.
3. What are the main segments of the Smart Fabrics in Fashion and Entertainment Market?
The market segments include Type of Product, Material, Application .
4. Can you provide details about the market size?
The market size is estimated to be USD XX Million as of 2022.
5. What are some drivers contributing to market growth?
Miniaturization of Electronic Components Influencing the Growth of the Market; Increasing Use of Wearable Electronics; Rapid Growth of Low-cost Smart Wireless Sensor Networks.
6. What are the notable trends driving market growth?
Adoption of Wearable Devices to Drive the Market's Growth.
7. Are there any restraints impacting market growth?
Very High Implementation Costs.
8. Can you provide examples of recent developments in the market?
July 2022 - Microsoft developed a smart fabric that detects objects and gestures. Layer networked sensors embedded in the material can detect an object or motion, and it is more than simply a few sensors sewed in. The patent also describes the creation of data processing circuitry. It can receive, process, and transmit data from the smart fabric.
9. What pricing options are available for accessing the report?
Pricing options include single-user, multi-user, and enterprise licenses priced at USD 4750, USD 5250, and USD 8750 respectively.
10. Is the market size provided in terms of value or volume?
The market size is provided in terms of value, measured in Million and volume, measured in K Unit.
11. Are there any specific market keywords associated with the report?
Yes, the market keyword associated with the report is "Smart Fabrics in Fashion and Entertainment Market," which aids in identifying and referencing the specific market segment covered.
12. How do I determine which pricing option suits my needs best?
The pricing options vary based on user requirements and access needs. Individual users may opt for single-user licenses, while businesses requiring broader access may choose multi-user or enterprise licenses for cost-effective access to the report.
13. Are there any additional resources or data provided in the Smart Fabrics in Fashion and Entertainment Market report?
While the report offers comprehensive insights, it's advisable to review the specific contents or supplementary materials provided to ascertain if additional resources or data are available.
14. How can I stay updated on further developments or reports in the Smart Fabrics in Fashion and Entertainment Market?
To stay informed about further developments, trends, and reports in the Smart Fabrics in Fashion and Entertainment Market, consider subscribing to industry newsletters, following relevant companies and organizations, or regularly checking reputable industry news sources and publications.
Methodology
Step 1 - Identification of Relevant Samples Size from Population Database


Step 2 - Approaches for Defining Global Market Size (Value, Volume* & Price*)

Note*: In applicable scenarios
Step 3 - Data Sources
Primary Research
- Web Analytics
- Survey Reports
- Research Institute
- Latest Research Reports
- Opinion Leaders
Secondary Research
- Annual Reports
- White Paper
- Latest Press Release
- Industry Association
- Paid Database
- Investor Presentations

Step 4 - Data Triangulation
Involves using different sources of information in order to increase the validity of a study
These sources are likely to be stakeholders in a program - participants, other researchers, program staff, other community members, and so on.
Then we put all data in single framework & apply various statistical tools to find out the dynamic on the market.
During the analysis stage, feedback from the stakeholder groups would be compared to determine areas of agreement as well as areas of divergence


