
Key Insights
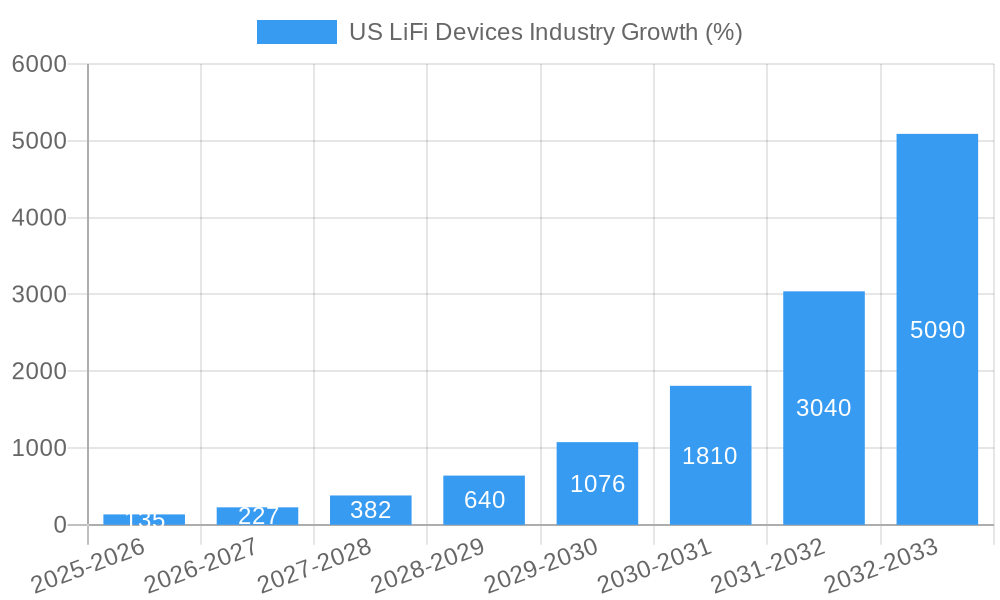
The US LiFi devices market is experiencing explosive growth, projected to reach a substantial size by 2033, driven by a remarkable Compound Annual Growth Rate (CAGR) of 67.50%. This surge is fueled by several key factors. The increasing demand for high-speed, secure, and energy-efficient wireless communication solutions across diverse sectors is a primary driver. The adoption of LiFi technology is particularly strong in urban areas like New York, Los Angeles, Chicago, and other major cities, where dense populations and high data demands necessitate superior connectivity options. Furthermore, the expanding deployment of LiFi in corporate offices, railways, airlines, retail establishments, and hotels is further boosting market expansion. The different types of LiFi devices, including LEDs, photodiodes, and microcontrollers, each cater to specific applications and contribute to the overall market diversification. While challenges like higher initial investment costs and the need for specialized infrastructure exist, the long-term benefits of LiFi in terms of speed, security, and energy efficiency are overcoming these restraints, driving further adoption.
The market segmentation reveals significant opportunities within specific application areas. The corporate office segment is expected to show robust growth, driven by the need for secure data transmission and improved network performance. Similarly, the retail and hospitality sectors are embracing LiFi for enhancing customer experience and operational efficiency. The geographical breakdown indicates strong growth across the Northeast, Southeast, Midwest, Southwest, and West regions of the United States, reflecting the widespread adoption of the technology across the nation. This diverse application and geographical spread signifies the broad appeal and future potential of LiFi technology within the United States. The leading companies, including Signify, LiFi Labs, and Oledcomm, are actively shaping market trends through innovation and product development. The continuing evolution of LiFi technology promises even greater market penetration in the coming years.
US LiFi Devices Industry Market Report: 2019-2033
This comprehensive report provides a detailed analysis of the US LiFi devices industry, offering invaluable insights for industry professionals, investors, and strategic decision-makers. Covering the period 2019-2033, with a focus on 2025, this report meticulously examines market structure, dynamics, dominant segments, product innovations, and future outlook. The report leverages robust data and analysis to provide actionable intelligence for navigating the evolving landscape of LiFi technology in the United States.

US LiFi Devices Industry Market Structure & Innovation Trends
The US LiFi devices market is characterized by a moderate level of concentration, with key players such as Signify, LiFi Labs, and Oledcomm holding significant market share. Precise figures for market share are unavailable at this time (xx%), but competition is expected to intensify with the entry of new players and technological advancements. Innovation is driven by the need for high-speed, secure, and energy-efficient wireless communication solutions, particularly in high-density areas. Regulatory frameworks, while still evolving, are generally supportive of LiFi adoption, particularly in sectors like healthcare and industrial automation where data security is paramount. The primary product substitute remains Wi-Fi, but LiFi offers advantages in terms of security and bandwidth in specific applications. End-user demographics are diverse, ranging from residential users to large corporations adopting LiFi for specific needs. M&A activity in the LiFi sector remains relatively limited (xx Million in total deal value from 2019-2024), but we anticipate an increase as the market matures.
US LiFi Devices Industry Market Dynamics & Trends
The US LiFi devices market is experiencing robust growth, driven by increasing demand for high-bandwidth, secure communication solutions. The compound annual growth rate (CAGR) is projected to be xx% during the forecast period (2025-2033), with significant market penetration in specific sectors such as corporate offices and transportation. Technological advancements, particularly in LED technology and light modulation techniques, are fueling this growth. Consumer preferences are shifting towards seamless connectivity, privacy, and energy efficiency – all of which LiFi effectively addresses. Competitive dynamics are marked by both collaboration and competition, with companies focusing on strategic partnerships, product differentiation, and expanding market reach. Market penetration is currently estimated at xx% in 2025, and expected to increase significantly by 2033.
Dominant Regions & Segments in US LiFi Devices Industry
While data on precise market dominance is limited at present, the report projects that New York, Los Angeles, and Chicago will be leading cities for LiFi adoption due to their robust infrastructure and high population density. Other significant cities include Houston, Philadelphia, and Washington.
- Key Drivers for Leading Cities:
- High concentration of businesses and corporations needing high-speed data transfer.
- Advanced infrastructure supporting technology integration.
- Strong government initiatives to promote digital transformation.
The corporate office segment is anticipated to be a significant driver of LiFi adoption, followed by retail stores/supermarkets/hypermarkets and hotels. Railways and airlines are also emerging as potential significant users. Within device types, LED-based LiFi systems are expected to dominate the market initially, given their cost-effectiveness and compatibility with existing lighting infrastructure.
US LiFi Devices Industry Product Innovations
Recent product innovations focus on enhancing the speed, range, and security of LiFi systems. Manufacturers are actively developing integrated LiFi solutions, combining lighting and communication functionalities. This approach aligns with the market's need for seamless integration and reduces deployment costs. The integration of LiFi technology into rugged devices, as demonstrated by Getac's collaboration with Signify, highlights the expanding applications of this technology.
Report Scope & Segmentation Analysis
This report segments the US LiFi devices market by city (New York, Los Angeles, Chicago, Houston, Philadelphia, Washington, Other Cities), usage (House, Corporate Office, Railways and Airlines, Airways, Retail Stores/Supermarkets/Hypermarkets, Hotels, Others), and device type (LED, Photodiodes, Microcontrollers, Other Types). Each segment's growth projection, market size, and competitive dynamics are analyzed individually. Market size projections for 2025 are estimated at xx Million for the overall market. Specific segment values will be provided in the full report.
Key Drivers of US LiFi Devices Industry Growth
Several factors are driving the growth of the US LiFi devices industry. These include:
- Technological advancements: Improvements in LED technology, data transmission rates, and system integration are lowering costs and expanding applications.
- Demand for secure communication: LiFi’s inherent security features are appealing to sectors with strict data privacy requirements.
- Government initiatives: Supportive regulations and incentives are promoting LiFi adoption in various sectors.
Challenges in the US LiFi Devices Industry Sector
Despite the growth potential, several challenges remain:
- High initial investment costs: Deploying LiFi infrastructure can be costly, limiting widespread adoption, particularly in residential settings.
- Limited range and line-of-sight dependency: Unlike Wi-Fi, LiFi requires a direct line of sight between the transmitter and receiver.
- Interference from ambient light: Strong ambient light can interfere with LiFi signal transmission.
Emerging Opportunities in US LiFi Devices Industry
The US LiFi devices industry presents several exciting opportunities:
- Expansion into new sectors: Healthcare, automotive, and industrial automation offer promising avenues for LiFi deployment.
- Development of advanced LiFi technologies: Research and development in high-speed data transfer, increased range, and improved integration are crucial.
- Leveraging smart city initiatives: LiFi technology can be seamlessly integrated into smart city infrastructure.
Leading Players in the US LiFi Devices Industry Market
- Signify
- LiFi Labs
- Oledcomm
Key Developments in US LiFi Devices Industry
- September 2023: Getac announced a collaboration with Signify to embed LiFi technology into rugged devices.
- April 2023: Oledcomm demonstrated new space applications for its LIFIMAX2G technology, doubling connection speeds to 2Gbps.
Future Outlook for US LiFi Devices Industry Market
The future of the US LiFi devices market is bright. Continued technological advancements, coupled with increased demand for secure and high-speed wireless communication, will drive significant growth. Strategic partnerships and government support will play a key role in expanding market penetration across various sectors. The market is poised for significant expansion over the forecast period, representing a lucrative opportunity for investors and industry players alike. The report concludes with a detailed forecast for the next decade, outlining opportunities and potential market challenges.
US LiFi Devices Industry Segmentation
-
1. Cities
- 1.1. New York
- 1.2. Los Angeles
- 1.3. Chicago
- 1.4. Houston
- 1.5. Philadelphia
- 1.6. Washington
- 1.7. Other Cities
-
2. Estimated Usage
- 2.1. House
- 2.2. Corporate Office
- 2.3. Railways and Airlines
- 2.4. Airways
- 2.5. Retail Stores/Supermarkets/Hypermarkets
- 2.6. Hotels
- 2.7. Others
-
3. Types
- 3.1. LED
- 3.2. Photodiodes
- 3.3. Microcontrollers
- 3.4. Other Types
US LiFi Devices Industry Segmentation By Geography
-
1. North America
- 1.1. United States
- 1.2. Canada
- 1.3. Mexico
-
2. South America
- 2.1. Brazil
- 2.2. Argentina
- 2.3. Rest of South America
-
3. Europe
- 3.1. United Kingdom
- 3.2. Germany
- 3.3. France
- 3.4. Italy
- 3.5. Spain
- 3.6. Russia
- 3.7. Benelux
- 3.8. Nordics
- 3.9. Rest of Europe
-
4. Middle East & Africa
- 4.1. Turkey
- 4.2. Israel
- 4.3. GCC
- 4.4. North Africa
- 4.5. South Africa
- 4.6. Rest of Middle East & Africa
-
5. Asia Pacific
- 5.1. China
- 5.2. India
- 5.3. Japan
- 5.4. South Korea
- 5.5. ASEAN
- 5.6. Oceania
- 5.7. Rest of Asia Pacific

US LiFi Devices Industry REPORT HIGHLIGHTS
| Aspects | Details |
|---|---|
| Study Period | 2019-2033 |
| Base Year | 2024 |
| Estimated Year | 2025 |
| Forecast Period | 2025-2033 |
| Historical Period | 2019-2024 |
| Growth Rate | CAGR of 67.50% from 2019-2033 |
| Segmentation |
|
Table of Contents
- 1. Introduction
- 1.1. Research Scope
- 1.2. Market Segmentation
- 1.3. Research Methodology
- 1.4. Definitions and Assumptions
- 2. Executive Summary
- 2.1. Introduction
- 3. Market Dynamics
- 3.1. Introduction
- 3.2. Market Drivers
- 3.2.1. Huge Demand for Specialized Internet Technologies; Low Energy Consumption; Faster and Safe Data Transfer; High Bandwidth; Vast Applications
- 3.3. Market Restrains
- 3.3.1. Limited Range; Cannot Substitute Wi-Fi Completely; Scattered Internet Penetration; Transmission can be Easily Disrupted
- 3.4. Market Trends
- 3.4.1. LED Segment is Expected to Register a Significant Growth Rate
- 4. Market Factor Analysis
- 4.1. Porters Five Forces
- 4.2. Supply/Value Chain
- 4.3. PESTEL analysis
- 4.4. Market Entropy
- 4.5. Patent/Trademark Analysis
- 5. Global US LiFi Devices Industry Analysis, Insights and Forecast, 2019-2031
- 5.1. Market Analysis, Insights and Forecast - by Cities
- 5.1.1. New York
- 5.1.2. Los Angeles
- 5.1.3. Chicago
- 5.1.4. Houston
- 5.1.5. Philadelphia
- 5.1.6. Washington
- 5.1.7. Other Cities
- 5.2. Market Analysis, Insights and Forecast - by Estimated Usage
- 5.2.1. House
- 5.2.2. Corporate Office
- 5.2.3. Railways and Airlines
- 5.2.4. Airways
- 5.2.5. Retail Stores/Supermarkets/Hypermarkets
- 5.2.6. Hotels
- 5.2.7. Others
- 5.3. Market Analysis, Insights and Forecast - by Types
- 5.3.1. LED
- 5.3.2. Photodiodes
- 5.3.3. Microcontrollers
- 5.3.4. Other Types
- 5.4. Market Analysis, Insights and Forecast - by Region
- 5.4.1. North America
- 5.4.2. South America
- 5.4.3. Europe
- 5.4.4. Middle East & Africa
- 5.4.5. Asia Pacific
- 5.1. Market Analysis, Insights and Forecast - by Cities
- 6. North America US LiFi Devices Industry Analysis, Insights and Forecast, 2019-2031
- 6.1. Market Analysis, Insights and Forecast - by Cities
- 6.1.1. New York
- 6.1.2. Los Angeles
- 6.1.3. Chicago
- 6.1.4. Houston
- 6.1.5. Philadelphia
- 6.1.6. Washington
- 6.1.7. Other Cities
- 6.2. Market Analysis, Insights and Forecast - by Estimated Usage
- 6.2.1. House
- 6.2.2. Corporate Office
- 6.2.3. Railways and Airlines
- 6.2.4. Airways
- 6.2.5. Retail Stores/Supermarkets/Hypermarkets
- 6.2.6. Hotels
- 6.2.7. Others
- 6.3. Market Analysis, Insights and Forecast - by Types
- 6.3.1. LED
- 6.3.2. Photodiodes
- 6.3.3. Microcontrollers
- 6.3.4. Other Types
- 6.1. Market Analysis, Insights and Forecast - by Cities
- 7. South America US LiFi Devices Industry Analysis, Insights and Forecast, 2019-2031
- 7.1. Market Analysis, Insights and Forecast - by Cities
- 7.1.1. New York
- 7.1.2. Los Angeles
- 7.1.3. Chicago
- 7.1.4. Houston
- 7.1.5. Philadelphia
- 7.1.6. Washington
- 7.1.7. Other Cities
- 7.2. Market Analysis, Insights and Forecast - by Estimated Usage
- 7.2.1. House
- 7.2.2. Corporate Office
- 7.2.3. Railways and Airlines
- 7.2.4. Airways
- 7.2.5. Retail Stores/Supermarkets/Hypermarkets
- 7.2.6. Hotels
- 7.2.7. Others
- 7.3. Market Analysis, Insights and Forecast - by Types
- 7.3.1. LED
- 7.3.2. Photodiodes
- 7.3.3. Microcontrollers
- 7.3.4. Other Types
- 7.1. Market Analysis, Insights and Forecast - by Cities
- 8. Europe US LiFi Devices Industry Analysis, Insights and Forecast, 2019-2031
- 8.1. Market Analysis, Insights and Forecast - by Cities
- 8.1.1. New York
- 8.1.2. Los Angeles
- 8.1.3. Chicago
- 8.1.4. Houston
- 8.1.5. Philadelphia
- 8.1.6. Washington
- 8.1.7. Other Cities
- 8.2. Market Analysis, Insights and Forecast - by Estimated Usage
- 8.2.1. House
- 8.2.2. Corporate Office
- 8.2.3. Railways and Airlines
- 8.2.4. Airways
- 8.2.5. Retail Stores/Supermarkets/Hypermarkets
- 8.2.6. Hotels
- 8.2.7. Others
- 8.3. Market Analysis, Insights and Forecast - by Types
- 8.3.1. LED
- 8.3.2. Photodiodes
- 8.3.3. Microcontrollers
- 8.3.4. Other Types
- 8.1. Market Analysis, Insights and Forecast - by Cities
- 9. Middle East & Africa US LiFi Devices Industry Analysis, Insights and Forecast, 2019-2031
- 9.1. Market Analysis, Insights and Forecast - by Cities
- 9.1.1. New York
- 9.1.2. Los Angeles
- 9.1.3. Chicago
- 9.1.4. Houston
- 9.1.5. Philadelphia
- 9.1.6. Washington
- 9.1.7. Other Cities
- 9.2. Market Analysis, Insights and Forecast - by Estimated Usage
- 9.2.1. House
- 9.2.2. Corporate Office
- 9.2.3. Railways and Airlines
- 9.2.4. Airways
- 9.2.5. Retail Stores/Supermarkets/Hypermarkets
- 9.2.6. Hotels
- 9.2.7. Others
- 9.3. Market Analysis, Insights and Forecast - by Types
- 9.3.1. LED
- 9.3.2. Photodiodes
- 9.3.3. Microcontrollers
- 9.3.4. Other Types
- 9.1. Market Analysis, Insights and Forecast - by Cities
- 10. Asia Pacific US LiFi Devices Industry Analysis, Insights and Forecast, 2019-2031
- 10.1. Market Analysis, Insights and Forecast - by Cities
- 10.1.1. New York
- 10.1.2. Los Angeles
- 10.1.3. Chicago
- 10.1.4. Houston
- 10.1.5. Philadelphia
- 10.1.6. Washington
- 10.1.7. Other Cities
- 10.2. Market Analysis, Insights and Forecast - by Estimated Usage
- 10.2.1. House
- 10.2.2. Corporate Office
- 10.2.3. Railways and Airlines
- 10.2.4. Airways
- 10.2.5. Retail Stores/Supermarkets/Hypermarkets
- 10.2.6. Hotels
- 10.2.7. Others
- 10.3. Market Analysis, Insights and Forecast - by Types
- 10.3.1. LED
- 10.3.2. Photodiodes
- 10.3.3. Microcontrollers
- 10.3.4. Other Types
- 10.1. Market Analysis, Insights and Forecast - by Cities
- 11. Northeast US LiFi Devices Industry Analysis, Insights and Forecast, 2019-2031
- 12. Southeast US LiFi Devices Industry Analysis, Insights and Forecast, 2019-2031
- 13. Midwest US LiFi Devices Industry Analysis, Insights and Forecast, 2019-2031
- 14. Southwest US LiFi Devices Industry Analysis, Insights and Forecast, 2019-2031
- 15. West US LiFi Devices Industry Analysis, Insights and Forecast, 2019-2031
- 16. Competitive Analysis
- 16.1. Global Market Share Analysis 2024
- 16.2. Company Profiles
- 16.2.1 Signify
- 16.2.1.1. Overview
- 16.2.1.2. Products
- 16.2.1.3. SWOT Analysis
- 16.2.1.4. Recent Developments
- 16.2.1.5. Financials (Based on Availability)
- 16.2.2 LiFi Labs
- 16.2.2.1. Overview
- 16.2.2.2. Products
- 16.2.2.3. SWOT Analysis
- 16.2.2.4. Recent Developments
- 16.2.2.5. Financials (Based on Availability)
- 16.2.3 Oledcomm
- 16.2.3.1. Overview
- 16.2.3.2. Products
- 16.2.3.3. SWOT Analysis
- 16.2.3.4. Recent Developments
- 16.2.3.5. Financials (Based on Availability)
- 16.2.1 Signify
List of Figures
- Figure 1: Global US LiFi Devices Industry Revenue Breakdown (Million, %) by Region 2024 & 2032
- Figure 2: Global US LiFi Devices Industry Volume Breakdown (K Units, %) by Region 2024 & 2032
- Figure 3: United states US LiFi Devices Industry Revenue (Million), by Country 2024 & 2032
- Figure 4: United states US LiFi Devices Industry Volume (K Units), by Country 2024 & 2032
- Figure 5: United states US LiFi Devices Industry Revenue Share (%), by Country 2024 & 2032
- Figure 6: United states US LiFi Devices Industry Volume Share (%), by Country 2024 & 2032
- Figure 7: North America US LiFi Devices Industry Revenue (Million), by Cities 2024 & 2032
- Figure 8: North America US LiFi Devices Industry Volume (K Units), by Cities 2024 & 2032
- Figure 9: North America US LiFi Devices Industry Revenue Share (%), by Cities 2024 & 2032
- Figure 10: North America US LiFi Devices Industry Volume Share (%), by Cities 2024 & 2032
- Figure 11: North America US LiFi Devices Industry Revenue (Million), by Estimated Usage 2024 & 2032
- Figure 12: North America US LiFi Devices Industry Volume (K Units), by Estimated Usage 2024 & 2032
- Figure 13: North America US LiFi Devices Industry Revenue Share (%), by Estimated Usage 2024 & 2032
- Figure 14: North America US LiFi Devices Industry Volume Share (%), by Estimated Usage 2024 & 2032
- Figure 15: North America US LiFi Devices Industry Revenue (Million), by Types 2024 & 2032
- Figure 16: North America US LiFi Devices Industry Volume (K Units), by Types 2024 & 2032
- Figure 17: North America US LiFi Devices Industry Revenue Share (%), by Types 2024 & 2032
- Figure 18: North America US LiFi Devices Industry Volume Share (%), by Types 2024 & 2032
- Figure 19: North America US LiFi Devices Industry Revenue (Million), by Country 2024 & 2032
- Figure 20: North America US LiFi Devices Industry Volume (K Units), by Country 2024 & 2032
- Figure 21: North America US LiFi Devices Industry Revenue Share (%), by Country 2024 & 2032
- Figure 22: North America US LiFi Devices Industry Volume Share (%), by Country 2024 & 2032
- Figure 23: South America US LiFi Devices Industry Revenue (Million), by Cities 2024 & 2032
- Figure 24: South America US LiFi Devices Industry Volume (K Units), by Cities 2024 & 2032
- Figure 25: South America US LiFi Devices Industry Revenue Share (%), by Cities 2024 & 2032
- Figure 26: South America US LiFi Devices Industry Volume Share (%), by Cities 2024 & 2032
- Figure 27: South America US LiFi Devices Industry Revenue (Million), by Estimated Usage 2024 & 2032
- Figure 28: South America US LiFi Devices Industry Volume (K Units), by Estimated Usage 2024 & 2032
- Figure 29: South America US LiFi Devices Industry Revenue Share (%), by Estimated Usage 2024 & 2032
- Figure 30: South America US LiFi Devices Industry Volume Share (%), by Estimated Usage 2024 & 2032
- Figure 31: South America US LiFi Devices Industry Revenue (Million), by Types 2024 & 2032
- Figure 32: South America US LiFi Devices Industry Volume (K Units), by Types 2024 & 2032
- Figure 33: South America US LiFi Devices Industry Revenue Share (%), by Types 2024 & 2032
- Figure 34: South America US LiFi Devices Industry Volume Share (%), by Types 2024 & 2032
- Figure 35: South America US LiFi Devices Industry Revenue (Million), by Country 2024 & 2032
- Figure 36: South America US LiFi Devices Industry Volume (K Units), by Country 2024 & 2032
- Figure 37: South America US LiFi Devices Industry Revenue Share (%), by Country 2024 & 2032
- Figure 38: South America US LiFi Devices Industry Volume Share (%), by Country 2024 & 2032
- Figure 39: Europe US LiFi Devices Industry Revenue (Million), by Cities 2024 & 2032
- Figure 40: Europe US LiFi Devices Industry Volume (K Units), by Cities 2024 & 2032
- Figure 41: Europe US LiFi Devices Industry Revenue Share (%), by Cities 2024 & 2032
- Figure 42: Europe US LiFi Devices Industry Volume Share (%), by Cities 2024 & 2032
- Figure 43: Europe US LiFi Devices Industry Revenue (Million), by Estimated Usage 2024 & 2032
- Figure 44: Europe US LiFi Devices Industry Volume (K Units), by Estimated Usage 2024 & 2032
- Figure 45: Europe US LiFi Devices Industry Revenue Share (%), by Estimated Usage 2024 & 2032
- Figure 46: Europe US LiFi Devices Industry Volume Share (%), by Estimated Usage 2024 & 2032
- Figure 47: Europe US LiFi Devices Industry Revenue (Million), by Types 2024 & 2032
- Figure 48: Europe US LiFi Devices Industry Volume (K Units), by Types 2024 & 2032
- Figure 49: Europe US LiFi Devices Industry Revenue Share (%), by Types 2024 & 2032
- Figure 50: Europe US LiFi Devices Industry Volume Share (%), by Types 2024 & 2032
- Figure 51: Europe US LiFi Devices Industry Revenue (Million), by Country 2024 & 2032
- Figure 52: Europe US LiFi Devices Industry Volume (K Units), by Country 2024 & 2032
- Figure 53: Europe US LiFi Devices Industry Revenue Share (%), by Country 2024 & 2032
- Figure 54: Europe US LiFi Devices Industry Volume Share (%), by Country 2024 & 2032
- Figure 55: Middle East & Africa US LiFi Devices Industry Revenue (Million), by Cities 2024 & 2032
- Figure 56: Middle East & Africa US LiFi Devices Industry Volume (K Units), by Cities 2024 & 2032
- Figure 57: Middle East & Africa US LiFi Devices Industry Revenue Share (%), by Cities 2024 & 2032
- Figure 58: Middle East & Africa US LiFi Devices Industry Volume Share (%), by Cities 2024 & 2032
- Figure 59: Middle East & Africa US LiFi Devices Industry Revenue (Million), by Estimated Usage 2024 & 2032
- Figure 60: Middle East & Africa US LiFi Devices Industry Volume (K Units), by Estimated Usage 2024 & 2032
- Figure 61: Middle East & Africa US LiFi Devices Industry Revenue Share (%), by Estimated Usage 2024 & 2032
- Figure 62: Middle East & Africa US LiFi Devices Industry Volume Share (%), by Estimated Usage 2024 & 2032
- Figure 63: Middle East & Africa US LiFi Devices Industry Revenue (Million), by Types 2024 & 2032
- Figure 64: Middle East & Africa US LiFi Devices Industry Volume (K Units), by Types 2024 & 2032
- Figure 65: Middle East & Africa US LiFi Devices Industry Revenue Share (%), by Types 2024 & 2032
- Figure 66: Middle East & Africa US LiFi Devices Industry Volume Share (%), by Types 2024 & 2032
- Figure 67: Middle East & Africa US LiFi Devices Industry Revenue (Million), by Country 2024 & 2032
- Figure 68: Middle East & Africa US LiFi Devices Industry Volume (K Units), by Country 2024 & 2032
- Figure 69: Middle East & Africa US LiFi Devices Industry Revenue Share (%), by Country 2024 & 2032
- Figure 70: Middle East & Africa US LiFi Devices Industry Volume Share (%), by Country 2024 & 2032
- Figure 71: Asia Pacific US LiFi Devices Industry Revenue (Million), by Cities 2024 & 2032
- Figure 72: Asia Pacific US LiFi Devices Industry Volume (K Units), by Cities 2024 & 2032
- Figure 73: Asia Pacific US LiFi Devices Industry Revenue Share (%), by Cities 2024 & 2032
- Figure 74: Asia Pacific US LiFi Devices Industry Volume Share (%), by Cities 2024 & 2032
- Figure 75: Asia Pacific US LiFi Devices Industry Revenue (Million), by Estimated Usage 2024 & 2032
- Figure 76: Asia Pacific US LiFi Devices Industry Volume (K Units), by Estimated Usage 2024 & 2032
- Figure 77: Asia Pacific US LiFi Devices Industry Revenue Share (%), by Estimated Usage 2024 & 2032
- Figure 78: Asia Pacific US LiFi Devices Industry Volume Share (%), by Estimated Usage 2024 & 2032
- Figure 79: Asia Pacific US LiFi Devices Industry Revenue (Million), by Types 2024 & 2032
- Figure 80: Asia Pacific US LiFi Devices Industry Volume (K Units), by Types 2024 & 2032
- Figure 81: Asia Pacific US LiFi Devices Industry Revenue Share (%), by Types 2024 & 2032
- Figure 82: Asia Pacific US LiFi Devices Industry Volume Share (%), by Types 2024 & 2032
- Figure 83: Asia Pacific US LiFi Devices Industry Revenue (Million), by Country 2024 & 2032
- Figure 84: Asia Pacific US LiFi Devices Industry Volume (K Units), by Country 2024 & 2032
- Figure 85: Asia Pacific US LiFi Devices Industry Revenue Share (%), by Country 2024 & 2032
- Figure 86: Asia Pacific US LiFi Devices Industry Volume Share (%), by Country 2024 & 2032
List of Tables
- Table 1: Global US LiFi Devices Industry Revenue Million Forecast, by Region 2019 & 2032
- Table 2: Global US LiFi Devices Industry Volume K Units Forecast, by Region 2019 & 2032
- Table 3: Global US LiFi Devices Industry Revenue Million Forecast, by Cities 2019 & 2032
- Table 4: Global US LiFi Devices Industry Volume K Units Forecast, by Cities 2019 & 2032
- Table 5: Global US LiFi Devices Industry Revenue Million Forecast, by Estimated Usage 2019 & 2032
- Table 6: Global US LiFi Devices Industry Volume K Units Forecast, by Estimated Usage 2019 & 2032
- Table 7: Global US LiFi Devices Industry Revenue Million Forecast, by Types 2019 & 2032
- Table 8: Global US LiFi Devices Industry Volume K Units Forecast, by Types 2019 & 2032
- Table 9: Global US LiFi Devices Industry Revenue Million Forecast, by Region 2019 & 2032
- Table 10: Global US LiFi Devices Industry Volume K Units Forecast, by Region 2019 & 2032
- Table 11: Global US LiFi Devices Industry Revenue Million Forecast, by Country 2019 & 2032
- Table 12: Global US LiFi Devices Industry Volume K Units Forecast, by Country 2019 & 2032
- Table 13: Northeast US LiFi Devices Industry Revenue (Million) Forecast, by Application 2019 & 2032
- Table 14: Northeast US LiFi Devices Industry Volume (K Units) Forecast, by Application 2019 & 2032
- Table 15: Southeast US LiFi Devices Industry Revenue (Million) Forecast, by Application 2019 & 2032
- Table 16: Southeast US LiFi Devices Industry Volume (K Units) Forecast, by Application 2019 & 2032
- Table 17: Midwest US LiFi Devices Industry Revenue (Million) Forecast, by Application 2019 & 2032
- Table 18: Midwest US LiFi Devices Industry Volume (K Units) Forecast, by Application 2019 & 2032
- Table 19: Southwest US LiFi Devices Industry Revenue (Million) Forecast, by Application 2019 & 2032
- Table 20: Southwest US LiFi Devices Industry Volume (K Units) Forecast, by Application 2019 & 2032
- Table 21: West US LiFi Devices Industry Revenue (Million) Forecast, by Application 2019 & 2032
- Table 22: West US LiFi Devices Industry Volume (K Units) Forecast, by Application 2019 & 2032
- Table 23: Global US LiFi Devices Industry Revenue Million Forecast, by Cities 2019 & 2032
- Table 24: Global US LiFi Devices Industry Volume K Units Forecast, by Cities 2019 & 2032
- Table 25: Global US LiFi Devices Industry Revenue Million Forecast, by Estimated Usage 2019 & 2032
- Table 26: Global US LiFi Devices Industry Volume K Units Forecast, by Estimated Usage 2019 & 2032
- Table 27: Global US LiFi Devices Industry Revenue Million Forecast, by Types 2019 & 2032
- Table 28: Global US LiFi Devices Industry Volume K Units Forecast, by Types 2019 & 2032
- Table 29: Global US LiFi Devices Industry Revenue Million Forecast, by Country 2019 & 2032
- Table 30: Global US LiFi Devices Industry Volume K Units Forecast, by Country 2019 & 2032
- Table 31: United States US LiFi Devices Industry Revenue (Million) Forecast, by Application 2019 & 2032
- Table 32: United States US LiFi Devices Industry Volume (K Units) Forecast, by Application 2019 & 2032
- Table 33: Canada US LiFi Devices Industry Revenue (Million) Forecast, by Application 2019 & 2032
- Table 34: Canada US LiFi Devices Industry Volume (K Units) Forecast, by Application 2019 & 2032
- Table 35: Mexico US LiFi Devices Industry Revenue (Million) Forecast, by Application 2019 & 2032
- Table 36: Mexico US LiFi Devices Industry Volume (K Units) Forecast, by Application 2019 & 2032
- Table 37: Global US LiFi Devices Industry Revenue Million Forecast, by Cities 2019 & 2032
- Table 38: Global US LiFi Devices Industry Volume K Units Forecast, by Cities 2019 & 2032
- Table 39: Global US LiFi Devices Industry Revenue Million Forecast, by Estimated Usage 2019 & 2032
- Table 40: Global US LiFi Devices Industry Volume K Units Forecast, by Estimated Usage 2019 & 2032
- Table 41: Global US LiFi Devices Industry Revenue Million Forecast, by Types 2019 & 2032
- Table 42: Global US LiFi Devices Industry Volume K Units Forecast, by Types 2019 & 2032
- Table 43: Global US LiFi Devices Industry Revenue Million Forecast, by Country 2019 & 2032
- Table 44: Global US LiFi Devices Industry Volume K Units Forecast, by Country 2019 & 2032
- Table 45: Brazil US LiFi Devices Industry Revenue (Million) Forecast, by Application 2019 & 2032
- Table 46: Brazil US LiFi Devices Industry Volume (K Units) Forecast, by Application 2019 & 2032
- Table 47: Argentina US LiFi Devices Industry Revenue (Million) Forecast, by Application 2019 & 2032
- Table 48: Argentina US LiFi Devices Industry Volume (K Units) Forecast, by Application 2019 & 2032
- Table 49: Rest of South America US LiFi Devices Industry Revenue (Million) Forecast, by Application 2019 & 2032
- Table 50: Rest of South America US LiFi Devices Industry Volume (K Units) Forecast, by Application 2019 & 2032
- Table 51: Global US LiFi Devices Industry Revenue Million Forecast, by Cities 2019 & 2032
- Table 52: Global US LiFi Devices Industry Volume K Units Forecast, by Cities 2019 & 2032
- Table 53: Global US LiFi Devices Industry Revenue Million Forecast, by Estimated Usage 2019 & 2032
- Table 54: Global US LiFi Devices Industry Volume K Units Forecast, by Estimated Usage 2019 & 2032
- Table 55: Global US LiFi Devices Industry Revenue Million Forecast, by Types 2019 & 2032
- Table 56: Global US LiFi Devices Industry Volume K Units Forecast, by Types 2019 & 2032
- Table 57: Global US LiFi Devices Industry Revenue Million Forecast, by Country 2019 & 2032
- Table 58: Global US LiFi Devices Industry Volume K Units Forecast, by Country 2019 & 2032
- Table 59: United Kingdom US LiFi Devices Industry Revenue (Million) Forecast, by Application 2019 & 2032
- Table 60: United Kingdom US LiFi Devices Industry Volume (K Units) Forecast, by Application 2019 & 2032
- Table 61: Germany US LiFi Devices Industry Revenue (Million) Forecast, by Application 2019 & 2032
- Table 62: Germany US LiFi Devices Industry Volume (K Units) Forecast, by Application 2019 & 2032
- Table 63: France US LiFi Devices Industry Revenue (Million) Forecast, by Application 2019 & 2032
- Table 64: France US LiFi Devices Industry Volume (K Units) Forecast, by Application 2019 & 2032
- Table 65: Italy US LiFi Devices Industry Revenue (Million) Forecast, by Application 2019 & 2032
- Table 66: Italy US LiFi Devices Industry Volume (K Units) Forecast, by Application 2019 & 2032
- Table 67: Spain US LiFi Devices Industry Revenue (Million) Forecast, by Application 2019 & 2032
- Table 68: Spain US LiFi Devices Industry Volume (K Units) Forecast, by Application 2019 & 2032
- Table 69: Russia US LiFi Devices Industry Revenue (Million) Forecast, by Application 2019 & 2032
- Table 70: Russia US LiFi Devices Industry Volume (K Units) Forecast, by Application 2019 & 2032
- Table 71: Benelux US LiFi Devices Industry Revenue (Million) Forecast, by Application 2019 & 2032
- Table 72: Benelux US LiFi Devices Industry Volume (K Units) Forecast, by Application 2019 & 2032
- Table 73: Nordics US LiFi Devices Industry Revenue (Million) Forecast, by Application 2019 & 2032
- Table 74: Nordics US LiFi Devices Industry Volume (K Units) Forecast, by Application 2019 & 2032
- Table 75: Rest of Europe US LiFi Devices Industry Revenue (Million) Forecast, by Application 2019 & 2032
- Table 76: Rest of Europe US LiFi Devices Industry Volume (K Units) Forecast, by Application 2019 & 2032
- Table 77: Global US LiFi Devices Industry Revenue Million Forecast, by Cities 2019 & 2032
- Table 78: Global US LiFi Devices Industry Volume K Units Forecast, by Cities 2019 & 2032
- Table 79: Global US LiFi Devices Industry Revenue Million Forecast, by Estimated Usage 2019 & 2032
- Table 80: Global US LiFi Devices Industry Volume K Units Forecast, by Estimated Usage 2019 & 2032
- Table 81: Global US LiFi Devices Industry Revenue Million Forecast, by Types 2019 & 2032
- Table 82: Global US LiFi Devices Industry Volume K Units Forecast, by Types 2019 & 2032
- Table 83: Global US LiFi Devices Industry Revenue Million Forecast, by Country 2019 & 2032
- Table 84: Global US LiFi Devices Industry Volume K Units Forecast, by Country 2019 & 2032
- Table 85: Turkey US LiFi Devices Industry Revenue (Million) Forecast, by Application 2019 & 2032
- Table 86: Turkey US LiFi Devices Industry Volume (K Units) Forecast, by Application 2019 & 2032
- Table 87: Israel US LiFi Devices Industry Revenue (Million) Forecast, by Application 2019 & 2032
- Table 88: Israel US LiFi Devices Industry Volume (K Units) Forecast, by Application 2019 & 2032
- Table 89: GCC US LiFi Devices Industry Revenue (Million) Forecast, by Application 2019 & 2032
- Table 90: GCC US LiFi Devices Industry Volume (K Units) Forecast, by Application 2019 & 2032
- Table 91: North Africa US LiFi Devices Industry Revenue (Million) Forecast, by Application 2019 & 2032
- Table 92: North Africa US LiFi Devices Industry Volume (K Units) Forecast, by Application 2019 & 2032
- Table 93: South Africa US LiFi Devices Industry Revenue (Million) Forecast, by Application 2019 & 2032
- Table 94: South Africa US LiFi Devices Industry Volume (K Units) Forecast, by Application 2019 & 2032
- Table 95: Rest of Middle East & Africa US LiFi Devices Industry Revenue (Million) Forecast, by Application 2019 & 2032
- Table 96: Rest of Middle East & Africa US LiFi Devices Industry Volume (K Units) Forecast, by Application 2019 & 2032
- Table 97: Global US LiFi Devices Industry Revenue Million Forecast, by Cities 2019 & 2032
- Table 98: Global US LiFi Devices Industry Volume K Units Forecast, by Cities 2019 & 2032
- Table 99: Global US LiFi Devices Industry Revenue Million Forecast, by Estimated Usage 2019 & 2032
- Table 100: Global US LiFi Devices Industry Volume K Units Forecast, by Estimated Usage 2019 & 2032
- Table 101: Global US LiFi Devices Industry Revenue Million Forecast, by Types 2019 & 2032
- Table 102: Global US LiFi Devices Industry Volume K Units Forecast, by Types 2019 & 2032
- Table 103: Global US LiFi Devices Industry Revenue Million Forecast, by Country 2019 & 2032
- Table 104: Global US LiFi Devices Industry Volume K Units Forecast, by Country 2019 & 2032
- Table 105: China US LiFi Devices Industry Revenue (Million) Forecast, by Application 2019 & 2032
- Table 106: China US LiFi Devices Industry Volume (K Units) Forecast, by Application 2019 & 2032
- Table 107: India US LiFi Devices Industry Revenue (Million) Forecast, by Application 2019 & 2032
- Table 108: India US LiFi Devices Industry Volume (K Units) Forecast, by Application 2019 & 2032
- Table 109: Japan US LiFi Devices Industry Revenue (Million) Forecast, by Application 2019 & 2032
- Table 110: Japan US LiFi Devices Industry Volume (K Units) Forecast, by Application 2019 & 2032
- Table 111: South Korea US LiFi Devices Industry Revenue (Million) Forecast, by Application 2019 & 2032
- Table 112: South Korea US LiFi Devices Industry Volume (K Units) Forecast, by Application 2019 & 2032
- Table 113: ASEAN US LiFi Devices Industry Revenue (Million) Forecast, by Application 2019 & 2032
- Table 114: ASEAN US LiFi Devices Industry Volume (K Units) Forecast, by Application 2019 & 2032
- Table 115: Oceania US LiFi Devices Industry Revenue (Million) Forecast, by Application 2019 & 2032
- Table 116: Oceania US LiFi Devices Industry Volume (K Units) Forecast, by Application 2019 & 2032
- Table 117: Rest of Asia Pacific US LiFi Devices Industry Revenue (Million) Forecast, by Application 2019 & 2032
- Table 118: Rest of Asia Pacific US LiFi Devices Industry Volume (K Units) Forecast, by Application 2019 & 2032
Frequently Asked Questions
1. What is the projected Compound Annual Growth Rate (CAGR) of the US LiFi Devices Industry?
The projected CAGR is approximately 67.50%.
2. Which companies are prominent players in the US LiFi Devices Industry?
Key companies in the market include Signify, LiFi Labs, Oledcomm.
3. What are the main segments of the US LiFi Devices Industry?
The market segments include Cities, Estimated Usage, Types.
4. Can you provide details about the market size?
The market size is estimated to be USD XX Million as of 2022.
5. What are some drivers contributing to market growth?
Huge Demand for Specialized Internet Technologies; Low Energy Consumption; Faster and Safe Data Transfer; High Bandwidth; Vast Applications.
6. What are the notable trends driving market growth?
LED Segment is Expected to Register a Significant Growth Rate.
7. Are there any restraints impacting market growth?
Limited Range; Cannot Substitute Wi-Fi Completely; Scattered Internet Penetration; Transmission can be Easily Disrupted.
8. Can you provide examples of recent developments in the market?
September 2023 - Getac announced it has embedded LiFi technology into rugged devices as part of an innovation project with Signify, one of the global leaders in lighting. Getac is working closely with Signify's Trulifi technology on the project to bring LiFi technology to its customers.
9. What pricing options are available for accessing the report?
Pricing options include single-user, multi-user, and enterprise licenses priced at USD 3800, USD 4500, and USD 5800 respectively.
10. Is the market size provided in terms of value or volume?
The market size is provided in terms of value, measured in Million and volume, measured in K Units.
11. Are there any specific market keywords associated with the report?
Yes, the market keyword associated with the report is "US LiFi Devices Industry," which aids in identifying and referencing the specific market segment covered.
12. How do I determine which pricing option suits my needs best?
The pricing options vary based on user requirements and access needs. Individual users may opt for single-user licenses, while businesses requiring broader access may choose multi-user or enterprise licenses for cost-effective access to the report.
13. Are there any additional resources or data provided in the US LiFi Devices Industry report?
While the report offers comprehensive insights, it's advisable to review the specific contents or supplementary materials provided to ascertain if additional resources or data are available.
14. How can I stay updated on further developments or reports in the US LiFi Devices Industry?
To stay informed about further developments, trends, and reports in the US LiFi Devices Industry, consider subscribing to industry newsletters, following relevant companies and organizations, or regularly checking reputable industry news sources and publications.
Methodology
Step 1 - Identification of Relevant Samples Size from Population Database


Step 2 - Approaches for Defining Global Market Size (Value, Volume* & Price*)

Note*: In applicable scenarios
Step 3 - Data Sources
Primary Research
- Web Analytics
- Survey Reports
- Research Institute
- Latest Research Reports
- Opinion Leaders
Secondary Research
- Annual Reports
- White Paper
- Latest Press Release
- Industry Association
- Paid Database
- Investor Presentations

Step 4 - Data Triangulation
Involves using different sources of information in order to increase the validity of a study
These sources are likely to be stakeholders in a program - participants, other researchers, program staff, other community members, and so on.
Then we put all data in single framework & apply various statistical tools to find out the dynamic on the market.
During the analysis stage, feedback from the stakeholder groups would be compared to determine areas of agreement as well as areas of divergence


