

Key Insights
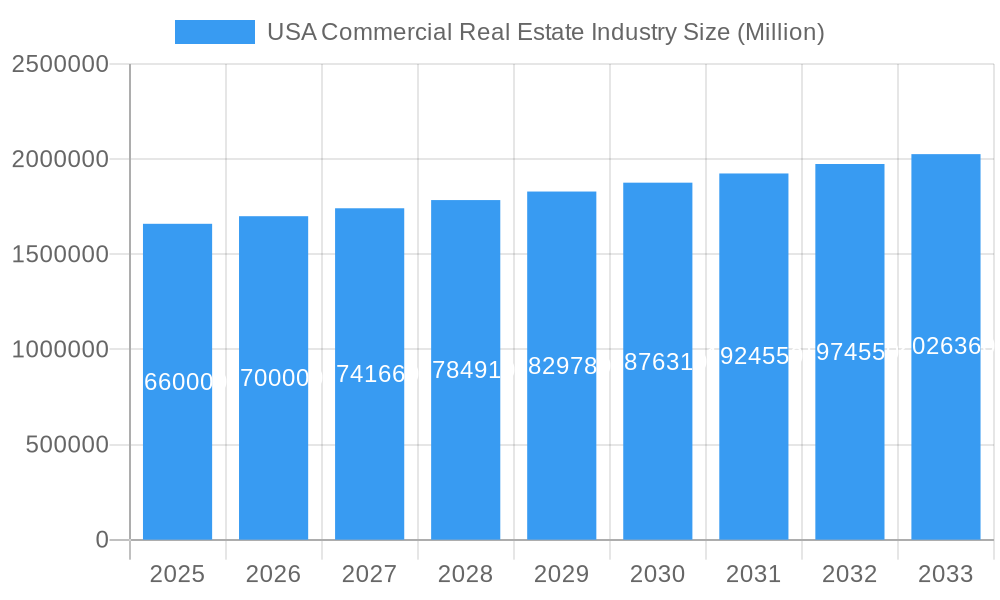
The US commercial real estate (CRE) market, valued at $1.66 trillion in 2025, is projected to experience steady growth, with a compound annual growth rate (CAGR) of 2.61% from 2025 to 2033. This growth is driven by several factors, including a robust economy (pre-2020 levels adjusted for current market conditions), increasing demand for modern office spaces from technology and finance sectors, the ongoing expansion of e-commerce fueling the logistics and industrial sectors, and a persistent need for multi-family housing across major cities. The market's segmentation reveals significant opportunities across various property types: offices, retail, industrial, logistics, multi-family, and hospitality. Key cities like New York, Los Angeles, and San Francisco, along with emerging markets like Denver and Atlanta, contribute significantly to the overall market size. However, the market faces challenges, such as rising interest rates impacting financing costs, potential economic downturns affecting investor confidence, and ongoing shifts in consumer preferences that may impact retail and office spaces. The competitive landscape is characterized by a mix of large, established players and smaller, niche firms. This creates both opportunities for consolidation and innovation within the sector.
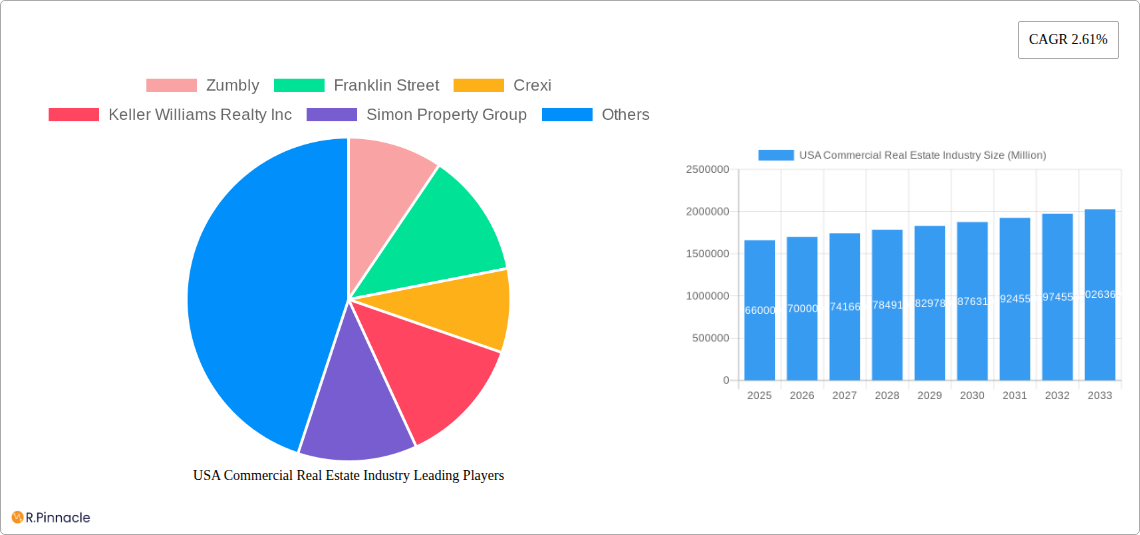
USA Commercial Real Estate Industry Market Size (In Million)
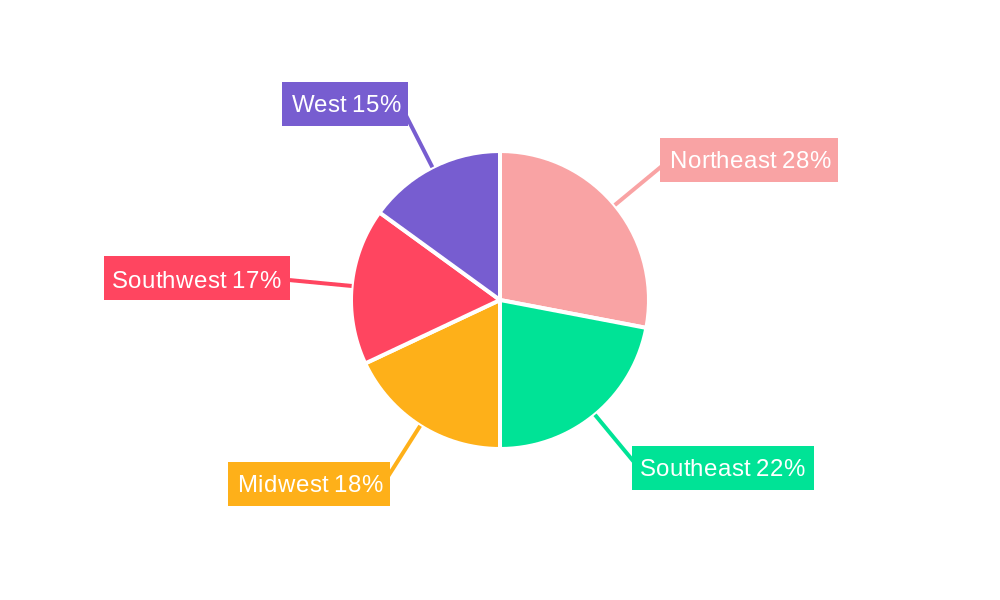
The forecast period (2025-2033) suggests a continued expansion of the CRE market, albeit at a moderate pace given potential economic headwinds. Strategic acquisitions, technological advancements (proptech), and adaptability to evolving market demands will be crucial for success. Regions such as the Northeast and West, with established economic hubs, are expected to maintain substantial market share. However, the Southeast and Southwest are also projected to experience growth, driven by population migration and economic diversification. Understanding these regional nuances and market drivers will be critical for investors and developers navigating the complexities of this dynamic market. The market is further segmented by property type; office spaces are expected to see continued demand from technology companies, while industrial and logistics properties benefit from the ongoing e-commerce boom. The multi-family sector will remain strong due to continued population growth and urbanization.
USA Commercial Real Estate Industry Company Market Share
This comprehensive report provides an in-depth analysis of the USA Commercial Real Estate industry, covering market structure, dynamics, key players, and future outlook from 2019 to 2033. The report leverages a robust dataset to deliver actionable insights for industry professionals, investors, and strategists. Base Year: 2025; Estimated Year: 2025; Forecast Period: 2025-2033; Historical Period: 2019-2024.
USA Commercial Real Estate Industry Market Structure & Innovation Trends
This section analyzes the competitive landscape of the US commercial real estate market, identifying key trends and influencing factors. We examine market concentration, pinpointing the market share held by major players and exploring the impact of mergers and acquisitions (M&A) activity. The report details the regulatory framework governing the industry and assesses the influence of technological innovations and substitute products. Finally, we profile end-user demographics and their evolving needs.
Market Concentration: The US commercial real estate market exhibits a moderately concentrated structure, with a few large players commanding significant market share, while numerous smaller firms operate within specific niches. XX% of the market is controlled by the top 5 players in 2025, with an estimated XX% CAGR from 2025-2033.
M&A Activity: The period 2019-2024 witnessed significant M&A activity, with a total deal value exceeding $XX Million. This trend is projected to continue, driven by consolidation efforts and strategic expansion.
Innovation Drivers: Technological advancements, such as PropTech solutions and data analytics, are transforming the industry, improving efficiency and transparency. Stringent environmental regulations are pushing for sustainable building practices, impacting construction and operational strategies.
Regulatory Framework: Federal, state, and local regulations significantly impact development, zoning, and environmental compliance. Changes in these regulations can influence market dynamics and investment decisions.
USA Commercial Real Estate Industry Market Dynamics & Trends
This section delves into the key market dynamics driving growth and shaping the competitive landscape. We analyze market growth drivers, technological disruptions impacting operations and transactions, evolving consumer preferences, and competitive dynamics influencing strategic decisions. The report includes specific metrics such as the Compound Annual Growth Rate (CAGR) and market penetration rates for key segments.
The market is experiencing strong growth fueled by a robust economy, increasing urbanization, and the demand for modern, sustainable commercial spaces. Technological innovations like smart building technologies and digital platforms are streamlining operations and enhancing tenant experiences. The increasing importance of sustainability and ESG (Environmental, Social, and Governance) considerations is reshaping industry practices. Intense competition among established players and new entrants is driving innovation and efficiency gains. The CAGR for the overall market is estimated at XX% from 2025-2033, driven primarily by the industrial and multifamily segments. Market penetration of PropTech solutions is expected to reach XX% by 2033.
Dominant Regions & Segments in USA Commercial Real Estate Industry
This section identifies the leading regions and segments within the US commercial real estate market. A detailed analysis reveals the key drivers of dominance for each region and segment.
Dominant Regions:
- New York: High demand, strong economy, and limited supply drive high property values and rental rates.
- Los Angeles: A large and diverse economy, coupled with a growing population, supports strong demand across various property types.
- San Francisco: A technology hub with high demand for office and residential spaces, resulting in premium pricing.
- (Other cities follow a similar pattern of analysis)
Dominant Segments:
Industrial/Logistics: E-commerce growth fuels high demand for warehouse and distribution facilities.
Multi-family: Urbanization and population growth drive demand for apartments and rental units.
(Other segments are analyzed similarly, considering factors like economic activity, population trends and infrastructure development.)
Key Drivers (Examples): Strong economic growth, favorable demographic trends, technological advancements, increasing urbanization, government incentives for infrastructure development.
USA Commercial Real Estate Industry Product Innovations
Recent innovations include the development of smart building technologies that enhance energy efficiency and tenant experience. The adoption of data analytics tools for predictive maintenance and informed decision-making is also transforming industry practices. These innovations are improving efficiency, reducing costs, and enhancing the appeal of commercial properties in a competitive market. The integration of sustainable building materials and green technologies is gaining traction, driven by environmental concerns and regulatory requirements.
Report Scope & Segmentation Analysis
This report segments the US commercial real estate market by property type (Offices, Retail, Industrial, Logistics, Multi-family, Hospitality) and key city (New York, Chicago, Los Angeles, San Francisco, Boston, Denver, Houston, Phoenix, Atlanta, Salt Lake City). Each segment's growth projections, market size estimates, and competitive dynamics are detailed. For example, the industrial/logistics segment is expected to experience significant growth due to e-commerce expansion, with a projected market size of $XX Million by 2033. The New York office market remains highly competitive with premium pricing due to limited supply and high demand.
Key Drivers of USA Commercial Real Estate Industry Growth
Several factors drive the growth of the US commercial real estate industry. A robust economy generates demand for commercial spaces, while technological advancements like smart building technologies enhance efficiency and tenant satisfaction. Favorable government policies that support infrastructure development and investment also contribute to market expansion. Moreover, urbanization and population growth fuel the demand for both residential and commercial properties in major metropolitan areas.
Challenges in the USA Commercial Real Estate Industry Sector
The industry faces challenges such as rising construction costs, supply chain disruptions impacting material availability and project timelines, and intensifying competition from both established and new market players. Regulatory hurdles and environmental concerns also impact project development and feasibility. These factors can lead to project delays, increased costs, and reduced profitability. For instance, supply chain issues in 2022 resulted in a xx% increase in construction costs, impacting project profitability.
Emerging Opportunities in USA Commercial Real Estate Industry
The industry is witnessing several emerging opportunities. The growing adoption of sustainable and green building practices presents a significant opportunity for developers and investors. The expansion of e-commerce and the growth of logistics and warehousing offer substantial potential for investment. Moreover, technological advancements like PropTech solutions continue to improve efficiency and unlock new revenue streams. The increasing focus on ESG (Environmental, Social, and Governance) criteria opens up new investment avenues for sustainable real estate development.
Leading Players in the USA Commercial Real Estate Industry Market
- Zumbly
- Franklin Street
- Crexi
- Keller Williams Realty Inc
- Simon Property Group
- Hightower
- Mohr Partners
- Lamudi
- Coldwell Banker
- ERA Real Estate
- RE/MAX
- John Propp Commercial Group
- HqO
- Century
- Progressive Real Estate Partners
- Shannon-Waltchack
(List Not Exhaustive)
Key Developments in USA Commercial Real Estate Industry Industry
- 2022 Q4: Increased interest rates led to a slowdown in transaction volumes.
- 2023 Q1: Several large M&A deals were announced, consolidating market share among major players.
- 2023 Q2: Introduction of new PropTech solutions to enhance property management and tenant engagement.
- (Further developments with specific dates and impacts will be included in the full report.)
Future Outlook for USA Commercial Real Estate Industry Market
The US commercial real estate market is poised for continued growth, driven by strong economic fundamentals, technological innovation, and evolving consumer preferences. Strategic opportunities exist in sustainable development, technology integration, and data-driven decision-making. The focus on ESG factors will continue to shape investment strategies and development practices, creating new opportunities for growth and value creation. The market's long-term outlook remains positive, with significant growth potential across various segments and geographic regions.
USA Commercial Real Estate Industry Segmentation
-
1. Type
- 1.1. Offices
- 1.2. Retail
- 1.3. Industrial
- 1.4. Logistics
- 1.5. Multi-family
- 1.6. Hospitality
-
2. Key City
- 2.1. New York
- 2.2. Chicago
- 2.3. Los Angeles
- 2.4. San Francisco
- 2.5. Boston
- 2.6. Denver
- 2.7. Houston
- 2.8. Phoenix
- 2.9. Atlanta
- 2.10. Salt Lake City
USA Commercial Real Estate Industry Segmentation By Geography
-
1. North America
- 1.1. United States
- 1.2. Canada
- 1.3. Mexico
-
2. South America
- 2.1. Brazil
- 2.2. Argentina
- 2.3. Rest of South America
-
3. Europe
- 3.1. United Kingdom
- 3.2. Germany
- 3.3. France
- 3.4. Italy
- 3.5. Spain
- 3.6. Russia
- 3.7. Benelux
- 3.8. Nordics
- 3.9. Rest of Europe
-
4. Middle East & Africa
- 4.1. Turkey
- 4.2. Israel
- 4.3. GCC
- 4.4. North Africa
- 4.5. South Africa
- 4.6. Rest of Middle East & Africa
-
5. Asia Pacific
- 5.1. China
- 5.2. India
- 5.3. Japan
- 5.4. South Korea
- 5.5. ASEAN
- 5.6. Oceania
- 5.7. Rest of Asia Pacific
USA Commercial Real Estate Industry Regional Market Share
Geographic Coverage of USA Commercial Real Estate Industry
USA Commercial Real Estate Industry REPORT HIGHLIGHTS
| Aspects | Details |
|---|---|
| Study Period | 2020-2034 |
| Base Year | 2025 |
| Estimated Year | 2026 |
| Forecast Period | 2026-2034 |
| Historical Period | 2020-2025 |
| Growth Rate | CAGR of 2.61% from 2020-2034 |
| Segmentation |
|
Table of Contents
- 1. Introduction
- 1.1. Research Scope
- 1.2. Market Segmentation
- 1.3. Research Objective
- 1.4. Definitions and Assumptions
- 2. Executive Summary
- 2.1. Market Snapshot
- 3. Market Dynamics
- 3.1. Market Drivers
- 3.2. Market Restrains
- 3.3. Market Trends
- 3.4. Market Opportunities
- 4. Market Factor Analysis
- 4.1. Porters Five Forces
- 4.1.1. Bargaining Power of Suppliers
- 4.1.2. Bargaining Power of Buyers
- 4.1.3. Threat of New Entrants
- 4.1.4. Threat of Substitutes
- 4.1.5. Competitive Rivalry
- 4.2. PESTEL analysis
- 4.3. BCG Analysis
- 4.3.1. Stars (High Growth, High Market Share)
- 4.3.2. Cash Cows (Low Growth, High Market Share)
- 4.3.3. Question Mark (High Growth, Low Market Share)
- 4.3.4. Dogs (Low Growth, Low Market Share)
- 4.4. Ansoff Matrix Analysis
- 4.5. Supply Chain Analysis
- 4.6. Regulatory Landscape
- 4.7. Current Market Potential and Opportunity Assessment (TAM–SAM–SOM Framework)
- 4.8. PRI Analyst Note
- 4.1. Porters Five Forces
- 5. Market Analysis, Insights and Forecast 2021-2033
- 5.1. Market Analysis, Insights and Forecast - by Type
- 5.1.1. Offices
- 5.1.2. Retail
- 5.1.3. Industrial
- 5.1.4. Logistics
- 5.1.5. Multi-family
- 5.1.6. Hospitality
- 5.2. Market Analysis, Insights and Forecast - by Key City
- 5.2.1. New York
- 5.2.2. Chicago
- 5.2.3. Los Angeles
- 5.2.4. San Francisco
- 5.2.5. Boston
- 5.2.6. Denver
- 5.2.7. Houston
- 5.2.8. Phoenix
- 5.2.9. Atlanta
- 5.2.10. Salt Lake City
- 5.3. Market Analysis, Insights and Forecast - by Region
- 5.3.1. North America
- 5.3.2. South America
- 5.3.3. Europe
- 5.3.4. Middle East & Africa
- 5.3.5. Asia Pacific
- 5.1. Market Analysis, Insights and Forecast - by Type
- 6. Global USA Commercial Real Estate Industry Analysis, Insights and Forecast, 2021-2033
- 6.1. Market Analysis, Insights and Forecast - by Type
- 6.1.1. Offices
- 6.1.2. Retail
- 6.1.3. Industrial
- 6.1.4. Logistics
- 6.1.5. Multi-family
- 6.1.6. Hospitality
- 6.2. Market Analysis, Insights and Forecast - by Key City
- 6.2.1. New York
- 6.2.2. Chicago
- 6.2.3. Los Angeles
- 6.2.4. San Francisco
- 6.2.5. Boston
- 6.2.6. Denver
- 6.2.7. Houston
- 6.2.8. Phoenix
- 6.2.9. Atlanta
- 6.2.10. Salt Lake City
- 6.1. Market Analysis, Insights and Forecast - by Type
- 7. North America USA Commercial Real Estate Industry Analysis, Insights and Forecast, 2020-2032
- 7.1. Market Analysis, Insights and Forecast - by Type
- 7.1.1. Offices
- 7.1.2. Retail
- 7.1.3. Industrial
- 7.1.4. Logistics
- 7.1.5. Multi-family
- 7.1.6. Hospitality
- 7.2. Market Analysis, Insights and Forecast - by Key City
- 7.2.1. New York
- 7.2.2. Chicago
- 7.2.3. Los Angeles
- 7.2.4. San Francisco
- 7.2.5. Boston
- 7.2.6. Denver
- 7.2.7. Houston
- 7.2.8. Phoenix
- 7.2.9. Atlanta
- 7.2.10. Salt Lake City
- 7.1. Market Analysis, Insights and Forecast - by Type
- 8. South America USA Commercial Real Estate Industry Analysis, Insights and Forecast, 2020-2032
- 8.1. Market Analysis, Insights and Forecast - by Type
- 8.1.1. Offices
- 8.1.2. Retail
- 8.1.3. Industrial
- 8.1.4. Logistics
- 8.1.5. Multi-family
- 8.1.6. Hospitality
- 8.2. Market Analysis, Insights and Forecast - by Key City
- 8.2.1. New York
- 8.2.2. Chicago
- 8.2.3. Los Angeles
- 8.2.4. San Francisco
- 8.2.5. Boston
- 8.2.6. Denver
- 8.2.7. Houston
- 8.2.8. Phoenix
- 8.2.9. Atlanta
- 8.2.10. Salt Lake City
- 8.1. Market Analysis, Insights and Forecast - by Type
- 9. Europe USA Commercial Real Estate Industry Analysis, Insights and Forecast, 2020-2032
- 9.1. Market Analysis, Insights and Forecast - by Type
- 9.1.1. Offices
- 9.1.2. Retail
- 9.1.3. Industrial
- 9.1.4. Logistics
- 9.1.5. Multi-family
- 9.1.6. Hospitality
- 9.2. Market Analysis, Insights and Forecast - by Key City
- 9.2.1. New York
- 9.2.2. Chicago
- 9.2.3. Los Angeles
- 9.2.4. San Francisco
- 9.2.5. Boston
- 9.2.6. Denver
- 9.2.7. Houston
- 9.2.8. Phoenix
- 9.2.9. Atlanta
- 9.2.10. Salt Lake City
- 9.1. Market Analysis, Insights and Forecast - by Type
- 10. Middle East & Africa USA Commercial Real Estate Industry Analysis, Insights and Forecast, 2020-2032
- 10.1. Market Analysis, Insights and Forecast - by Type
- 10.1.1. Offices
- 10.1.2. Retail
- 10.1.3. Industrial
- 10.1.4. Logistics
- 10.1.5. Multi-family
- 10.1.6. Hospitality
- 10.2. Market Analysis, Insights and Forecast - by Key City
- 10.2.1. New York
- 10.2.2. Chicago
- 10.2.3. Los Angeles
- 10.2.4. San Francisco
- 10.2.5. Boston
- 10.2.6. Denver
- 10.2.7. Houston
- 10.2.8. Phoenix
- 10.2.9. Atlanta
- 10.2.10. Salt Lake City
- 10.1. Market Analysis, Insights and Forecast - by Type
- 11. Asia Pacific USA Commercial Real Estate Industry Analysis, Insights and Forecast, 2020-2032
- 11.1. Market Analysis, Insights and Forecast - by Type
- 11.1.1. Offices
- 11.1.2. Retail
- 11.1.3. Industrial
- 11.1.4. Logistics
- 11.1.5. Multi-family
- 11.1.6. Hospitality
- 11.2. Market Analysis, Insights and Forecast - by Key City
- 11.2.1. New York
- 11.2.2. Chicago
- 11.2.3. Los Angeles
- 11.2.4. San Francisco
- 11.2.5. Boston
- 11.2.6. Denver
- 11.2.7. Houston
- 11.2.8. Phoenix
- 11.2.9. Atlanta
- 11.2.10. Salt Lake City
- 11.1. Market Analysis, Insights and Forecast - by Type
- 12. Competitive Analysis
- 12.1. Company Profiles
- 12.1.1 Zumbly
- 12.1.1.1. Company Overview
- 12.1.1.2. Products
- 12.1.1.3. Company Financials
- 12.1.1.4. SWOT Analysis
- 12.1.2 Franklin Street
- 12.1.2.1. Company Overview
- 12.1.2.2. Products
- 12.1.2.3. Company Financials
- 12.1.2.4. SWOT Analysis
- 12.1.3 Crexi
- 12.1.3.1. Company Overview
- 12.1.3.2. Products
- 12.1.3.3. Company Financials
- 12.1.3.4. SWOT Analysis
- 12.1.4 Keller Williams Realty Inc
- 12.1.4.1. Company Overview
- 12.1.4.2. Products
- 12.1.4.3. Company Financials
- 12.1.4.4. SWOT Analysis
- 12.1.5 Simon Property Group
- 12.1.5.1. Company Overview
- 12.1.5.2. Products
- 12.1.5.3. Company Financials
- 12.1.5.4. SWOT Analysis
- 12.1.6 Hightower
- 12.1.6.1. Company Overview
- 12.1.6.2. Products
- 12.1.6.3. Company Financials
- 12.1.6.4. SWOT Analysis
- 12.1.7 Mohr Partners
- 12.1.7.1. Company Overview
- 12.1.7.2. Products
- 12.1.7.3. Company Financials
- 12.1.7.4. SWOT Analysis
- 12.1.8 Lamudi
- 12.1.8.1. Company Overview
- 12.1.8.2. Products
- 12.1.8.3. Company Financials
- 12.1.8.4. SWOT Analysis
- 12.1.9 Coldwell Banker
- 12.1.9.1. Company Overview
- 12.1.9.2. Products
- 12.1.9.3. Company Financials
- 12.1.9.4. SWOT Analysis
- 12.1.10 ERA Real Estate
- 12.1.10.1. Company Overview
- 12.1.10.2. Products
- 12.1.10.3. Company Financials
- 12.1.10.4. SWOT Analysis
- 12.1.11 RE/MAX
- 12.1.11.1. Company Overview
- 12.1.11.2. Products
- 12.1.11.3. Company Financials
- 12.1.11.4. SWOT Analysis
- 12.1.12 John Propp Commercial Group
- 12.1.12.1. Company Overview
- 12.1.12.2. Products
- 12.1.12.3. Company Financials
- 12.1.12.4. SWOT Analysis
- 12.1.13 HqO**List Not Exhaustive
- 12.1.13.1. Company Overview
- 12.1.13.2. Products
- 12.1.13.3. Company Financials
- 12.1.13.4. SWOT Analysis
- 12.1.14 Century
- 12.1.14.1. Company Overview
- 12.1.14.2. Products
- 12.1.14.3. Company Financials
- 12.1.14.4. SWOT Analysis
- 12.1.15 Progressive Real Estate Partners
- 12.1.15.1. Company Overview
- 12.1.15.2. Products
- 12.1.15.3. Company Financials
- 12.1.15.4. SWOT Analysis
- 12.1.16 Shannon-Waltchack
- 12.1.16.1. Company Overview
- 12.1.16.2. Products
- 12.1.16.3. Company Financials
- 12.1.16.4. SWOT Analysis
- 12.1.1 Zumbly
- 12.2. Market Entropy
- 12.2.1 Company's Key Areas Served
- 12.2.2 Recent Developments
- 12.3. Company Market Share Analysis 2025
- 12.3.1 Top 5 Companies Market Share Analysis
- 12.3.2 Top 3 Companies Market Share Analysis
- 12.4. List of Potential Customers
- 13. Research Methodology
List of Figures
- Figure 1: Global USA Commercial Real Estate Industry Revenue Breakdown (Million, %) by Region 2025 & 2033
- Figure 2: North America USA Commercial Real Estate Industry Revenue (Million), by Type 2025 & 2033
- Figure 3: North America USA Commercial Real Estate Industry Revenue Share (%), by Type 2025 & 2033
- Figure 4: North America USA Commercial Real Estate Industry Revenue (Million), by Key City 2025 & 2033
- Figure 5: North America USA Commercial Real Estate Industry Revenue Share (%), by Key City 2025 & 2033
- Figure 6: North America USA Commercial Real Estate Industry Revenue (Million), by Country 2025 & 2033
- Figure 7: North America USA Commercial Real Estate Industry Revenue Share (%), by Country 2025 & 2033
- Figure 8: South America USA Commercial Real Estate Industry Revenue (Million), by Type 2025 & 2033
- Figure 9: South America USA Commercial Real Estate Industry Revenue Share (%), by Type 2025 & 2033
- Figure 10: South America USA Commercial Real Estate Industry Revenue (Million), by Key City 2025 & 2033
- Figure 11: South America USA Commercial Real Estate Industry Revenue Share (%), by Key City 2025 & 2033
- Figure 12: South America USA Commercial Real Estate Industry Revenue (Million), by Country 2025 & 2033
- Figure 13: South America USA Commercial Real Estate Industry Revenue Share (%), by Country 2025 & 2033
- Figure 14: Europe USA Commercial Real Estate Industry Revenue (Million), by Type 2025 & 2033
- Figure 15: Europe USA Commercial Real Estate Industry Revenue Share (%), by Type 2025 & 2033
- Figure 16: Europe USA Commercial Real Estate Industry Revenue (Million), by Key City 2025 & 2033
- Figure 17: Europe USA Commercial Real Estate Industry Revenue Share (%), by Key City 2025 & 2033
- Figure 18: Europe USA Commercial Real Estate Industry Revenue (Million), by Country 2025 & 2033
- Figure 19: Europe USA Commercial Real Estate Industry Revenue Share (%), by Country 2025 & 2033
- Figure 20: Middle East & Africa USA Commercial Real Estate Industry Revenue (Million), by Type 2025 & 2033
- Figure 21: Middle East & Africa USA Commercial Real Estate Industry Revenue Share (%), by Type 2025 & 2033
- Figure 22: Middle East & Africa USA Commercial Real Estate Industry Revenue (Million), by Key City 2025 & 2033
- Figure 23: Middle East & Africa USA Commercial Real Estate Industry Revenue Share (%), by Key City 2025 & 2033
- Figure 24: Middle East & Africa USA Commercial Real Estate Industry Revenue (Million), by Country 2025 & 2033
- Figure 25: Middle East & Africa USA Commercial Real Estate Industry Revenue Share (%), by Country 2025 & 2033
- Figure 26: Asia Pacific USA Commercial Real Estate Industry Revenue (Million), by Type 2025 & 2033
- Figure 27: Asia Pacific USA Commercial Real Estate Industry Revenue Share (%), by Type 2025 & 2033
- Figure 28: Asia Pacific USA Commercial Real Estate Industry Revenue (Million), by Key City 2025 & 2033
- Figure 29: Asia Pacific USA Commercial Real Estate Industry Revenue Share (%), by Key City 2025 & 2033
- Figure 30: Asia Pacific USA Commercial Real Estate Industry Revenue (Million), by Country 2025 & 2033
- Figure 31: Asia Pacific USA Commercial Real Estate Industry Revenue Share (%), by Country 2025 & 2033
List of Tables
- Table 1: Global USA Commercial Real Estate Industry Revenue Million Forecast, by Type 2020 & 2033
- Table 2: Global USA Commercial Real Estate Industry Revenue Million Forecast, by Key City 2020 & 2033
- Table 3: Global USA Commercial Real Estate Industry Revenue Million Forecast, by Region 2020 & 2033
- Table 4: Global USA Commercial Real Estate Industry Revenue Million Forecast, by Type 2020 & 2033
- Table 5: Global USA Commercial Real Estate Industry Revenue Million Forecast, by Key City 2020 & 2033
- Table 6: Global USA Commercial Real Estate Industry Revenue Million Forecast, by Country 2020 & 2033
- Table 7: United States USA Commercial Real Estate Industry Revenue (Million) Forecast, by Application 2020 & 2033
- Table 8: Canada USA Commercial Real Estate Industry Revenue (Million) Forecast, by Application 2020 & 2033
- Table 9: Mexico USA Commercial Real Estate Industry Revenue (Million) Forecast, by Application 2020 & 2033
- Table 10: Global USA Commercial Real Estate Industry Revenue Million Forecast, by Type 2020 & 2033
- Table 11: Global USA Commercial Real Estate Industry Revenue Million Forecast, by Key City 2020 & 2033
- Table 12: Global USA Commercial Real Estate Industry Revenue Million Forecast, by Country 2020 & 2033
- Table 13: Brazil USA Commercial Real Estate Industry Revenue (Million) Forecast, by Application 2020 & 2033
- Table 14: Argentina USA Commercial Real Estate Industry Revenue (Million) Forecast, by Application 2020 & 2033
- Table 15: Rest of South America USA Commercial Real Estate Industry Revenue (Million) Forecast, by Application 2020 & 2033
- Table 16: Global USA Commercial Real Estate Industry Revenue Million Forecast, by Type 2020 & 2033
- Table 17: Global USA Commercial Real Estate Industry Revenue Million Forecast, by Key City 2020 & 2033
- Table 18: Global USA Commercial Real Estate Industry Revenue Million Forecast, by Country 2020 & 2033
- Table 19: United Kingdom USA Commercial Real Estate Industry Revenue (Million) Forecast, by Application 2020 & 2033
- Table 20: Germany USA Commercial Real Estate Industry Revenue (Million) Forecast, by Application 2020 & 2033
- Table 21: France USA Commercial Real Estate Industry Revenue (Million) Forecast, by Application 2020 & 2033
- Table 22: Italy USA Commercial Real Estate Industry Revenue (Million) Forecast, by Application 2020 & 2033
- Table 23: Spain USA Commercial Real Estate Industry Revenue (Million) Forecast, by Application 2020 & 2033
- Table 24: Russia USA Commercial Real Estate Industry Revenue (Million) Forecast, by Application 2020 & 2033
- Table 25: Benelux USA Commercial Real Estate Industry Revenue (Million) Forecast, by Application 2020 & 2033
- Table 26: Nordics USA Commercial Real Estate Industry Revenue (Million) Forecast, by Application 2020 & 2033
- Table 27: Rest of Europe USA Commercial Real Estate Industry Revenue (Million) Forecast, by Application 2020 & 2033
- Table 28: Global USA Commercial Real Estate Industry Revenue Million Forecast, by Type 2020 & 2033
- Table 29: Global USA Commercial Real Estate Industry Revenue Million Forecast, by Key City 2020 & 2033
- Table 30: Global USA Commercial Real Estate Industry Revenue Million Forecast, by Country 2020 & 2033
- Table 31: Turkey USA Commercial Real Estate Industry Revenue (Million) Forecast, by Application 2020 & 2033
- Table 32: Israel USA Commercial Real Estate Industry Revenue (Million) Forecast, by Application 2020 & 2033
- Table 33: GCC USA Commercial Real Estate Industry Revenue (Million) Forecast, by Application 2020 & 2033
- Table 34: North Africa USA Commercial Real Estate Industry Revenue (Million) Forecast, by Application 2020 & 2033
- Table 35: South Africa USA Commercial Real Estate Industry Revenue (Million) Forecast, by Application 2020 & 2033
- Table 36: Rest of Middle East & Africa USA Commercial Real Estate Industry Revenue (Million) Forecast, by Application 2020 & 2033
- Table 37: Global USA Commercial Real Estate Industry Revenue Million Forecast, by Type 2020 & 2033
- Table 38: Global USA Commercial Real Estate Industry Revenue Million Forecast, by Key City 2020 & 2033
- Table 39: Global USA Commercial Real Estate Industry Revenue Million Forecast, by Country 2020 & 2033
- Table 40: China USA Commercial Real Estate Industry Revenue (Million) Forecast, by Application 2020 & 2033
- Table 41: India USA Commercial Real Estate Industry Revenue (Million) Forecast, by Application 2020 & 2033
- Table 42: Japan USA Commercial Real Estate Industry Revenue (Million) Forecast, by Application 2020 & 2033
- Table 43: South Korea USA Commercial Real Estate Industry Revenue (Million) Forecast, by Application 2020 & 2033
- Table 44: ASEAN USA Commercial Real Estate Industry Revenue (Million) Forecast, by Application 2020 & 2033
- Table 45: Oceania USA Commercial Real Estate Industry Revenue (Million) Forecast, by Application 2020 & 2033
- Table 46: Rest of Asia Pacific USA Commercial Real Estate Industry Revenue (Million) Forecast, by Application 2020 & 2033
Frequently Asked Questions
1. What is the projected Compound Annual Growth Rate (CAGR) of the USA Commercial Real Estate Industry?
The projected CAGR is approximately 2.61%.
2. Which companies are prominent players in the USA Commercial Real Estate Industry?
Key companies in the market include Zumbly, Franklin Street, Crexi, Keller Williams Realty Inc, Simon Property Group, Hightower, Mohr Partners, Lamudi, Coldwell Banker, ERA Real Estate, RE/MAX, John Propp Commercial Group, HqO**List Not Exhaustive, Century, Progressive Real Estate Partners, Shannon-Waltchack.
3. What are the main segments of the USA Commercial Real Estate Industry?
The market segments include Type, Key City.
4. Can you provide details about the market size?
The market size is estimated to be USD 1.66 Million as of 2022.
5. What are some drivers contributing to market growth?
Increasing number of startups.
6. What are the notable trends driving market growth?
Industrial Sector Expected to Record High Demand.
7. Are there any restraints impacting market growth?
Low Awareness and Privacy Issues.
8. Can you provide examples of recent developments in the market?
N/A
9. What pricing options are available for accessing the report?
Pricing options include single-user, multi-user, and enterprise licenses priced at USD 3800, USD 4500, and USD 5800 respectively.
10. Is the market size provided in terms of value or volume?
The market size is provided in terms of value, measured in Million.
11. Are there any specific market keywords associated with the report?
Yes, the market keyword associated with the report is "USA Commercial Real Estate Industry," which aids in identifying and referencing the specific market segment covered.
12. How do I determine which pricing option suits my needs best?
The pricing options vary based on user requirements and access needs. Individual users may opt for single-user licenses, while businesses requiring broader access may choose multi-user or enterprise licenses for cost-effective access to the report.
13. Are there any additional resources or data provided in the USA Commercial Real Estate Industry report?
While the report offers comprehensive insights, it's advisable to review the specific contents or supplementary materials provided to ascertain if additional resources or data are available.
14. How can I stay updated on further developments or reports in the USA Commercial Real Estate Industry?
To stay informed about further developments, trends, and reports in the USA Commercial Real Estate Industry, consider subscribing to industry newsletters, following relevant companies and organizations, or regularly checking reputable industry news sources and publications.
Methodology
Step 1 - Identification of Relevant Samples Size from Population Database


Step 2 - Approaches for Defining Global Market Size (Value, Volume* & Price*)

Note*: In applicable scenarios
Step 3 - Data Sources
Primary Research
- Web Analytics
- Survey Reports
- Research Institute
- Latest Research Reports
- Opinion Leaders
Secondary Research
- Annual Reports
- White Paper
- Latest Press Release
- Industry Association
- Paid Database
- Investor Presentations

Step 4 - Data Triangulation
Involves using different sources of information in order to increase the validity of a study
These sources are likely to be stakeholders in a program - participants, other researchers, program staff, other community members, and so on.
Then we put all data in single framework & apply various statistical tools to find out the dynamic on the market.
During the analysis stage, feedback from the stakeholder groups would be compared to determine areas of agreement as well as areas of divergence