
Key Insights
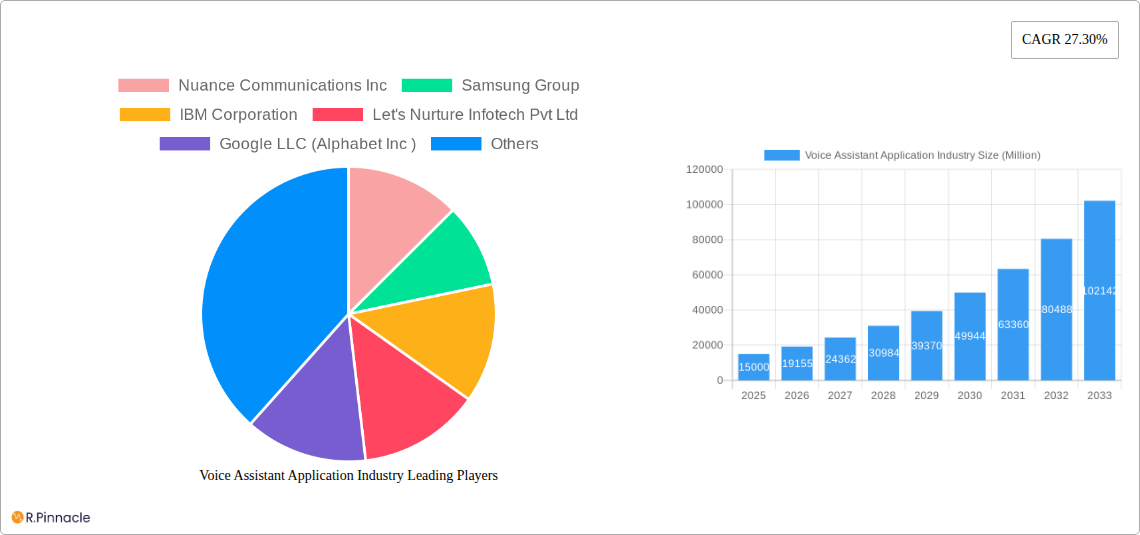
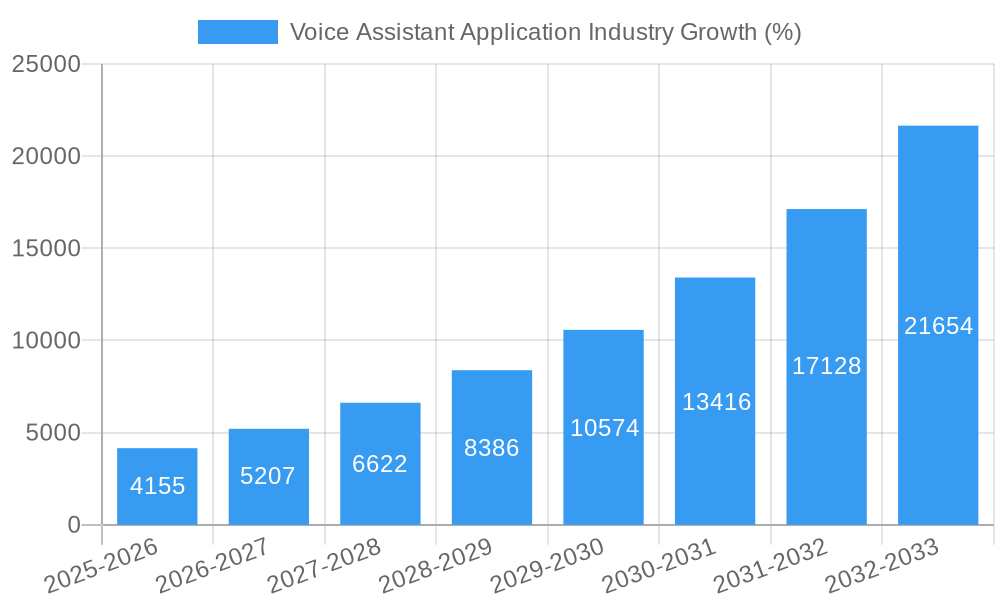
The global voice assistant application market is experiencing robust growth, projected to reach a substantial size driven by increasing smartphone penetration, the proliferation of smart devices, and the rising adoption of AI-powered solutions across diverse sectors. The market's Compound Annual Growth Rate (CAGR) of 27.30% from 2019-2033 signifies a significant expansion opportunity. Key drivers include the convenience and hands-free operation offered by voice assistants, their integration into various applications (like smart home devices, automotive systems, and wearables), and the enhanced user experience they provide. Furthermore, advancements in natural language processing (NLP) and speech recognition technologies are fueling innovation and expanding the functionalities of voice assistants, leading to wider adoption across industries. The enterprise segment, particularly large enterprises, shows significant growth potential due to the increasing demand for automated processes and improved customer service interactions. While data privacy concerns and security vulnerabilities pose challenges, the market's continuous evolution addresses these concerns through enhanced security protocols and user control mechanisms.
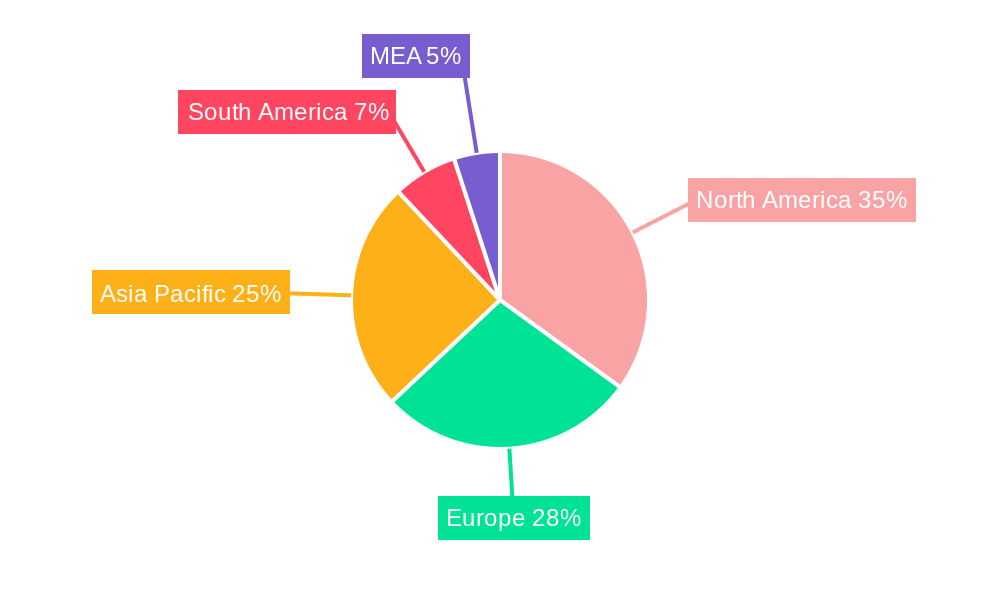
Market segmentation reveals a strong preference for cloud-based deployment due to its scalability and cost-effectiveness. The solutions and services components are experiencing balanced growth, indicating a healthy mix of software and support services within the market. North America and Europe currently dominate the market due to higher technological advancements and early adoption rates. However, the Asia-Pacific region is expected to witness significant growth in the coming years, fueled by increasing digitalization and rising disposable incomes. The BFSI (Banking, Financial Services, and Insurance), IT & Telecommunications, and Healthcare sectors are leading adopters, leveraging voice assistants for customer support, data analysis, and improved operational efficiency. Future growth will be influenced by further technological advancements, expanded integration across devices and platforms, and the continuous development of sophisticated NLP capabilities for more intuitive and personalized user experiences.
Voice Assistant Application Industry Market Report: 2019-2033
This comprehensive report provides an in-depth analysis of the Voice Assistant Application industry, offering valuable insights for industry professionals, investors, and strategic decision-makers. The report covers the period from 2019 to 2033, with a focus on the estimated year 2025 and a forecast period spanning 2025-2033. The study analyzes key market segments, including enterprise size (SMEs and large enterprises), end-user verticals (IT & Telecommunication, BFSI, Healthcare, Retail, Automotive, and others), component types (solutions and services), technology types (Natural Language Processing, Speech Recognition, and others), and deployment models (on-premise and cloud). Key players like Nuance Communications Inc, Samsung Group, IBM Corporation, Let's Nurture Infotech Pvt Ltd, Google LLC (Alphabet Inc), Microsoft Corporation, Amazon Web Services Inc, Oracle Corporation, Apple Inc, and Salesforce com inc are profiled, providing a granular view of the competitive landscape. The report's projected market value exceeds $XX Million.
Voice Assistant Application Industry Market Structure & Innovation Trends
The Voice Assistant Application market exhibits a moderately concentrated structure, with a few major players holding significant market share. However, the market is characterized by intense competition and rapid innovation. Market share is dynamic, with established players facing challenges from agile startups. Key innovation drivers include advancements in Natural Language Processing (NLP), speech recognition, and machine learning, leading to enhanced accuracy and user experience. Regulatory frameworks concerning data privacy and security significantly impact market development. Product substitutes, such as traditional human-based customer support systems, remain relevant but are steadily losing ground to the cost-effectiveness and scalability of voice assistants.
- Market Concentration: The top 5 players account for approximately xx% of the market share in 2025.
- M&A Activity: Over the historical period (2019-2024), the total value of M&A deals in the voice assistant application industry exceeded $XX Million, indicating a strong trend of consolidation. Notable deals involved [Insert specific examples of M&A deals if data is available, otherwise use “xx”].
- Innovation Drivers: Advancements in AI, cloud computing, and IoT are driving the innovation within the market.
- Regulatory Landscape: Regulations around data privacy (e.g., GDPR, CCPA) are shaping product development and deployment strategies.
Voice Assistant Application Industry Market Dynamics & Trends
The Voice Assistant Application market is experiencing robust growth, driven by increasing smartphone penetration, the proliferation of smart home devices, and the rising demand for hands-free and personalized user experiences. Technological disruptions, such as advancements in NLP and AI, are enhancing the capabilities of voice assistants, further fueling market expansion. Consumer preferences are shifting towards seamless integration of voice assistants across multiple platforms and devices. The competitive landscape is highly dynamic, with both established tech giants and emerging startups vying for market share through strategic partnerships, product launches, and aggressive pricing strategies. The CAGR for the forecast period (2025-2033) is estimated at xx%, indicating substantial market growth. Market penetration is expected to reach xx% by 2033, driven primarily by the adoption of voice assistants in the consumer and enterprise segments.
Dominant Regions & Segments in Voice Assistant Application Industry
The North American region currently holds a dominant position in the Voice Assistant Application market, primarily due to the high adoption of smart devices and the presence of major technology players. However, the Asia-Pacific region is expected to witness significant growth in the forecast period, driven by increasing smartphone penetration and a burgeoning middle class.
- Leading Regions: North America, followed by Europe and Asia-Pacific.
- Dominant Segments:
- Enterprise Size: Large enterprises are currently the larger segment due to higher budgets and greater need for automation.
- End-user Verticals: IT & Telecommunication and BFSI segments are leading due to their early adoption of voice assistant technologies for customer service and operational efficiency.
- Component Type: Solutions segment dominates due to the demand for integrated and customizable voice assistant offerings.
- Technology Type: Natural Language Processing (NLP) is the leading technology driving market growth.
- Deployment: Cloud deployment is gaining traction due to its scalability and cost-effectiveness.
- Key Drivers: Strong technological infrastructure, supportive government policies, and a high level of digital literacy contribute to regional dominance.
Voice Assistant Application Industry Product Innovations
Recent product innovations focus on enhancing personalization, improving accuracy, and expanding functionality. Voice assistants are increasingly integrating with other smart devices and platforms, creating a more seamless and connected user experience. The emphasis is on developing voice assistants that can understand complex commands, adapt to different accents and dialects, and provide more contextual and relevant responses. This focus on improved user experience drives market penetration and creates competitive advantage.
Report Scope & Segmentation Analysis
This report segments the Voice Assistant Application market across several key parameters, including enterprise size (SMEs and large enterprises), end-user verticals (IT & Telecommunication, BFSI, Healthcare, Retail, Automotive, and others), component type (solutions and services), technology type (NLP, speech recognition, and others), and deployment (on-premise and cloud). Each segment is analyzed in detail, including growth projections, market size, and competitive dynamics. For instance, the cloud deployment segment is expected to grow at a significantly faster rate than the on-premise segment due to its flexibility and scalability advantages. Similarly, the NLP-based solutions segment holds significant market share due to its superior performance compared to other technologies.
Key Drivers of Voice Assistant Application Industry Growth
Several factors are driving the growth of the Voice Assistant Application industry. These include advancements in artificial intelligence and machine learning, leading to more accurate and intelligent voice assistants. The increasing penetration of smartphones and smart home devices provides a vast pool of potential users. Furthermore, the rising demand for hands-free and personalized experiences across various sectors fuels market expansion. Government initiatives promoting digitalization and technological advancement in several regions also contribute to this growth.
Challenges in the Voice Assistant Application Industry Sector
The Voice Assistant Application industry faces several challenges. Concerns around data privacy and security are paramount, necessitating robust security measures and adherence to relevant regulations. Ensuring accuracy and reliability in diverse linguistic contexts and environments remains a significant technological hurdle. Competition from established tech giants and the emergence of new players create a highly dynamic and competitive environment. Furthermore, supply chain disruptions can impact the availability of components crucial for manufacturing voice-enabled devices. These challenges can negatively impact market growth by slowing down adoption and reducing overall revenues.
Emerging Opportunities in Voice Assistant Application Industry
Emerging opportunities lie in expanding into new markets, particularly in developing economies, where smartphone penetration is increasing rapidly. The integration of voice assistants with other technologies, such as IoT devices and augmented reality, offers significant potential. The development of more sophisticated AI-powered voice assistants capable of handling complex tasks and engaging in natural conversations will create new opportunities. Customization and personalization of voice assistants are increasingly critical for enhanced user experience and create considerable room for growth.
Leading Players in the Voice Assistant Application Industry Market
- Nuance Communications Inc
- Samsung Group
- IBM Corporation
- Let's Nurture Infotech Pvt Ltd
- Google LLC (Alphabet Inc)
- Microsoft Corporation
- Amazon Web Services Inc
- Oracle Corporation
- Apple Inc
- Salesforce com inc
Key Developments in Voice Assistant Application Industry
- November 2022: Sony launched "Isha," a multilingual AI voice assistant for customer support in India, in collaboration with Yellow.ai.
- June 2022: Sonos introduced voice assistant capabilities through a free software update, enabling users to control their speakers with voice commands.
Future Outlook for Voice Assistant Application Industry Market
The Voice Assistant Application market is poised for significant growth in the coming years. Advancements in AI and NLP will continue to drive innovation, leading to more sophisticated and user-friendly voice assistants. The increasing adoption of smart devices and the expansion into new markets will further fuel market expansion. Strategic partnerships and collaborations between technology companies and other industries will unlock new applications and opportunities, shaping the future of human-computer interaction. This presents significant potential for investors and industry participants to capitalize on the growing demand for voice-based solutions.
Voice Assistant Application Industry Segmentation
-
1. Component Type
- 1.1. Solutions
- 1.2. Services
-
2. Type of Technology
- 2.1. Natural Language Processing
- 2.2. Speech Recognition
- 2.3. Other Te
-
3. Deployment
- 3.1. On-Premise
- 3.2. Cloud
- 3.3. Hybrid
-
4. Enterprise Size
- 4.1. Small & Medium Enterprises
- 4.2. Large Enterprises
-
5. End-user Verticals
- 5.1. IT & Telecommunication
- 5.2. BFSI
- 5.3. Healthcare
- 5.4. Retail
- 5.5. Automotive
- 5.6. Other
Voice Assistant Application Industry Segmentation By Geography
- 1. North America
- 2. Europe
- 3. Asia Pacific
- 4. Latin America
- 5. Middle East and Africa
Voice Assistant Application Industry REPORT HIGHLIGHTS
| Aspects | Details |
|---|---|
| Study Period | 2019-2033 |
| Base Year | 2024 |
| Estimated Year | 2025 |
| Forecast Period | 2025-2033 |
| Historical Period | 2019-2024 |
| Growth Rate | CAGR of 27.30% from 2019-2033 |
| Segmentation |
|
Table of Contents
- 1. Introduction
- 1.1. Research Scope
- 1.2. Market Segmentation
- 1.3. Research Methodology
- 1.4. Definitions and Assumptions
- 2. Executive Summary
- 2.1. Introduction
- 3. Market Dynamics
- 3.1. Introduction
- 3.2. Market Drivers
- 3.2.1. Rising Usage of Cutting-edge Technology-based Connected Devices
- 3.3. Market Restrains
- 3.3.1. Lack of Skilled Labor; Unsupervised Learning
- 3.4. Market Trends
- 3.4.1. Healthcare Vertical is Expected to Grow Significantly Over the Forecast Period
- 4. Market Factor Analysis
- 4.1. Porters Five Forces
- 4.2. Supply/Value Chain
- 4.3. PESTEL analysis
- 4.4. Market Entropy
- 4.5. Patent/Trademark Analysis
- 5. Global Voice Assistant Application Industry Analysis, Insights and Forecast, 2019-2031
- 5.1. Market Analysis, Insights and Forecast - by Component Type
- 5.1.1. Solutions
- 5.1.2. Services
- 5.2. Market Analysis, Insights and Forecast - by Type of Technology
- 5.2.1. Natural Language Processing
- 5.2.2. Speech Recognition
- 5.2.3. Other Te
- 5.3. Market Analysis, Insights and Forecast - by Deployment
- 5.3.1. On-Premise
- 5.3.2. Cloud
- 5.3.3. Hybrid
- 5.4. Market Analysis, Insights and Forecast - by Enterprise Size
- 5.4.1. Small & Medium Enterprises
- 5.4.2. Large Enterprises
- 5.5. Market Analysis, Insights and Forecast - by End-user Verticals
- 5.5.1. IT & Telecommunication
- 5.5.2. BFSI
- 5.5.3. Healthcare
- 5.5.4. Retail
- 5.5.5. Automotive
- 5.5.6. Other
- 5.6. Market Analysis, Insights and Forecast - by Region
- 5.6.1. North America
- 5.6.2. Europe
- 5.6.3. Asia Pacific
- 5.6.4. Latin America
- 5.6.5. Middle East and Africa
- 5.1. Market Analysis, Insights and Forecast - by Component Type
- 6. North America Voice Assistant Application Industry Analysis, Insights and Forecast, 2019-2031
- 6.1. Market Analysis, Insights and Forecast - by Component Type
- 6.1.1. Solutions
- 6.1.2. Services
- 6.2. Market Analysis, Insights and Forecast - by Type of Technology
- 6.2.1. Natural Language Processing
- 6.2.2. Speech Recognition
- 6.2.3. Other Te
- 6.3. Market Analysis, Insights and Forecast - by Deployment
- 6.3.1. On-Premise
- 6.3.2. Cloud
- 6.3.3. Hybrid
- 6.4. Market Analysis, Insights and Forecast - by Enterprise Size
- 6.4.1. Small & Medium Enterprises
- 6.4.2. Large Enterprises
- 6.5. Market Analysis, Insights and Forecast - by End-user Verticals
- 6.5.1. IT & Telecommunication
- 6.5.2. BFSI
- 6.5.3. Healthcare
- 6.5.4. Retail
- 6.5.5. Automotive
- 6.5.6. Other
- 6.1. Market Analysis, Insights and Forecast - by Component Type
- 7. Europe Voice Assistant Application Industry Analysis, Insights and Forecast, 2019-2031
- 7.1. Market Analysis, Insights and Forecast - by Component Type
- 7.1.1. Solutions
- 7.1.2. Services
- 7.2. Market Analysis, Insights and Forecast - by Type of Technology
- 7.2.1. Natural Language Processing
- 7.2.2. Speech Recognition
- 7.2.3. Other Te
- 7.3. Market Analysis, Insights and Forecast - by Deployment
- 7.3.1. On-Premise
- 7.3.2. Cloud
- 7.3.3. Hybrid
- 7.4. Market Analysis, Insights and Forecast - by Enterprise Size
- 7.4.1. Small & Medium Enterprises
- 7.4.2. Large Enterprises
- 7.5. Market Analysis, Insights and Forecast - by End-user Verticals
- 7.5.1. IT & Telecommunication
- 7.5.2. BFSI
- 7.5.3. Healthcare
- 7.5.4. Retail
- 7.5.5. Automotive
- 7.5.6. Other
- 7.1. Market Analysis, Insights and Forecast - by Component Type
- 8. Asia Pacific Voice Assistant Application Industry Analysis, Insights and Forecast, 2019-2031
- 8.1. Market Analysis, Insights and Forecast - by Component Type
- 8.1.1. Solutions
- 8.1.2. Services
- 8.2. Market Analysis, Insights and Forecast - by Type of Technology
- 8.2.1. Natural Language Processing
- 8.2.2. Speech Recognition
- 8.2.3. Other Te
- 8.3. Market Analysis, Insights and Forecast - by Deployment
- 8.3.1. On-Premise
- 8.3.2. Cloud
- 8.3.3. Hybrid
- 8.4. Market Analysis, Insights and Forecast - by Enterprise Size
- 8.4.1. Small & Medium Enterprises
- 8.4.2. Large Enterprises
- 8.5. Market Analysis, Insights and Forecast - by End-user Verticals
- 8.5.1. IT & Telecommunication
- 8.5.2. BFSI
- 8.5.3. Healthcare
- 8.5.4. Retail
- 8.5.5. Automotive
- 8.5.6. Other
- 8.1. Market Analysis, Insights and Forecast - by Component Type
- 9. Latin America Voice Assistant Application Industry Analysis, Insights and Forecast, 2019-2031
- 9.1. Market Analysis, Insights and Forecast - by Component Type
- 9.1.1. Solutions
- 9.1.2. Services
- 9.2. Market Analysis, Insights and Forecast - by Type of Technology
- 9.2.1. Natural Language Processing
- 9.2.2. Speech Recognition
- 9.2.3. Other Te
- 9.3. Market Analysis, Insights and Forecast - by Deployment
- 9.3.1. On-Premise
- 9.3.2. Cloud
- 9.3.3. Hybrid
- 9.4. Market Analysis, Insights and Forecast - by Enterprise Size
- 9.4.1. Small & Medium Enterprises
- 9.4.2. Large Enterprises
- 9.5. Market Analysis, Insights and Forecast - by End-user Verticals
- 9.5.1. IT & Telecommunication
- 9.5.2. BFSI
- 9.5.3. Healthcare
- 9.5.4. Retail
- 9.5.5. Automotive
- 9.5.6. Other
- 9.1. Market Analysis, Insights and Forecast - by Component Type
- 10. Middle East and Africa Voice Assistant Application Industry Analysis, Insights and Forecast, 2019-2031
- 10.1. Market Analysis, Insights and Forecast - by Component Type
- 10.1.1. Solutions
- 10.1.2. Services
- 10.2. Market Analysis, Insights and Forecast - by Type of Technology
- 10.2.1. Natural Language Processing
- 10.2.2. Speech Recognition
- 10.2.3. Other Te
- 10.3. Market Analysis, Insights and Forecast - by Deployment
- 10.3.1. On-Premise
- 10.3.2. Cloud
- 10.3.3. Hybrid
- 10.4. Market Analysis, Insights and Forecast - by Enterprise Size
- 10.4.1. Small & Medium Enterprises
- 10.4.2. Large Enterprises
- 10.5. Market Analysis, Insights and Forecast - by End-user Verticals
- 10.5.1. IT & Telecommunication
- 10.5.2. BFSI
- 10.5.3. Healthcare
- 10.5.4. Retail
- 10.5.5. Automotive
- 10.5.6. Other
- 10.1. Market Analysis, Insights and Forecast - by Component Type
- 11. North America Voice Assistant Application Industry Analysis, Insights and Forecast, 2019-2031
- 11.1. Market Analysis, Insights and Forecast - By Country/Sub-region
- 11.1.1 United States
- 11.1.2 Canada
- 11.1.3 Mexico
- 12. Europe Voice Assistant Application Industry Analysis, Insights and Forecast, 2019-2031
- 12.1. Market Analysis, Insights and Forecast - By Country/Sub-region
- 12.1.1 Germany
- 12.1.2 United Kingdom
- 12.1.3 France
- 12.1.4 Spain
- 12.1.5 Italy
- 12.1.6 Spain
- 12.1.7 Belgium
- 12.1.8 Netherland
- 12.1.9 Nordics
- 12.1.10 Rest of Europe
- 13. Asia Pacific Voice Assistant Application Industry Analysis, Insights and Forecast, 2019-2031
- 13.1. Market Analysis, Insights and Forecast - By Country/Sub-region
- 13.1.1 China
- 13.1.2 Japan
- 13.1.3 India
- 13.1.4 South Korea
- 13.1.5 Southeast Asia
- 13.1.6 Australia
- 13.1.7 Indonesia
- 13.1.8 Phillipes
- 13.1.9 Singapore
- 13.1.10 Thailandc
- 13.1.11 Rest of Asia Pacific
- 14. South America Voice Assistant Application Industry Analysis, Insights and Forecast, 2019-2031
- 14.1. Market Analysis, Insights and Forecast - By Country/Sub-region
- 14.1.1 Brazil
- 14.1.2 Argentina
- 14.1.3 Peru
- 14.1.4 Chile
- 14.1.5 Colombia
- 14.1.6 Ecuador
- 14.1.7 Venezuela
- 14.1.8 Rest of South America
- 15. North America Voice Assistant Application Industry Analysis, Insights and Forecast, 2019-2031
- 15.1. Market Analysis, Insights and Forecast - By Country/Sub-region
- 15.1.1 United States
- 15.1.2 Canada
- 15.1.3 Mexico
- 16. MEA Voice Assistant Application Industry Analysis, Insights and Forecast, 2019-2031
- 16.1. Market Analysis, Insights and Forecast - By Country/Sub-region
- 16.1.1 United Arab Emirates
- 16.1.2 Saudi Arabia
- 16.1.3 South Africa
- 16.1.4 Rest of Middle East and Africa
- 17. Competitive Analysis
- 17.1. Global Market Share Analysis 2024
- 17.2. Company Profiles
- 17.2.1 Nuance Communications Inc
- 17.2.1.1. Overview
- 17.2.1.2. Products
- 17.2.1.3. SWOT Analysis
- 17.2.1.4. Recent Developments
- 17.2.1.5. Financials (Based on Availability)
- 17.2.2 Samsung Group
- 17.2.2.1. Overview
- 17.2.2.2. Products
- 17.2.2.3. SWOT Analysis
- 17.2.2.4. Recent Developments
- 17.2.2.5. Financials (Based on Availability)
- 17.2.3 IBM Corporation
- 17.2.3.1. Overview
- 17.2.3.2. Products
- 17.2.3.3. SWOT Analysis
- 17.2.3.4. Recent Developments
- 17.2.3.5. Financials (Based on Availability)
- 17.2.4 Let's Nurture Infotech Pvt Ltd
- 17.2.4.1. Overview
- 17.2.4.2. Products
- 17.2.4.3. SWOT Analysis
- 17.2.4.4. Recent Developments
- 17.2.4.5. Financials (Based on Availability)
- 17.2.5 Google LLC (Alphabet Inc )
- 17.2.5.1. Overview
- 17.2.5.2. Products
- 17.2.5.3. SWOT Analysis
- 17.2.5.4. Recent Developments
- 17.2.5.5. Financials (Based on Availability)
- 17.2.6 Microsoft Corporation
- 17.2.6.1. Overview
- 17.2.6.2. Products
- 17.2.6.3. SWOT Analysis
- 17.2.6.4. Recent Developments
- 17.2.6.5. Financials (Based on Availability)
- 17.2.7 Amazon Web Services Inc
- 17.2.7.1. Overview
- 17.2.7.2. Products
- 17.2.7.3. SWOT Analysis
- 17.2.7.4. Recent Developments
- 17.2.7.5. Financials (Based on Availability)
- 17.2.8 Oracle Corporation
- 17.2.8.1. Overview
- 17.2.8.2. Products
- 17.2.8.3. SWOT Analysis
- 17.2.8.4. Recent Developments
- 17.2.8.5. Financials (Based on Availability)
- 17.2.9 Apple Inc
- 17.2.9.1. Overview
- 17.2.9.2. Products
- 17.2.9.3. SWOT Analysis
- 17.2.9.4. Recent Developments
- 17.2.9.5. Financials (Based on Availability)
- 17.2.10 Salesforce com inc
- 17.2.10.1. Overview
- 17.2.10.2. Products
- 17.2.10.3. SWOT Analysis
- 17.2.10.4. Recent Developments
- 17.2.10.5. Financials (Based on Availability)
- 17.2.1 Nuance Communications Inc
List of Figures
- Figure 1: Global Voice Assistant Application Industry Revenue Breakdown (Million, %) by Region 2024 & 2032
- Figure 2: Global Voice Assistant Application Industry Volume Breakdown (K Unit, %) by Region 2024 & 2032
- Figure 3: North America Voice Assistant Application Industry Revenue (Million), by Country 2024 & 2032
- Figure 4: North America Voice Assistant Application Industry Volume (K Unit), by Country 2024 & 2032
- Figure 5: North America Voice Assistant Application Industry Revenue Share (%), by Country 2024 & 2032
- Figure 6: North America Voice Assistant Application Industry Volume Share (%), by Country 2024 & 2032
- Figure 7: Europe Voice Assistant Application Industry Revenue (Million), by Country 2024 & 2032
- Figure 8: Europe Voice Assistant Application Industry Volume (K Unit), by Country 2024 & 2032
- Figure 9: Europe Voice Assistant Application Industry Revenue Share (%), by Country 2024 & 2032
- Figure 10: Europe Voice Assistant Application Industry Volume Share (%), by Country 2024 & 2032
- Figure 11: Asia Pacific Voice Assistant Application Industry Revenue (Million), by Country 2024 & 2032
- Figure 12: Asia Pacific Voice Assistant Application Industry Volume (K Unit), by Country 2024 & 2032
- Figure 13: Asia Pacific Voice Assistant Application Industry Revenue Share (%), by Country 2024 & 2032
- Figure 14: Asia Pacific Voice Assistant Application Industry Volume Share (%), by Country 2024 & 2032
- Figure 15: South America Voice Assistant Application Industry Revenue (Million), by Country 2024 & 2032
- Figure 16: South America Voice Assistant Application Industry Volume (K Unit), by Country 2024 & 2032
- Figure 17: South America Voice Assistant Application Industry Revenue Share (%), by Country 2024 & 2032
- Figure 18: South America Voice Assistant Application Industry Volume Share (%), by Country 2024 & 2032
- Figure 19: North America Voice Assistant Application Industry Revenue (Million), by Country 2024 & 2032
- Figure 20: North America Voice Assistant Application Industry Volume (K Unit), by Country 2024 & 2032
- Figure 21: North America Voice Assistant Application Industry Revenue Share (%), by Country 2024 & 2032
- Figure 22: North America Voice Assistant Application Industry Volume Share (%), by Country 2024 & 2032
- Figure 23: MEA Voice Assistant Application Industry Revenue (Million), by Country 2024 & 2032
- Figure 24: MEA Voice Assistant Application Industry Volume (K Unit), by Country 2024 & 2032
- Figure 25: MEA Voice Assistant Application Industry Revenue Share (%), by Country 2024 & 2032
- Figure 26: MEA Voice Assistant Application Industry Volume Share (%), by Country 2024 & 2032
- Figure 27: North America Voice Assistant Application Industry Revenue (Million), by Component Type 2024 & 2032
- Figure 28: North America Voice Assistant Application Industry Volume (K Unit), by Component Type 2024 & 2032
- Figure 29: North America Voice Assistant Application Industry Revenue Share (%), by Component Type 2024 & 2032
- Figure 30: North America Voice Assistant Application Industry Volume Share (%), by Component Type 2024 & 2032
- Figure 31: North America Voice Assistant Application Industry Revenue (Million), by Type of Technology 2024 & 2032
- Figure 32: North America Voice Assistant Application Industry Volume (K Unit), by Type of Technology 2024 & 2032
- Figure 33: North America Voice Assistant Application Industry Revenue Share (%), by Type of Technology 2024 & 2032
- Figure 34: North America Voice Assistant Application Industry Volume Share (%), by Type of Technology 2024 & 2032
- Figure 35: North America Voice Assistant Application Industry Revenue (Million), by Deployment 2024 & 2032
- Figure 36: North America Voice Assistant Application Industry Volume (K Unit), by Deployment 2024 & 2032
- Figure 37: North America Voice Assistant Application Industry Revenue Share (%), by Deployment 2024 & 2032
- Figure 38: North America Voice Assistant Application Industry Volume Share (%), by Deployment 2024 & 2032
- Figure 39: North America Voice Assistant Application Industry Revenue (Million), by Enterprise Size 2024 & 2032
- Figure 40: North America Voice Assistant Application Industry Volume (K Unit), by Enterprise Size 2024 & 2032
- Figure 41: North America Voice Assistant Application Industry Revenue Share (%), by Enterprise Size 2024 & 2032
- Figure 42: North America Voice Assistant Application Industry Volume Share (%), by Enterprise Size 2024 & 2032
- Figure 43: North America Voice Assistant Application Industry Revenue (Million), by End-user Verticals 2024 & 2032
- Figure 44: North America Voice Assistant Application Industry Volume (K Unit), by End-user Verticals 2024 & 2032
- Figure 45: North America Voice Assistant Application Industry Revenue Share (%), by End-user Verticals 2024 & 2032
- Figure 46: North America Voice Assistant Application Industry Volume Share (%), by End-user Verticals 2024 & 2032
- Figure 47: North America Voice Assistant Application Industry Revenue (Million), by Country 2024 & 2032
- Figure 48: North America Voice Assistant Application Industry Volume (K Unit), by Country 2024 & 2032
- Figure 49: North America Voice Assistant Application Industry Revenue Share (%), by Country 2024 & 2032
- Figure 50: North America Voice Assistant Application Industry Volume Share (%), by Country 2024 & 2032
- Figure 51: Europe Voice Assistant Application Industry Revenue (Million), by Component Type 2024 & 2032
- Figure 52: Europe Voice Assistant Application Industry Volume (K Unit), by Component Type 2024 & 2032
- Figure 53: Europe Voice Assistant Application Industry Revenue Share (%), by Component Type 2024 & 2032
- Figure 54: Europe Voice Assistant Application Industry Volume Share (%), by Component Type 2024 & 2032
- Figure 55: Europe Voice Assistant Application Industry Revenue (Million), by Type of Technology 2024 & 2032
- Figure 56: Europe Voice Assistant Application Industry Volume (K Unit), by Type of Technology 2024 & 2032
- Figure 57: Europe Voice Assistant Application Industry Revenue Share (%), by Type of Technology 2024 & 2032
- Figure 58: Europe Voice Assistant Application Industry Volume Share (%), by Type of Technology 2024 & 2032
- Figure 59: Europe Voice Assistant Application Industry Revenue (Million), by Deployment 2024 & 2032
- Figure 60: Europe Voice Assistant Application Industry Volume (K Unit), by Deployment 2024 & 2032
- Figure 61: Europe Voice Assistant Application Industry Revenue Share (%), by Deployment 2024 & 2032
- Figure 62: Europe Voice Assistant Application Industry Volume Share (%), by Deployment 2024 & 2032
- Figure 63: Europe Voice Assistant Application Industry Revenue (Million), by Enterprise Size 2024 & 2032
- Figure 64: Europe Voice Assistant Application Industry Volume (K Unit), by Enterprise Size 2024 & 2032
- Figure 65: Europe Voice Assistant Application Industry Revenue Share (%), by Enterprise Size 2024 & 2032
- Figure 66: Europe Voice Assistant Application Industry Volume Share (%), by Enterprise Size 2024 & 2032
- Figure 67: Europe Voice Assistant Application Industry Revenue (Million), by End-user Verticals 2024 & 2032
- Figure 68: Europe Voice Assistant Application Industry Volume (K Unit), by End-user Verticals 2024 & 2032
- Figure 69: Europe Voice Assistant Application Industry Revenue Share (%), by End-user Verticals 2024 & 2032
- Figure 70: Europe Voice Assistant Application Industry Volume Share (%), by End-user Verticals 2024 & 2032
- Figure 71: Europe Voice Assistant Application Industry Revenue (Million), by Country 2024 & 2032
- Figure 72: Europe Voice Assistant Application Industry Volume (K Unit), by Country 2024 & 2032
- Figure 73: Europe Voice Assistant Application Industry Revenue Share (%), by Country 2024 & 2032
- Figure 74: Europe Voice Assistant Application Industry Volume Share (%), by Country 2024 & 2032
- Figure 75: Asia Pacific Voice Assistant Application Industry Revenue (Million), by Component Type 2024 & 2032
- Figure 76: Asia Pacific Voice Assistant Application Industry Volume (K Unit), by Component Type 2024 & 2032
- Figure 77: Asia Pacific Voice Assistant Application Industry Revenue Share (%), by Component Type 2024 & 2032
- Figure 78: Asia Pacific Voice Assistant Application Industry Volume Share (%), by Component Type 2024 & 2032
- Figure 79: Asia Pacific Voice Assistant Application Industry Revenue (Million), by Type of Technology 2024 & 2032
- Figure 80: Asia Pacific Voice Assistant Application Industry Volume (K Unit), by Type of Technology 2024 & 2032
- Figure 81: Asia Pacific Voice Assistant Application Industry Revenue Share (%), by Type of Technology 2024 & 2032
- Figure 82: Asia Pacific Voice Assistant Application Industry Volume Share (%), by Type of Technology 2024 & 2032
- Figure 83: Asia Pacific Voice Assistant Application Industry Revenue (Million), by Deployment 2024 & 2032
- Figure 84: Asia Pacific Voice Assistant Application Industry Volume (K Unit), by Deployment 2024 & 2032
- Figure 85: Asia Pacific Voice Assistant Application Industry Revenue Share (%), by Deployment 2024 & 2032
- Figure 86: Asia Pacific Voice Assistant Application Industry Volume Share (%), by Deployment 2024 & 2032
- Figure 87: Asia Pacific Voice Assistant Application Industry Revenue (Million), by Enterprise Size 2024 & 2032
- Figure 88: Asia Pacific Voice Assistant Application Industry Volume (K Unit), by Enterprise Size 2024 & 2032
- Figure 89: Asia Pacific Voice Assistant Application Industry Revenue Share (%), by Enterprise Size 2024 & 2032
- Figure 90: Asia Pacific Voice Assistant Application Industry Volume Share (%), by Enterprise Size 2024 & 2032
- Figure 91: Asia Pacific Voice Assistant Application Industry Revenue (Million), by End-user Verticals 2024 & 2032
- Figure 92: Asia Pacific Voice Assistant Application Industry Volume (K Unit), by End-user Verticals 2024 & 2032
- Figure 93: Asia Pacific Voice Assistant Application Industry Revenue Share (%), by End-user Verticals 2024 & 2032
- Figure 94: Asia Pacific Voice Assistant Application Industry Volume Share (%), by End-user Verticals 2024 & 2032
- Figure 95: Asia Pacific Voice Assistant Application Industry Revenue (Million), by Country 2024 & 2032
- Figure 96: Asia Pacific Voice Assistant Application Industry Volume (K Unit), by Country 2024 & 2032
- Figure 97: Asia Pacific Voice Assistant Application Industry Revenue Share (%), by Country 2024 & 2032
- Figure 98: Asia Pacific Voice Assistant Application Industry Volume Share (%), by Country 2024 & 2032
- Figure 99: Latin America Voice Assistant Application Industry Revenue (Million), by Component Type 2024 & 2032
- Figure 100: Latin America Voice Assistant Application Industry Volume (K Unit), by Component Type 2024 & 2032
- Figure 101: Latin America Voice Assistant Application Industry Revenue Share (%), by Component Type 2024 & 2032
- Figure 102: Latin America Voice Assistant Application Industry Volume Share (%), by Component Type 2024 & 2032
- Figure 103: Latin America Voice Assistant Application Industry Revenue (Million), by Type of Technology 2024 & 2032
- Figure 104: Latin America Voice Assistant Application Industry Volume (K Unit), by Type of Technology 2024 & 2032
- Figure 105: Latin America Voice Assistant Application Industry Revenue Share (%), by Type of Technology 2024 & 2032
- Figure 106: Latin America Voice Assistant Application Industry Volume Share (%), by Type of Technology 2024 & 2032
- Figure 107: Latin America Voice Assistant Application Industry Revenue (Million), by Deployment 2024 & 2032
- Figure 108: Latin America Voice Assistant Application Industry Volume (K Unit), by Deployment 2024 & 2032
- Figure 109: Latin America Voice Assistant Application Industry Revenue Share (%), by Deployment 2024 & 2032
- Figure 110: Latin America Voice Assistant Application Industry Volume Share (%), by Deployment 2024 & 2032
- Figure 111: Latin America Voice Assistant Application Industry Revenue (Million), by Enterprise Size 2024 & 2032
- Figure 112: Latin America Voice Assistant Application Industry Volume (K Unit), by Enterprise Size 2024 & 2032
- Figure 113: Latin America Voice Assistant Application Industry Revenue Share (%), by Enterprise Size 2024 & 2032
- Figure 114: Latin America Voice Assistant Application Industry Volume Share (%), by Enterprise Size 2024 & 2032
- Figure 115: Latin America Voice Assistant Application Industry Revenue (Million), by End-user Verticals 2024 & 2032
- Figure 116: Latin America Voice Assistant Application Industry Volume (K Unit), by End-user Verticals 2024 & 2032
- Figure 117: Latin America Voice Assistant Application Industry Revenue Share (%), by End-user Verticals 2024 & 2032
- Figure 118: Latin America Voice Assistant Application Industry Volume Share (%), by End-user Verticals 2024 & 2032
- Figure 119: Latin America Voice Assistant Application Industry Revenue (Million), by Country 2024 & 2032
- Figure 120: Latin America Voice Assistant Application Industry Volume (K Unit), by Country 2024 & 2032
- Figure 121: Latin America Voice Assistant Application Industry Revenue Share (%), by Country 2024 & 2032
- Figure 122: Latin America Voice Assistant Application Industry Volume Share (%), by Country 2024 & 2032
- Figure 123: Middle East and Africa Voice Assistant Application Industry Revenue (Million), by Component Type 2024 & 2032
- Figure 124: Middle East and Africa Voice Assistant Application Industry Volume (K Unit), by Component Type 2024 & 2032
- Figure 125: Middle East and Africa Voice Assistant Application Industry Revenue Share (%), by Component Type 2024 & 2032
- Figure 126: Middle East and Africa Voice Assistant Application Industry Volume Share (%), by Component Type 2024 & 2032
- Figure 127: Middle East and Africa Voice Assistant Application Industry Revenue (Million), by Type of Technology 2024 & 2032
- Figure 128: Middle East and Africa Voice Assistant Application Industry Volume (K Unit), by Type of Technology 2024 & 2032
- Figure 129: Middle East and Africa Voice Assistant Application Industry Revenue Share (%), by Type of Technology 2024 & 2032
- Figure 130: Middle East and Africa Voice Assistant Application Industry Volume Share (%), by Type of Technology 2024 & 2032
- Figure 131: Middle East and Africa Voice Assistant Application Industry Revenue (Million), by Deployment 2024 & 2032
- Figure 132: Middle East and Africa Voice Assistant Application Industry Volume (K Unit), by Deployment 2024 & 2032
- Figure 133: Middle East and Africa Voice Assistant Application Industry Revenue Share (%), by Deployment 2024 & 2032
- Figure 134: Middle East and Africa Voice Assistant Application Industry Volume Share (%), by Deployment 2024 & 2032
- Figure 135: Middle East and Africa Voice Assistant Application Industry Revenue (Million), by Enterprise Size 2024 & 2032
- Figure 136: Middle East and Africa Voice Assistant Application Industry Volume (K Unit), by Enterprise Size 2024 & 2032
- Figure 137: Middle East and Africa Voice Assistant Application Industry Revenue Share (%), by Enterprise Size 2024 & 2032
- Figure 138: Middle East and Africa Voice Assistant Application Industry Volume Share (%), by Enterprise Size 2024 & 2032
- Figure 139: Middle East and Africa Voice Assistant Application Industry Revenue (Million), by End-user Verticals 2024 & 2032
- Figure 140: Middle East and Africa Voice Assistant Application Industry Volume (K Unit), by End-user Verticals 2024 & 2032
- Figure 141: Middle East and Africa Voice Assistant Application Industry Revenue Share (%), by End-user Verticals 2024 & 2032
- Figure 142: Middle East and Africa Voice Assistant Application Industry Volume Share (%), by End-user Verticals 2024 & 2032
- Figure 143: Middle East and Africa Voice Assistant Application Industry Revenue (Million), by Country 2024 & 2032
- Figure 144: Middle East and Africa Voice Assistant Application Industry Volume (K Unit), by Country 2024 & 2032
- Figure 145: Middle East and Africa Voice Assistant Application Industry Revenue Share (%), by Country 2024 & 2032
- Figure 146: Middle East and Africa Voice Assistant Application Industry Volume Share (%), by Country 2024 & 2032
List of Tables
- Table 1: Global Voice Assistant Application Industry Revenue Million Forecast, by Region 2019 & 2032
- Table 2: Global Voice Assistant Application Industry Volume K Unit Forecast, by Region 2019 & 2032
- Table 3: Global Voice Assistant Application Industry Revenue Million Forecast, by Component Type 2019 & 2032
- Table 4: Global Voice Assistant Application Industry Volume K Unit Forecast, by Component Type 2019 & 2032
- Table 5: Global Voice Assistant Application Industry Revenue Million Forecast, by Type of Technology 2019 & 2032
- Table 6: Global Voice Assistant Application Industry Volume K Unit Forecast, by Type of Technology 2019 & 2032
- Table 7: Global Voice Assistant Application Industry Revenue Million Forecast, by Deployment 2019 & 2032
- Table 8: Global Voice Assistant Application Industry Volume K Unit Forecast, by Deployment 2019 & 2032
- Table 9: Global Voice Assistant Application Industry Revenue Million Forecast, by Enterprise Size 2019 & 2032
- Table 10: Global Voice Assistant Application Industry Volume K Unit Forecast, by Enterprise Size 2019 & 2032
- Table 11: Global Voice Assistant Application Industry Revenue Million Forecast, by End-user Verticals 2019 & 2032
- Table 12: Global Voice Assistant Application Industry Volume K Unit Forecast, by End-user Verticals 2019 & 2032
- Table 13: Global Voice Assistant Application Industry Revenue Million Forecast, by Region 2019 & 2032
- Table 14: Global Voice Assistant Application Industry Volume K Unit Forecast, by Region 2019 & 2032
- Table 15: Global Voice Assistant Application Industry Revenue Million Forecast, by Country 2019 & 2032
- Table 16: Global Voice Assistant Application Industry Volume K Unit Forecast, by Country 2019 & 2032
- Table 17: United States Voice Assistant Application Industry Revenue (Million) Forecast, by Application 2019 & 2032
- Table 18: United States Voice Assistant Application Industry Volume (K Unit) Forecast, by Application 2019 & 2032
- Table 19: Canada Voice Assistant Application Industry Revenue (Million) Forecast, by Application 2019 & 2032
- Table 20: Canada Voice Assistant Application Industry Volume (K Unit) Forecast, by Application 2019 & 2032
- Table 21: Mexico Voice Assistant Application Industry Revenue (Million) Forecast, by Application 2019 & 2032
- Table 22: Mexico Voice Assistant Application Industry Volume (K Unit) Forecast, by Application 2019 & 2032
- Table 23: Global Voice Assistant Application Industry Revenue Million Forecast, by Country 2019 & 2032
- Table 24: Global Voice Assistant Application Industry Volume K Unit Forecast, by Country 2019 & 2032
- Table 25: Germany Voice Assistant Application Industry Revenue (Million) Forecast, by Application 2019 & 2032
- Table 26: Germany Voice Assistant Application Industry Volume (K Unit) Forecast, by Application 2019 & 2032
- Table 27: United Kingdom Voice Assistant Application Industry Revenue (Million) Forecast, by Application 2019 & 2032
- Table 28: United Kingdom Voice Assistant Application Industry Volume (K Unit) Forecast, by Application 2019 & 2032
- Table 29: France Voice Assistant Application Industry Revenue (Million) Forecast, by Application 2019 & 2032
- Table 30: France Voice Assistant Application Industry Volume (K Unit) Forecast, by Application 2019 & 2032
- Table 31: Spain Voice Assistant Application Industry Revenue (Million) Forecast, by Application 2019 & 2032
- Table 32: Spain Voice Assistant Application Industry Volume (K Unit) Forecast, by Application 2019 & 2032
- Table 33: Italy Voice Assistant Application Industry Revenue (Million) Forecast, by Application 2019 & 2032
- Table 34: Italy Voice Assistant Application Industry Volume (K Unit) Forecast, by Application 2019 & 2032
- Table 35: Spain Voice Assistant Application Industry Revenue (Million) Forecast, by Application 2019 & 2032
- Table 36: Spain Voice Assistant Application Industry Volume (K Unit) Forecast, by Application 2019 & 2032
- Table 37: Belgium Voice Assistant Application Industry Revenue (Million) Forecast, by Application 2019 & 2032
- Table 38: Belgium Voice Assistant Application Industry Volume (K Unit) Forecast, by Application 2019 & 2032
- Table 39: Netherland Voice Assistant Application Industry Revenue (Million) Forecast, by Application 2019 & 2032
- Table 40: Netherland Voice Assistant Application Industry Volume (K Unit) Forecast, by Application 2019 & 2032
- Table 41: Nordics Voice Assistant Application Industry Revenue (Million) Forecast, by Application 2019 & 2032
- Table 42: Nordics Voice Assistant Application Industry Volume (K Unit) Forecast, by Application 2019 & 2032
- Table 43: Rest of Europe Voice Assistant Application Industry Revenue (Million) Forecast, by Application 2019 & 2032
- Table 44: Rest of Europe Voice Assistant Application Industry Volume (K Unit) Forecast, by Application 2019 & 2032
- Table 45: Global Voice Assistant Application Industry Revenue Million Forecast, by Country 2019 & 2032
- Table 46: Global Voice Assistant Application Industry Volume K Unit Forecast, by Country 2019 & 2032
- Table 47: China Voice Assistant Application Industry Revenue (Million) Forecast, by Application 2019 & 2032
- Table 48: China Voice Assistant Application Industry Volume (K Unit) Forecast, by Application 2019 & 2032
- Table 49: Japan Voice Assistant Application Industry Revenue (Million) Forecast, by Application 2019 & 2032
- Table 50: Japan Voice Assistant Application Industry Volume (K Unit) Forecast, by Application 2019 & 2032
- Table 51: India Voice Assistant Application Industry Revenue (Million) Forecast, by Application 2019 & 2032
- Table 52: India Voice Assistant Application Industry Volume (K Unit) Forecast, by Application 2019 & 2032
- Table 53: South Korea Voice Assistant Application Industry Revenue (Million) Forecast, by Application 2019 & 2032
- Table 54: South Korea Voice Assistant Application Industry Volume (K Unit) Forecast, by Application 2019 & 2032
- Table 55: Southeast Asia Voice Assistant Application Industry Revenue (Million) Forecast, by Application 2019 & 2032
- Table 56: Southeast Asia Voice Assistant Application Industry Volume (K Unit) Forecast, by Application 2019 & 2032
- Table 57: Australia Voice Assistant Application Industry Revenue (Million) Forecast, by Application 2019 & 2032
- Table 58: Australia Voice Assistant Application Industry Volume (K Unit) Forecast, by Application 2019 & 2032
- Table 59: Indonesia Voice Assistant Application Industry Revenue (Million) Forecast, by Application 2019 & 2032
- Table 60: Indonesia Voice Assistant Application Industry Volume (K Unit) Forecast, by Application 2019 & 2032
- Table 61: Phillipes Voice Assistant Application Industry Revenue (Million) Forecast, by Application 2019 & 2032
- Table 62: Phillipes Voice Assistant Application Industry Volume (K Unit) Forecast, by Application 2019 & 2032
- Table 63: Singapore Voice Assistant Application Industry Revenue (Million) Forecast, by Application 2019 & 2032
- Table 64: Singapore Voice Assistant Application Industry Volume (K Unit) Forecast, by Application 2019 & 2032
- Table 65: Thailandc Voice Assistant Application Industry Revenue (Million) Forecast, by Application 2019 & 2032
- Table 66: Thailandc Voice Assistant Application Industry Volume (K Unit) Forecast, by Application 2019 & 2032
- Table 67: Rest of Asia Pacific Voice Assistant Application Industry Revenue (Million) Forecast, by Application 2019 & 2032
- Table 68: Rest of Asia Pacific Voice Assistant Application Industry Volume (K Unit) Forecast, by Application 2019 & 2032
- Table 69: Global Voice Assistant Application Industry Revenue Million Forecast, by Country 2019 & 2032
- Table 70: Global Voice Assistant Application Industry Volume K Unit Forecast, by Country 2019 & 2032
- Table 71: Brazil Voice Assistant Application Industry Revenue (Million) Forecast, by Application 2019 & 2032
- Table 72: Brazil Voice Assistant Application Industry Volume (K Unit) Forecast, by Application 2019 & 2032
- Table 73: Argentina Voice Assistant Application Industry Revenue (Million) Forecast, by Application 2019 & 2032
- Table 74: Argentina Voice Assistant Application Industry Volume (K Unit) Forecast, by Application 2019 & 2032
- Table 75: Peru Voice Assistant Application Industry Revenue (Million) Forecast, by Application 2019 & 2032
- Table 76: Peru Voice Assistant Application Industry Volume (K Unit) Forecast, by Application 2019 & 2032
- Table 77: Chile Voice Assistant Application Industry Revenue (Million) Forecast, by Application 2019 & 2032
- Table 78: Chile Voice Assistant Application Industry Volume (K Unit) Forecast, by Application 2019 & 2032
- Table 79: Colombia Voice Assistant Application Industry Revenue (Million) Forecast, by Application 2019 & 2032
- Table 80: Colombia Voice Assistant Application Industry Volume (K Unit) Forecast, by Application 2019 & 2032
- Table 81: Ecuador Voice Assistant Application Industry Revenue (Million) Forecast, by Application 2019 & 2032
- Table 82: Ecuador Voice Assistant Application Industry Volume (K Unit) Forecast, by Application 2019 & 2032
- Table 83: Venezuela Voice Assistant Application Industry Revenue (Million) Forecast, by Application 2019 & 2032
- Table 84: Venezuela Voice Assistant Application Industry Volume (K Unit) Forecast, by Application 2019 & 2032
- Table 85: Rest of South America Voice Assistant Application Industry Revenue (Million) Forecast, by Application 2019 & 2032
- Table 86: Rest of South America Voice Assistant Application Industry Volume (K Unit) Forecast, by Application 2019 & 2032
- Table 87: Global Voice Assistant Application Industry Revenue Million Forecast, by Country 2019 & 2032
- Table 88: Global Voice Assistant Application Industry Volume K Unit Forecast, by Country 2019 & 2032
- Table 89: United States Voice Assistant Application Industry Revenue (Million) Forecast, by Application 2019 & 2032
- Table 90: United States Voice Assistant Application Industry Volume (K Unit) Forecast, by Application 2019 & 2032
- Table 91: Canada Voice Assistant Application Industry Revenue (Million) Forecast, by Application 2019 & 2032
- Table 92: Canada Voice Assistant Application Industry Volume (K Unit) Forecast, by Application 2019 & 2032
- Table 93: Mexico Voice Assistant Application Industry Revenue (Million) Forecast, by Application 2019 & 2032
- Table 94: Mexico Voice Assistant Application Industry Volume (K Unit) Forecast, by Application 2019 & 2032
- Table 95: Global Voice Assistant Application Industry Revenue Million Forecast, by Country 2019 & 2032
- Table 96: Global Voice Assistant Application Industry Volume K Unit Forecast, by Country 2019 & 2032
- Table 97: United Arab Emirates Voice Assistant Application Industry Revenue (Million) Forecast, by Application 2019 & 2032
- Table 98: United Arab Emirates Voice Assistant Application Industry Volume (K Unit) Forecast, by Application 2019 & 2032
- Table 99: Saudi Arabia Voice Assistant Application Industry Revenue (Million) Forecast, by Application 2019 & 2032
- Table 100: Saudi Arabia Voice Assistant Application Industry Volume (K Unit) Forecast, by Application 2019 & 2032
- Table 101: South Africa Voice Assistant Application Industry Revenue (Million) Forecast, by Application 2019 & 2032
- Table 102: South Africa Voice Assistant Application Industry Volume (K Unit) Forecast, by Application 2019 & 2032
- Table 103: Rest of Middle East and Africa Voice Assistant Application Industry Revenue (Million) Forecast, by Application 2019 & 2032
- Table 104: Rest of Middle East and Africa Voice Assistant Application Industry Volume (K Unit) Forecast, by Application 2019 & 2032
- Table 105: Global Voice Assistant Application Industry Revenue Million Forecast, by Component Type 2019 & 2032
- Table 106: Global Voice Assistant Application Industry Volume K Unit Forecast, by Component Type 2019 & 2032
- Table 107: Global Voice Assistant Application Industry Revenue Million Forecast, by Type of Technology 2019 & 2032
- Table 108: Global Voice Assistant Application Industry Volume K Unit Forecast, by Type of Technology 2019 & 2032
- Table 109: Global Voice Assistant Application Industry Revenue Million Forecast, by Deployment 2019 & 2032
- Table 110: Global Voice Assistant Application Industry Volume K Unit Forecast, by Deployment 2019 & 2032
- Table 111: Global Voice Assistant Application Industry Revenue Million Forecast, by Enterprise Size 2019 & 2032
- Table 112: Global Voice Assistant Application Industry Volume K Unit Forecast, by Enterprise Size 2019 & 2032
- Table 113: Global Voice Assistant Application Industry Revenue Million Forecast, by End-user Verticals 2019 & 2032
- Table 114: Global Voice Assistant Application Industry Volume K Unit Forecast, by End-user Verticals 2019 & 2032
- Table 115: Global Voice Assistant Application Industry Revenue Million Forecast, by Country 2019 & 2032
- Table 116: Global Voice Assistant Application Industry Volume K Unit Forecast, by Country 2019 & 2032
- Table 117: Global Voice Assistant Application Industry Revenue Million Forecast, by Component Type 2019 & 2032
- Table 118: Global Voice Assistant Application Industry Volume K Unit Forecast, by Component Type 2019 & 2032
- Table 119: Global Voice Assistant Application Industry Revenue Million Forecast, by Type of Technology 2019 & 2032
- Table 120: Global Voice Assistant Application Industry Volume K Unit Forecast, by Type of Technology 2019 & 2032
- Table 121: Global Voice Assistant Application Industry Revenue Million Forecast, by Deployment 2019 & 2032
- Table 122: Global Voice Assistant Application Industry Volume K Unit Forecast, by Deployment 2019 & 2032
- Table 123: Global Voice Assistant Application Industry Revenue Million Forecast, by Enterprise Size 2019 & 2032
- Table 124: Global Voice Assistant Application Industry Volume K Unit Forecast, by Enterprise Size 2019 & 2032
- Table 125: Global Voice Assistant Application Industry Revenue Million Forecast, by End-user Verticals 2019 & 2032
- Table 126: Global Voice Assistant Application Industry Volume K Unit Forecast, by End-user Verticals 2019 & 2032
- Table 127: Global Voice Assistant Application Industry Revenue Million Forecast, by Country 2019 & 2032
- Table 128: Global Voice Assistant Application Industry Volume K Unit Forecast, by Country 2019 & 2032
- Table 129: Global Voice Assistant Application Industry Revenue Million Forecast, by Component Type 2019 & 2032
- Table 130: Global Voice Assistant Application Industry Volume K Unit Forecast, by Component Type 2019 & 2032
- Table 131: Global Voice Assistant Application Industry Revenue Million Forecast, by Type of Technology 2019 & 2032
- Table 132: Global Voice Assistant Application Industry Volume K Unit Forecast, by Type of Technology 2019 & 2032
- Table 133: Global Voice Assistant Application Industry Revenue Million Forecast, by Deployment 2019 & 2032
- Table 134: Global Voice Assistant Application Industry Volume K Unit Forecast, by Deployment 2019 & 2032
- Table 135: Global Voice Assistant Application Industry Revenue Million Forecast, by Enterprise Size 2019 & 2032
- Table 136: Global Voice Assistant Application Industry Volume K Unit Forecast, by Enterprise Size 2019 & 2032
- Table 137: Global Voice Assistant Application Industry Revenue Million Forecast, by End-user Verticals 2019 & 2032
- Table 138: Global Voice Assistant Application Industry Volume K Unit Forecast, by End-user Verticals 2019 & 2032
- Table 139: Global Voice Assistant Application Industry Revenue Million Forecast, by Country 2019 & 2032
- Table 140: Global Voice Assistant Application Industry Volume K Unit Forecast, by Country 2019 & 2032
- Table 141: Global Voice Assistant Application Industry Revenue Million Forecast, by Component Type 2019 & 2032
- Table 142: Global Voice Assistant Application Industry Volume K Unit Forecast, by Component Type 2019 & 2032
- Table 143: Global Voice Assistant Application Industry Revenue Million Forecast, by Type of Technology 2019 & 2032
- Table 144: Global Voice Assistant Application Industry Volume K Unit Forecast, by Type of Technology 2019 & 2032
- Table 145: Global Voice Assistant Application Industry Revenue Million Forecast, by Deployment 2019 & 2032
- Table 146: Global Voice Assistant Application Industry Volume K Unit Forecast, by Deployment 2019 & 2032
- Table 147: Global Voice Assistant Application Industry Revenue Million Forecast, by Enterprise Size 2019 & 2032
- Table 148: Global Voice Assistant Application Industry Volume K Unit Forecast, by Enterprise Size 2019 & 2032
- Table 149: Global Voice Assistant Application Industry Revenue Million Forecast, by End-user Verticals 2019 & 2032
- Table 150: Global Voice Assistant Application Industry Volume K Unit Forecast, by End-user Verticals 2019 & 2032
- Table 151: Global Voice Assistant Application Industry Revenue Million Forecast, by Country 2019 & 2032
- Table 152: Global Voice Assistant Application Industry Volume K Unit Forecast, by Country 2019 & 2032
- Table 153: Global Voice Assistant Application Industry Revenue Million Forecast, by Component Type 2019 & 2032
- Table 154: Global Voice Assistant Application Industry Volume K Unit Forecast, by Component Type 2019 & 2032
- Table 155: Global Voice Assistant Application Industry Revenue Million Forecast, by Type of Technology 2019 & 2032
- Table 156: Global Voice Assistant Application Industry Volume K Unit Forecast, by Type of Technology 2019 & 2032
- Table 157: Global Voice Assistant Application Industry Revenue Million Forecast, by Deployment 2019 & 2032
- Table 158: Global Voice Assistant Application Industry Volume K Unit Forecast, by Deployment 2019 & 2032
- Table 159: Global Voice Assistant Application Industry Revenue Million Forecast, by Enterprise Size 2019 & 2032
- Table 160: Global Voice Assistant Application Industry Volume K Unit Forecast, by Enterprise Size 2019 & 2032
- Table 161: Global Voice Assistant Application Industry Revenue Million Forecast, by End-user Verticals 2019 & 2032
- Table 162: Global Voice Assistant Application Industry Volume K Unit Forecast, by End-user Verticals 2019 & 2032
- Table 163: Global Voice Assistant Application Industry Revenue Million Forecast, by Country 2019 & 2032
- Table 164: Global Voice Assistant Application Industry Volume K Unit Forecast, by Country 2019 & 2032
Frequently Asked Questions
1. What is the projected Compound Annual Growth Rate (CAGR) of the Voice Assistant Application Industry?
The projected CAGR is approximately 27.30%.
2. Which companies are prominent players in the Voice Assistant Application Industry?
Key companies in the market include Nuance Communications Inc, Samsung Group, IBM Corporation, Let's Nurture Infotech Pvt Ltd, Google LLC (Alphabet Inc ), Microsoft Corporation, Amazon Web Services Inc, Oracle Corporation, Apple Inc, Salesforce com inc.
3. What are the main segments of the Voice Assistant Application Industry?
The market segments include Component Type, Type of Technology, Deployment, Enterprise Size, End-user Verticals.
4. Can you provide details about the market size?
The market size is estimated to be USD XX Million as of 2022.
5. What are some drivers contributing to market growth?
Rising Usage of Cutting-edge Technology-based Connected Devices.
6. What are the notable trends driving market growth?
Healthcare Vertical is Expected to Grow Significantly Over the Forecast Period.
7. Are there any restraints impacting market growth?
Lack of Skilled Labor; Unsupervised Learning.
8. Can you provide examples of recent developments in the market?
November 2022: In collaboration with enterprise conversational AI startup Yellow.ai, Sony has unveiled a new voice assistant for customer support in India. The new "Isha" AI is a multilingual virtual agent that can converse with clients in Bengali, Hindi, and English while providing answers to their questions or, if necessary, connecting them to human agents.
9. What pricing options are available for accessing the report?
Pricing options include single-user, multi-user, and enterprise licenses priced at USD 4750, USD 5250, and USD 8750 respectively.
10. Is the market size provided in terms of value or volume?
The market size is provided in terms of value, measured in Million and volume, measured in K Unit.
11. Are there any specific market keywords associated with the report?
Yes, the market keyword associated with the report is "Voice Assistant Application Industry," which aids in identifying and referencing the specific market segment covered.
12. How do I determine which pricing option suits my needs best?
The pricing options vary based on user requirements and access needs. Individual users may opt for single-user licenses, while businesses requiring broader access may choose multi-user or enterprise licenses for cost-effective access to the report.
13. Are there any additional resources or data provided in the Voice Assistant Application Industry report?
While the report offers comprehensive insights, it's advisable to review the specific contents or supplementary materials provided to ascertain if additional resources or data are available.
14. How can I stay updated on further developments or reports in the Voice Assistant Application Industry?
To stay informed about further developments, trends, and reports in the Voice Assistant Application Industry, consider subscribing to industry newsletters, following relevant companies and organizations, or regularly checking reputable industry news sources and publications.
Methodology
Step 1 - Identification of Relevant Samples Size from Population Database


Step 2 - Approaches for Defining Global Market Size (Value, Volume* & Price*)

Note*: In applicable scenarios
Step 3 - Data Sources
Primary Research
- Web Analytics
- Survey Reports
- Research Institute
- Latest Research Reports
- Opinion Leaders
Secondary Research
- Annual Reports
- White Paper
- Latest Press Release
- Industry Association
- Paid Database
- Investor Presentations

Step 4 - Data Triangulation
Involves using different sources of information in order to increase the validity of a study
These sources are likely to be stakeholders in a program - participants, other researchers, program staff, other community members, and so on.
Then we put all data in single framework & apply various statistical tools to find out the dynamic on the market.
During the analysis stage, feedback from the stakeholder groups would be compared to determine areas of agreement as well as areas of divergence


