
Key Insights
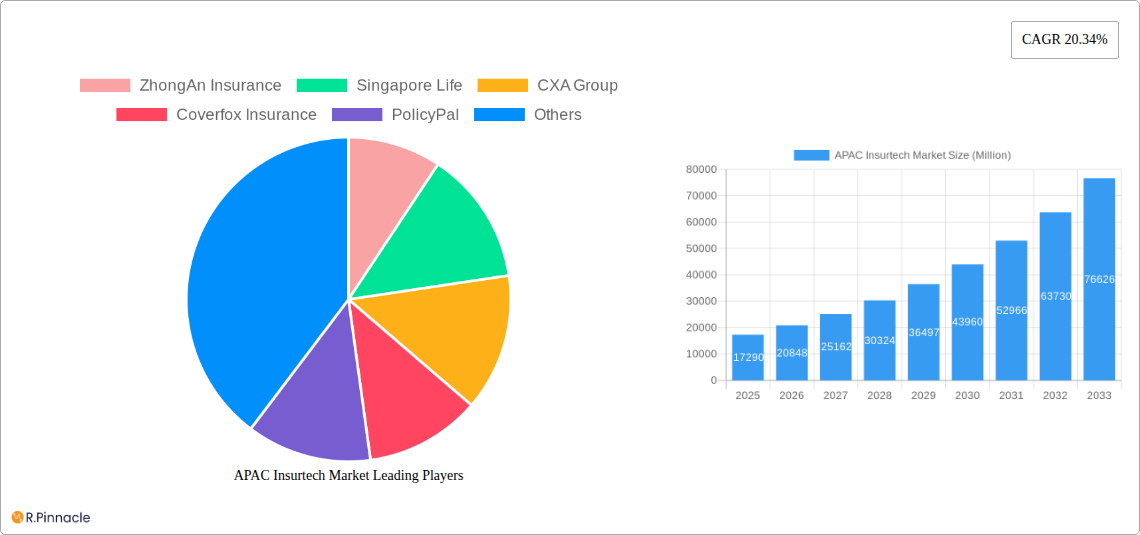
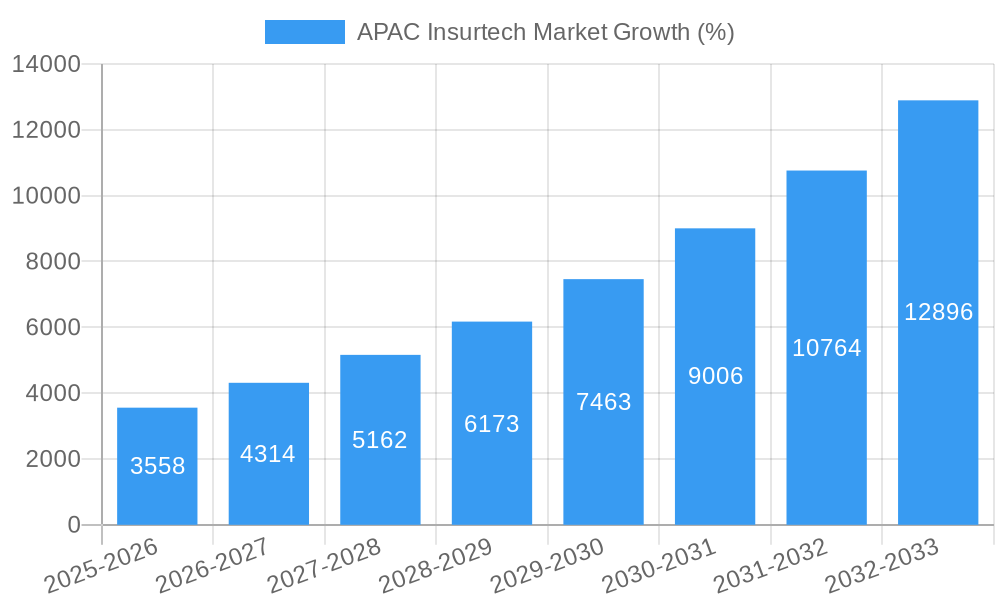
The APAC Insurtech market is experiencing explosive growth, projected to reach \$17.29 billion in 2025 and exhibiting a remarkable Compound Annual Growth Rate (CAGR) of 20.34% from 2019 to 2033. This surge is driven by several key factors. Firstly, the region's burgeoning digital economy and increasing smartphone penetration are creating a fertile ground for the adoption of digital insurance solutions. Consumers are increasingly demanding convenient, personalized, and cost-effective insurance products, which Insurtech companies are effectively delivering through innovative technology platforms and mobile-first strategies. Furthermore, the supportive regulatory environment in many APAC nations, coupled with substantial investments in fintech and Insurtech, is further accelerating market expansion. Key drivers include the rising demand for health insurance, the increasing adoption of embedded insurance within various platforms, and the growing awareness of the benefits of personalized and data-driven insurance policies. The market's robust growth is expected to continue throughout the forecast period (2025-2033), fueled by ongoing technological advancements, evolving consumer preferences, and strategic partnerships between Insurtech startups and established players.
Competition in the APAC Insurtech market is fierce, with a diverse range of companies vying for market share. Established players like ZhongAn Insurance and PolicyBazaar are competing alongside nimble startups such as Acko General Insurance and Digit Insurance. These companies are leveraging artificial intelligence (AI), machine learning (ML), and big data analytics to offer enhanced customer experiences, improve risk assessment, and streamline operations. The market is segmented by insurance type (e.g., health, life, property), distribution channels (e.g., online, mobile apps, partnerships), and customer demographics. While challenges remain, such as regulatory hurdles in certain markets and concerns regarding data security and privacy, the overall outlook for the APAC Insurtech market remains exceptionally positive, with significant growth opportunities for both established and emerging players. The market's future trajectory will depend on the successful navigation of these challenges and the continuous innovation and adoption of cutting-edge technologies.
APAC Insurtech Market Report: 2019-2033 Forecast
This comprehensive report provides an in-depth analysis of the Asia-Pacific Insurtech market, offering invaluable insights for industry professionals, investors, and strategic planners. Covering the period from 2019 to 2033, with a focus on 2025, this report unveils the market's structure, dynamics, dominant players, and future potential. With detailed segmentation and meticulous data analysis, it equips readers to navigate the complexities of this rapidly evolving sector.
APAC Insurtech Market Structure & Innovation Trends
This section analyzes the APAC Insurtech market's competitive landscape, encompassing market concentration, innovation drivers, regulatory frameworks, and M&A activities. The study period (2019-2024) reveals a dynamic market with significant growth and consolidation.
- Market Concentration: While the market is relatively fragmented, certain players like ZhongAn Insurance and PolicyBazaar hold significant market share (estimated at xx% and xx% respectively in 2025). The market concentration ratio (CR4) is estimated at xx% in 2025.
- Innovation Drivers: Technological advancements, such as AI, blockchain, and big data analytics, are driving innovation. Growing demand for personalized insurance products and efficient claims processes further fuels this trend.
- Regulatory Frameworks: Varying regulatory landscapes across APAC nations significantly impact market growth. Stringent regulations in some countries may hinder expansion, while supportive policies in others foster innovation.
- Product Substitutes: Fintech solutions, particularly in digital payments and lending, pose a competitive threat to some Insurtech offerings.
- End-User Demographics: The burgeoning middle class across APAC, coupled with increasing internet and smartphone penetration, fuels demand for Insurtech solutions.
- M&A Activities: The APAC Insurtech market has witnessed several significant mergers and acquisitions in recent years. Total M&A deal value for the period 2019-2024 is estimated at $xx Million. Notable deals included the partnership between BlackRock and Citi with Singlife (March 2023).
APAC Insurtech Market Dynamics & Trends
This section explores the key market dynamics, including growth drivers, technological disruptions, consumer preferences, and competitive dynamics. The APAC Insurtech market exhibits a robust Compound Annual Growth Rate (CAGR) of xx% during the forecast period (2025-2033). Market penetration, currently at xx%, is expected to reach xx% by 2033.
The market is driven by factors like increasing smartphone penetration, growing demand for digital insurance products, and supportive government initiatives. Technological advancements like AI-powered claims processing and personalized risk assessment are transforming the industry, enhancing efficiency and customer experience. Changing consumer preferences towards convenience and seamless digital experiences are further propelling market growth. Intense competition among established players and emerging startups contributes to rapid innovation and market expansion.
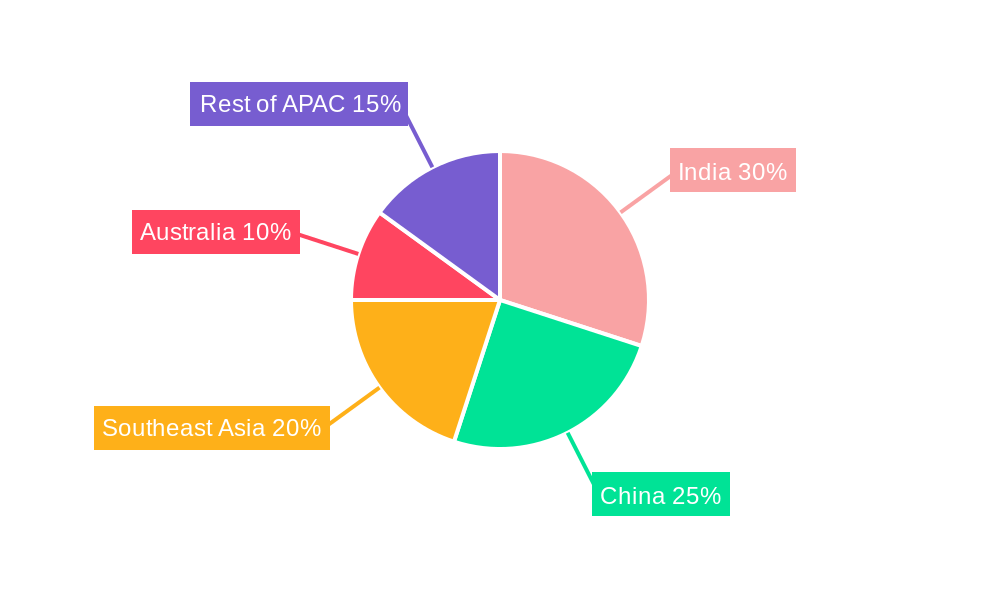
Dominant Regions & Segments in APAC Insurtech Market
India and China are currently the leading markets within APAC, driven by significant population size, increasing digital adoption, and burgeoning demand for insurance products.
Key Drivers for India & China:
- Strong Economic Growth: Both countries are experiencing substantial economic growth, leading to increased disposable income and insurance demand.
- Favorable Government Policies: Supportive regulations and initiatives to promote digital financial inclusion are contributing to market expansion.
- Technological Infrastructure: Robust digital infrastructure, including widespread internet and mobile penetration, facilitates the adoption of Insurtech solutions.
This dominance is further solidified by factors such as burgeoning middle classes, rising disposable incomes, and government initiatives supporting digital financial inclusion. Other countries within APAC such as Singapore and Indonesia show significant promise with rising demand for convenient, digitally enabled insurance solutions.
APAC Insurtech Market Product Innovations
The APAC Insurtech market showcases significant product innovation, driven by technological advancements. New product offerings leverage AI for personalized risk assessment, blockchain for enhanced security and transparency, and big data analytics for improved customer segmentation and targeted marketing. These innovations cater to changing consumer preferences for customized and digitally accessible insurance products, improving market fit and strengthening competitive advantages.
Report Scope & Segmentation Analysis
This report segments the APAC Insurtech market based on various factors including product type (life insurance, health insurance, property insurance, etc.), distribution channel (online, offline), and technology (AI, blockchain, etc.). Each segment presents unique growth projections, market sizes, and competitive dynamics, offering a granular view of the market landscape. Market size projections for each segment are available for the forecast period (2025-2033).
Key Drivers of APAC Insurtech Market Growth
Several key factors are driving the growth of the APAC Insurtech market. These include:
- Technological advancements: AI, machine learning, and big data analytics are transforming insurance operations, leading to greater efficiency and personalized services.
- Rising smartphone penetration: Increased mobile phone usage facilitates access to online insurance platforms and services.
- Government initiatives: Supportive government policies promoting digital financial inclusion are fostering market growth.
- Growing middle class: A burgeoning middle class in many APAC nations translates into greater demand for insurance products.
Challenges in the APAC Insurtech Market Sector
Despite significant growth potential, the APAC Insurtech market faces several challenges.
- Regulatory hurdles: Differing regulatory frameworks across various APAC countries create complexities for market expansion. Inconsistency in regulations can hinder cross-border operations and limit market scalability.
- Data security and privacy concerns: The increasing reliance on digital technologies raises concerns about data security and consumer privacy.
- Competition: The market is highly competitive, with both established insurers and new entrants vying for market share.
Emerging Opportunities in APAC Insurtech Market
The APAC Insurtech market presents several emerging opportunities for growth. These include:
- Expansion into underserved markets: Significant opportunities exist in reaching underserved populations across APAC.
- Development of innovative insurance products: Creating innovative products tailored to specific consumer needs can unlock significant growth potential.
- Strategic partnerships: Collaborations between Insurtech companies and traditional insurers can lead to synergies and accelerate market expansion.
Leading Players in the APAC Insurtech Market Market
- ZhongAn Insurance
- Singapore Life
- CXA Group
- Coverfox Insurance
- PolicyPal
- PolicyBazaar
- Acko General Insurance Ltd
- WaterDrop
- Digit Insurance
- CompareAsiaGroup
- GoBear
- SmartHR
- Prenetics
- PasarPolis
Key Developments in APAC Insurtech Market Industry
- May 2024: MyGate, a housing society management app, obtained an aggregator license from IRDAI to distribute insurance policies in India, marking a significant expansion of insurance distribution channels.
- March 2023: BlackRock and Citi partnered with Singlife, integrating BlackRock Aladdin and Citi's technology to enhance portfolio management capabilities, productivity, and automation for Singlife's clients.
Future Outlook for APAC Insurtech Market Market
The APAC Insurtech market is poised for continued strong growth, driven by technological advancements, increasing digital adoption, and supportive government policies. Opportunities abound in developing innovative products, expanding into underserved markets, and forging strategic partnerships. The market's future hinges on addressing challenges related to data security, regulatory compliance, and intense competition. Continued innovation and strategic adaptation will be crucial for success in this dynamic market.
APAC Insurtech Market Segmentation
-
1. Insurance Line
- 1.1. Health
- 1.2. Life
- 1.3. Non-life
APAC Insurtech Market Segmentation By Geography
-
1. North America
- 1.1. United States
- 1.2. Canada
- 1.3. Mexico
-
2. South America
- 2.1. Brazil
- 2.2. Argentina
- 2.3. Rest of South America
-
3. Europe
- 3.1. United Kingdom
- 3.2. Germany
- 3.3. France
- 3.4. Italy
- 3.5. Spain
- 3.6. Russia
- 3.7. Benelux
- 3.8. Nordics
- 3.9. Rest of Europe
-
4. Middle East & Africa
- 4.1. Turkey
- 4.2. Israel
- 4.3. GCC
- 4.4. North Africa
- 4.5. South Africa
- 4.6. Rest of Middle East & Africa
-
5. Asia Pacific
- 5.1. China
- 5.2. India
- 5.3. Japan
- 5.4. South Korea
- 5.5. ASEAN
- 5.6. Oceania
- 5.7. Rest of Asia Pacific
APAC Insurtech Market REPORT HIGHLIGHTS
| Aspects | Details |
|---|---|
| Study Period | 2019-2033 |
| Base Year | 2024 |
| Estimated Year | 2025 |
| Forecast Period | 2025-2033 |
| Historical Period | 2019-2024 |
| Growth Rate | CAGR of 20.34% from 2019-2033 |
| Segmentation |
|
Table of Contents
- 1. Introduction
- 1.1. Research Scope
- 1.2. Market Segmentation
- 1.3. Research Methodology
- 1.4. Definitions and Assumptions
- 2. Executive Summary
- 2.1. Introduction
- 3. Market Dynamics
- 3.1. Introduction
- 3.2. Market Drivers
- 3.2.1. Increasing Adoption of Digital Technologies; Rise of Big Data and Advanced Analytics
- 3.3. Market Restrains
- 3.3.1. Increasing Adoption of Digital Technologies; Rise of Big Data and Advanced Analytics
- 3.4. Market Trends
- 3.4.1. Rise in Non-life Insurance Fueling the APAC Insurtech Market
- 4. Market Factor Analysis
- 4.1. Porters Five Forces
- 4.2. Supply/Value Chain
- 4.3. PESTEL analysis
- 4.4. Market Entropy
- 4.5. Patent/Trademark Analysis
- 5. Global APAC Insurtech Market Analysis, Insights and Forecast, 2019-2031
- 5.1. Market Analysis, Insights and Forecast - by Insurance Line
- 5.1.1. Health
- 5.1.2. Life
- 5.1.3. Non-life
- 5.2. Market Analysis, Insights and Forecast - by Region
- 5.2.1. North America
- 5.2.2. South America
- 5.2.3. Europe
- 5.2.4. Middle East & Africa
- 5.2.5. Asia Pacific
- 5.1. Market Analysis, Insights and Forecast - by Insurance Line
- 6. North America APAC Insurtech Market Analysis, Insights and Forecast, 2019-2031
- 6.1. Market Analysis, Insights and Forecast - by Insurance Line
- 6.1.1. Health
- 6.1.2. Life
- 6.1.3. Non-life
- 6.1. Market Analysis, Insights and Forecast - by Insurance Line
- 7. South America APAC Insurtech Market Analysis, Insights and Forecast, 2019-2031
- 7.1. Market Analysis, Insights and Forecast - by Insurance Line
- 7.1.1. Health
- 7.1.2. Life
- 7.1.3. Non-life
- 7.1. Market Analysis, Insights and Forecast - by Insurance Line
- 8. Europe APAC Insurtech Market Analysis, Insights and Forecast, 2019-2031
- 8.1. Market Analysis, Insights and Forecast - by Insurance Line
- 8.1.1. Health
- 8.1.2. Life
- 8.1.3. Non-life
- 8.1. Market Analysis, Insights and Forecast - by Insurance Line
- 9. Middle East & Africa APAC Insurtech Market Analysis, Insights and Forecast, 2019-2031
- 9.1. Market Analysis, Insights and Forecast - by Insurance Line
- 9.1.1. Health
- 9.1.2. Life
- 9.1.3. Non-life
- 9.1. Market Analysis, Insights and Forecast - by Insurance Line
- 10. Asia Pacific APAC Insurtech Market Analysis, Insights and Forecast, 2019-2031
- 10.1. Market Analysis, Insights and Forecast - by Insurance Line
- 10.1.1. Health
- 10.1.2. Life
- 10.1.3. Non-life
- 10.1. Market Analysis, Insights and Forecast - by Insurance Line
- 11. Competitive Analysis
- 11.1. Global Market Share Analysis 2024
- 11.2. Company Profiles
- 11.2.1 ZhongAn Insurance
- 11.2.1.1. Overview
- 11.2.1.2. Products
- 11.2.1.3. SWOT Analysis
- 11.2.1.4. Recent Developments
- 11.2.1.5. Financials (Based on Availability)
- 11.2.2 Singapore Life
- 11.2.2.1. Overview
- 11.2.2.2. Products
- 11.2.2.3. SWOT Analysis
- 11.2.2.4. Recent Developments
- 11.2.2.5. Financials (Based on Availability)
- 11.2.3 CXA Group
- 11.2.3.1. Overview
- 11.2.3.2. Products
- 11.2.3.3. SWOT Analysis
- 11.2.3.4. Recent Developments
- 11.2.3.5. Financials (Based on Availability)
- 11.2.4 Coverfox Insurance
- 11.2.4.1. Overview
- 11.2.4.2. Products
- 11.2.4.3. SWOT Analysis
- 11.2.4.4. Recent Developments
- 11.2.4.5. Financials (Based on Availability)
- 11.2.5 PolicyPal
- 11.2.5.1. Overview
- 11.2.5.2. Products
- 11.2.5.3. SWOT Analysis
- 11.2.5.4. Recent Developments
- 11.2.5.5. Financials (Based on Availability)
- 11.2.6 PolicyBazaar
- 11.2.6.1. Overview
- 11.2.6.2. Products
- 11.2.6.3. SWOT Analysis
- 11.2.6.4. Recent Developments
- 11.2.6.5. Financials (Based on Availability)
- 11.2.7 Acko General Insurance Ltd
- 11.2.7.1. Overview
- 11.2.7.2. Products
- 11.2.7.3. SWOT Analysis
- 11.2.7.4. Recent Developments
- 11.2.7.5. Financials (Based on Availability)
- 11.2.8 WaterDrop
- 11.2.8.1. Overview
- 11.2.8.2. Products
- 11.2.8.3. SWOT Analysis
- 11.2.8.4. Recent Developments
- 11.2.8.5. Financials (Based on Availability)
- 11.2.9 Digit Insurance
- 11.2.9.1. Overview
- 11.2.9.2. Products
- 11.2.9.3. SWOT Analysis
- 11.2.9.4. Recent Developments
- 11.2.9.5. Financials (Based on Availability)
- 11.2.10 CompareAsiaGroup
- 11.2.10.1. Overview
- 11.2.10.2. Products
- 11.2.10.3. SWOT Analysis
- 11.2.10.4. Recent Developments
- 11.2.10.5. Financials (Based on Availability)
- 11.2.11 GoBear
- 11.2.11.1. Overview
- 11.2.11.2. Products
- 11.2.11.3. SWOT Analysis
- 11.2.11.4. Recent Developments
- 11.2.11.5. Financials (Based on Availability)
- 11.2.12 SmartHR
- 11.2.12.1. Overview
- 11.2.12.2. Products
- 11.2.12.3. SWOT Analysis
- 11.2.12.4. Recent Developments
- 11.2.12.5. Financials (Based on Availability)
- 11.2.13 Prenetics
- 11.2.13.1. Overview
- 11.2.13.2. Products
- 11.2.13.3. SWOT Analysis
- 11.2.13.4. Recent Developments
- 11.2.13.5. Financials (Based on Availability)
- 11.2.14 PasarPolis**List Not Exhaustive
- 11.2.14.1. Overview
- 11.2.14.2. Products
- 11.2.14.3. SWOT Analysis
- 11.2.14.4. Recent Developments
- 11.2.14.5. Financials (Based on Availability)
- 11.2.1 ZhongAn Insurance
List of Figures
- Figure 1: Global APAC Insurtech Market Revenue Breakdown (Million, %) by Region 2024 & 2032
- Figure 2: Global APAC Insurtech Market Volume Breakdown (Billion, %) by Region 2024 & 2032
- Figure 3: North America APAC Insurtech Market Revenue (Million), by Insurance Line 2024 & 2032
- Figure 4: North America APAC Insurtech Market Volume (Billion), by Insurance Line 2024 & 2032
- Figure 5: North America APAC Insurtech Market Revenue Share (%), by Insurance Line 2024 & 2032
- Figure 6: North America APAC Insurtech Market Volume Share (%), by Insurance Line 2024 & 2032
- Figure 7: North America APAC Insurtech Market Revenue (Million), by Country 2024 & 2032
- Figure 8: North America APAC Insurtech Market Volume (Billion), by Country 2024 & 2032
- Figure 9: North America APAC Insurtech Market Revenue Share (%), by Country 2024 & 2032
- Figure 10: North America APAC Insurtech Market Volume Share (%), by Country 2024 & 2032
- Figure 11: South America APAC Insurtech Market Revenue (Million), by Insurance Line 2024 & 2032
- Figure 12: South America APAC Insurtech Market Volume (Billion), by Insurance Line 2024 & 2032
- Figure 13: South America APAC Insurtech Market Revenue Share (%), by Insurance Line 2024 & 2032
- Figure 14: South America APAC Insurtech Market Volume Share (%), by Insurance Line 2024 & 2032
- Figure 15: South America APAC Insurtech Market Revenue (Million), by Country 2024 & 2032
- Figure 16: South America APAC Insurtech Market Volume (Billion), by Country 2024 & 2032
- Figure 17: South America APAC Insurtech Market Revenue Share (%), by Country 2024 & 2032
- Figure 18: South America APAC Insurtech Market Volume Share (%), by Country 2024 & 2032
- Figure 19: Europe APAC Insurtech Market Revenue (Million), by Insurance Line 2024 & 2032
- Figure 20: Europe APAC Insurtech Market Volume (Billion), by Insurance Line 2024 & 2032
- Figure 21: Europe APAC Insurtech Market Revenue Share (%), by Insurance Line 2024 & 2032
- Figure 22: Europe APAC Insurtech Market Volume Share (%), by Insurance Line 2024 & 2032
- Figure 23: Europe APAC Insurtech Market Revenue (Million), by Country 2024 & 2032
- Figure 24: Europe APAC Insurtech Market Volume (Billion), by Country 2024 & 2032
- Figure 25: Europe APAC Insurtech Market Revenue Share (%), by Country 2024 & 2032
- Figure 26: Europe APAC Insurtech Market Volume Share (%), by Country 2024 & 2032
- Figure 27: Middle East & Africa APAC Insurtech Market Revenue (Million), by Insurance Line 2024 & 2032
- Figure 28: Middle East & Africa APAC Insurtech Market Volume (Billion), by Insurance Line 2024 & 2032
- Figure 29: Middle East & Africa APAC Insurtech Market Revenue Share (%), by Insurance Line 2024 & 2032
- Figure 30: Middle East & Africa APAC Insurtech Market Volume Share (%), by Insurance Line 2024 & 2032
- Figure 31: Middle East & Africa APAC Insurtech Market Revenue (Million), by Country 2024 & 2032
- Figure 32: Middle East & Africa APAC Insurtech Market Volume (Billion), by Country 2024 & 2032
- Figure 33: Middle East & Africa APAC Insurtech Market Revenue Share (%), by Country 2024 & 2032
- Figure 34: Middle East & Africa APAC Insurtech Market Volume Share (%), by Country 2024 & 2032
- Figure 35: Asia Pacific APAC Insurtech Market Revenue (Million), by Insurance Line 2024 & 2032
- Figure 36: Asia Pacific APAC Insurtech Market Volume (Billion), by Insurance Line 2024 & 2032
- Figure 37: Asia Pacific APAC Insurtech Market Revenue Share (%), by Insurance Line 2024 & 2032
- Figure 38: Asia Pacific APAC Insurtech Market Volume Share (%), by Insurance Line 2024 & 2032
- Figure 39: Asia Pacific APAC Insurtech Market Revenue (Million), by Country 2024 & 2032
- Figure 40: Asia Pacific APAC Insurtech Market Volume (Billion), by Country 2024 & 2032
- Figure 41: Asia Pacific APAC Insurtech Market Revenue Share (%), by Country 2024 & 2032
- Figure 42: Asia Pacific APAC Insurtech Market Volume Share (%), by Country 2024 & 2032
List of Tables
- Table 1: Global APAC Insurtech Market Revenue Million Forecast, by Region 2019 & 2032
- Table 2: Global APAC Insurtech Market Volume Billion Forecast, by Region 2019 & 2032
- Table 3: Global APAC Insurtech Market Revenue Million Forecast, by Insurance Line 2019 & 2032
- Table 4: Global APAC Insurtech Market Volume Billion Forecast, by Insurance Line 2019 & 2032
- Table 5: Global APAC Insurtech Market Revenue Million Forecast, by Region 2019 & 2032
- Table 6: Global APAC Insurtech Market Volume Billion Forecast, by Region 2019 & 2032
- Table 7: Global APAC Insurtech Market Revenue Million Forecast, by Insurance Line 2019 & 2032
- Table 8: Global APAC Insurtech Market Volume Billion Forecast, by Insurance Line 2019 & 2032
- Table 9: Global APAC Insurtech Market Revenue Million Forecast, by Country 2019 & 2032
- Table 10: Global APAC Insurtech Market Volume Billion Forecast, by Country 2019 & 2032
- Table 11: United States APAC Insurtech Market Revenue (Million) Forecast, by Application 2019 & 2032
- Table 12: United States APAC Insurtech Market Volume (Billion) Forecast, by Application 2019 & 2032
- Table 13: Canada APAC Insurtech Market Revenue (Million) Forecast, by Application 2019 & 2032
- Table 14: Canada APAC Insurtech Market Volume (Billion) Forecast, by Application 2019 & 2032
- Table 15: Mexico APAC Insurtech Market Revenue (Million) Forecast, by Application 2019 & 2032
- Table 16: Mexico APAC Insurtech Market Volume (Billion) Forecast, by Application 2019 & 2032
- Table 17: Global APAC Insurtech Market Revenue Million Forecast, by Insurance Line 2019 & 2032
- Table 18: Global APAC Insurtech Market Volume Billion Forecast, by Insurance Line 2019 & 2032
- Table 19: Global APAC Insurtech Market Revenue Million Forecast, by Country 2019 & 2032
- Table 20: Global APAC Insurtech Market Volume Billion Forecast, by Country 2019 & 2032
- Table 21: Brazil APAC Insurtech Market Revenue (Million) Forecast, by Application 2019 & 2032
- Table 22: Brazil APAC Insurtech Market Volume (Billion) Forecast, by Application 2019 & 2032
- Table 23: Argentina APAC Insurtech Market Revenue (Million) Forecast, by Application 2019 & 2032
- Table 24: Argentina APAC Insurtech Market Volume (Billion) Forecast, by Application 2019 & 2032
- Table 25: Rest of South America APAC Insurtech Market Revenue (Million) Forecast, by Application 2019 & 2032
- Table 26: Rest of South America APAC Insurtech Market Volume (Billion) Forecast, by Application 2019 & 2032
- Table 27: Global APAC Insurtech Market Revenue Million Forecast, by Insurance Line 2019 & 2032
- Table 28: Global APAC Insurtech Market Volume Billion Forecast, by Insurance Line 2019 & 2032
- Table 29: Global APAC Insurtech Market Revenue Million Forecast, by Country 2019 & 2032
- Table 30: Global APAC Insurtech Market Volume Billion Forecast, by Country 2019 & 2032
- Table 31: United Kingdom APAC Insurtech Market Revenue (Million) Forecast, by Application 2019 & 2032
- Table 32: United Kingdom APAC Insurtech Market Volume (Billion) Forecast, by Application 2019 & 2032
- Table 33: Germany APAC Insurtech Market Revenue (Million) Forecast, by Application 2019 & 2032
- Table 34: Germany APAC Insurtech Market Volume (Billion) Forecast, by Application 2019 & 2032
- Table 35: France APAC Insurtech Market Revenue (Million) Forecast, by Application 2019 & 2032
- Table 36: France APAC Insurtech Market Volume (Billion) Forecast, by Application 2019 & 2032
- Table 37: Italy APAC Insurtech Market Revenue (Million) Forecast, by Application 2019 & 2032
- Table 38: Italy APAC Insurtech Market Volume (Billion) Forecast, by Application 2019 & 2032
- Table 39: Spain APAC Insurtech Market Revenue (Million) Forecast, by Application 2019 & 2032
- Table 40: Spain APAC Insurtech Market Volume (Billion) Forecast, by Application 2019 & 2032
- Table 41: Russia APAC Insurtech Market Revenue (Million) Forecast, by Application 2019 & 2032
- Table 42: Russia APAC Insurtech Market Volume (Billion) Forecast, by Application 2019 & 2032
- Table 43: Benelux APAC Insurtech Market Revenue (Million) Forecast, by Application 2019 & 2032
- Table 44: Benelux APAC Insurtech Market Volume (Billion) Forecast, by Application 2019 & 2032
- Table 45: Nordics APAC Insurtech Market Revenue (Million) Forecast, by Application 2019 & 2032
- Table 46: Nordics APAC Insurtech Market Volume (Billion) Forecast, by Application 2019 & 2032
- Table 47: Rest of Europe APAC Insurtech Market Revenue (Million) Forecast, by Application 2019 & 2032
- Table 48: Rest of Europe APAC Insurtech Market Volume (Billion) Forecast, by Application 2019 & 2032
- Table 49: Global APAC Insurtech Market Revenue Million Forecast, by Insurance Line 2019 & 2032
- Table 50: Global APAC Insurtech Market Volume Billion Forecast, by Insurance Line 2019 & 2032
- Table 51: Global APAC Insurtech Market Revenue Million Forecast, by Country 2019 & 2032
- Table 52: Global APAC Insurtech Market Volume Billion Forecast, by Country 2019 & 2032
- Table 53: Turkey APAC Insurtech Market Revenue (Million) Forecast, by Application 2019 & 2032
- Table 54: Turkey APAC Insurtech Market Volume (Billion) Forecast, by Application 2019 & 2032
- Table 55: Israel APAC Insurtech Market Revenue (Million) Forecast, by Application 2019 & 2032
- Table 56: Israel APAC Insurtech Market Volume (Billion) Forecast, by Application 2019 & 2032
- Table 57: GCC APAC Insurtech Market Revenue (Million) Forecast, by Application 2019 & 2032
- Table 58: GCC APAC Insurtech Market Volume (Billion) Forecast, by Application 2019 & 2032
- Table 59: North Africa APAC Insurtech Market Revenue (Million) Forecast, by Application 2019 & 2032
- Table 60: North Africa APAC Insurtech Market Volume (Billion) Forecast, by Application 2019 & 2032
- Table 61: South Africa APAC Insurtech Market Revenue (Million) Forecast, by Application 2019 & 2032
- Table 62: South Africa APAC Insurtech Market Volume (Billion) Forecast, by Application 2019 & 2032
- Table 63: Rest of Middle East & Africa APAC Insurtech Market Revenue (Million) Forecast, by Application 2019 & 2032
- Table 64: Rest of Middle East & Africa APAC Insurtech Market Volume (Billion) Forecast, by Application 2019 & 2032
- Table 65: Global APAC Insurtech Market Revenue Million Forecast, by Insurance Line 2019 & 2032
- Table 66: Global APAC Insurtech Market Volume Billion Forecast, by Insurance Line 2019 & 2032
- Table 67: Global APAC Insurtech Market Revenue Million Forecast, by Country 2019 & 2032
- Table 68: Global APAC Insurtech Market Volume Billion Forecast, by Country 2019 & 2032
- Table 69: China APAC Insurtech Market Revenue (Million) Forecast, by Application 2019 & 2032
- Table 70: China APAC Insurtech Market Volume (Billion) Forecast, by Application 2019 & 2032
- Table 71: India APAC Insurtech Market Revenue (Million) Forecast, by Application 2019 & 2032
- Table 72: India APAC Insurtech Market Volume (Billion) Forecast, by Application 2019 & 2032
- Table 73: Japan APAC Insurtech Market Revenue (Million) Forecast, by Application 2019 & 2032
- Table 74: Japan APAC Insurtech Market Volume (Billion) Forecast, by Application 2019 & 2032
- Table 75: South Korea APAC Insurtech Market Revenue (Million) Forecast, by Application 2019 & 2032
- Table 76: South Korea APAC Insurtech Market Volume (Billion) Forecast, by Application 2019 & 2032
- Table 77: ASEAN APAC Insurtech Market Revenue (Million) Forecast, by Application 2019 & 2032
- Table 78: ASEAN APAC Insurtech Market Volume (Billion) Forecast, by Application 2019 & 2032
- Table 79: Oceania APAC Insurtech Market Revenue (Million) Forecast, by Application 2019 & 2032
- Table 80: Oceania APAC Insurtech Market Volume (Billion) Forecast, by Application 2019 & 2032
- Table 81: Rest of Asia Pacific APAC Insurtech Market Revenue (Million) Forecast, by Application 2019 & 2032
- Table 82: Rest of Asia Pacific APAC Insurtech Market Volume (Billion) Forecast, by Application 2019 & 2032
Frequently Asked Questions
1. What is the projected Compound Annual Growth Rate (CAGR) of the APAC Insurtech Market?
The projected CAGR is approximately 20.34%.
2. Which companies are prominent players in the APAC Insurtech Market?
Key companies in the market include ZhongAn Insurance, Singapore Life, CXA Group, Coverfox Insurance, PolicyPal, PolicyBazaar, Acko General Insurance Ltd, WaterDrop, Digit Insurance, CompareAsiaGroup, GoBear, SmartHR, Prenetics, PasarPolis**List Not Exhaustive.
3. What are the main segments of the APAC Insurtech Market?
The market segments include Insurance Line.
4. Can you provide details about the market size?
The market size is estimated to be USD 17.29 Million as of 2022.
5. What are some drivers contributing to market growth?
Increasing Adoption of Digital Technologies; Rise of Big Data and Advanced Analytics.
6. What are the notable trends driving market growth?
Rise in Non-life Insurance Fueling the APAC Insurtech Market.
7. Are there any restraints impacting market growth?
Increasing Adoption of Digital Technologies; Rise of Big Data and Advanced Analytics.
8. Can you provide examples of recent developments in the market?
May 2024: MyGate, a housing society management app, entered the insurance distribution business. It obtained an aggregator license from the Insurance Regulatory and Development Authority of India (IRDAI) to distribute insurance policies.March 2023: BlackRock and Citi formed a technological partnership with insurer Singlife. Clients will have access to full portfolio management capabilities through integration with BlackRock Aladdin and Citi, which will increase productivity, automate controls, and facilitate a smooth front-to-back experience.
9. What pricing options are available for accessing the report?
Pricing options include single-user, multi-user, and enterprise licenses priced at USD 4750, USD 4950, and USD 6800 respectively.
10. Is the market size provided in terms of value or volume?
The market size is provided in terms of value, measured in Million and volume, measured in Billion.
11. Are there any specific market keywords associated with the report?
Yes, the market keyword associated with the report is "APAC Insurtech Market," which aids in identifying and referencing the specific market segment covered.
12. How do I determine which pricing option suits my needs best?
The pricing options vary based on user requirements and access needs. Individual users may opt for single-user licenses, while businesses requiring broader access may choose multi-user or enterprise licenses for cost-effective access to the report.
13. Are there any additional resources or data provided in the APAC Insurtech Market report?
While the report offers comprehensive insights, it's advisable to review the specific contents or supplementary materials provided to ascertain if additional resources or data are available.
14. How can I stay updated on further developments or reports in the APAC Insurtech Market?
To stay informed about further developments, trends, and reports in the APAC Insurtech Market, consider subscribing to industry newsletters, following relevant companies and organizations, or regularly checking reputable industry news sources and publications.
Methodology
Step 1 - Identification of Relevant Samples Size from Population Database


Step 2 - Approaches for Defining Global Market Size (Value, Volume* & Price*)

Note*: In applicable scenarios
Step 3 - Data Sources
Primary Research
- Web Analytics
- Survey Reports
- Research Institute
- Latest Research Reports
- Opinion Leaders
Secondary Research
- Annual Reports
- White Paper
- Latest Press Release
- Industry Association
- Paid Database
- Investor Presentations

Step 4 - Data Triangulation
Involves using different sources of information in order to increase the validity of a study
These sources are likely to be stakeholders in a program - participants, other researchers, program staff, other community members, and so on.
Then we put all data in single framework & apply various statistical tools to find out the dynamic on the market.
During the analysis stage, feedback from the stakeholder groups would be compared to determine areas of agreement as well as areas of divergence


