
Key Insights
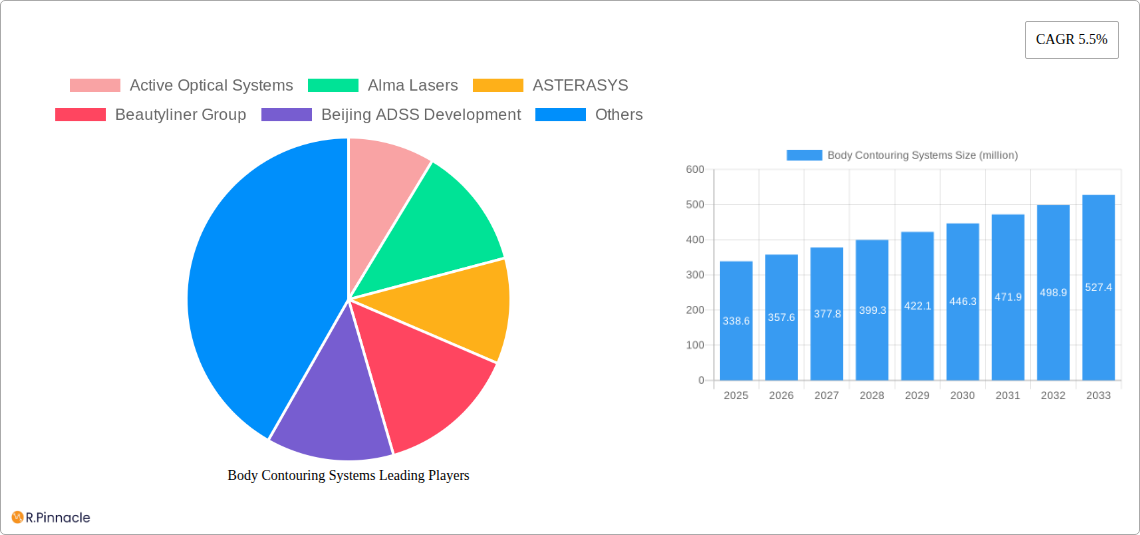
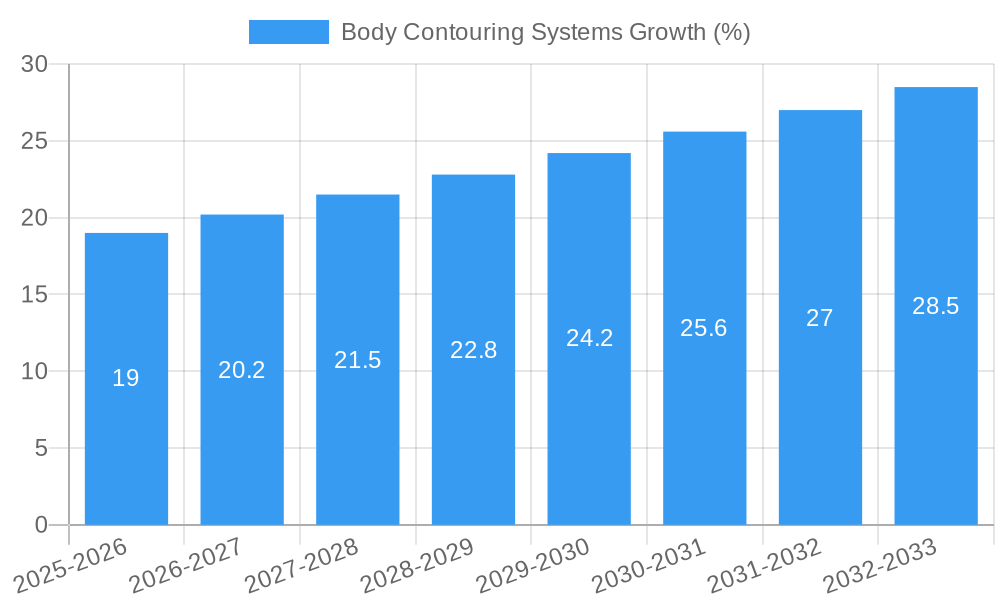
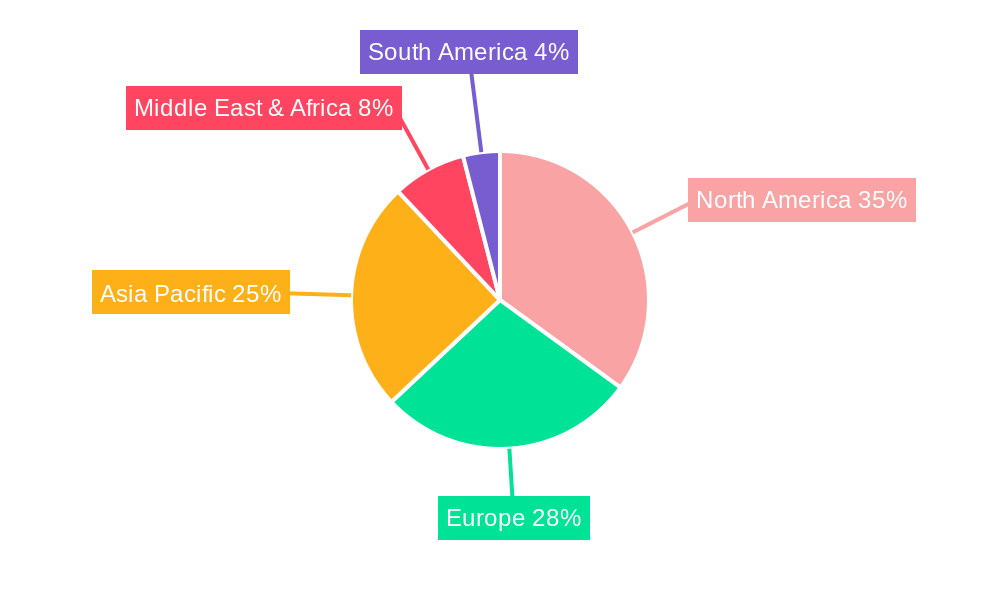
The global body contouring systems market, valued at $338.6 million in 2025, is projected to experience robust growth, driven by rising demand for non-invasive cosmetic procedures and technological advancements in energy-based devices. The market's Compound Annual Growth Rate (CAGR) of 5.5% from 2019 to 2024 suggests a continuously expanding market, fueled by increased consumer awareness of body contouring options and their efficacy in addressing concerns about body image and appearance. Key drivers include the growing prevalence of obesity and related conditions, an aging population seeking aesthetic improvements, and the increasing affordability of these procedures. The market segmentation, encompassing various applications (hospitals, clinics, beauty salons) and system types (mobile, stationary), allows for diverse market penetration strategies, catering to a broad spectrum of customers and healthcare providers. Technological innovations focusing on improved safety, efficacy, and minimally invasive techniques further propel market expansion. While geographical distribution shows significant presence across regions such as North America and Europe, emerging economies in Asia-Pacific are exhibiting high growth potential due to increasing disposable incomes and rising adoption of aesthetic treatments.
The sustained growth is expected to continue through 2033, with a projected expansion into new application areas and a growing preference for non-surgical options. Competition among established players like Alma Lasers, Cynosure, and others, alongside the emergence of new entrants, creates a dynamic market landscape. However, potential restraints might include stringent regulatory approvals, high equipment costs, and potential side effects associated with certain procedures. The market's future trajectory hinges on continuous technological innovation, expanding accessibility through wider distribution channels, and effective addressing of consumer safety concerns. The increasing emphasis on personalized treatment plans and patient education will be crucial for further penetration and market expansion within the predicted forecast period.
Body Contouring Systems Market Report: A Comprehensive Analysis (2019-2033)
This comprehensive report provides an in-depth analysis of the global Body Contouring Systems market, offering invaluable insights for industry professionals, investors, and strategic decision-makers. With a detailed study period spanning from 2019 to 2033, including a base year of 2025 and a forecast period from 2025 to 2033, this report unveils the market's structure, dynamics, dominant segments, and future outlook. The report leverages extensive data and analysis to illuminate key trends, challenges, and opportunities within the $xx million market.
Body Contouring Systems Market Structure & Innovation Trends
The global body contouring systems market exhibits a moderately concentrated structure, with key players like Active Optical Systems, Alma Lasers, and Cynosure holding significant market share. However, the market also features several smaller, specialized companies contributing to innovation and competition. The estimated market share for these top three players combined is approximately xx%. M&A activity has been moderate, with deals valued at approximately $xx million in the historical period (2019-2024), primarily focused on expanding product portfolios and geographical reach. Innovation is driven by advancements in energy-based technologies (e.g., radiofrequency, ultrasound), minimally invasive procedures, and software-driven treatment personalization. Regulatory frameworks vary across regions, impacting market access and adoption. Product substitutes, such as surgical procedures and non-invasive alternatives, exert competitive pressure. The end-user demographic is expanding to include a wider age range and diverse aesthetic preferences.
- Market Concentration: Moderately concentrated, with top 3 players holding xx% market share.
- M&A Activity (2019-2024): Approximately $xx million in deal value.
- Innovation Drivers: Advancements in energy-based technologies, minimally invasive procedures, software integration.
- Regulatory Landscape: Varying across regions, impacting market access.
Body Contouring Systems Market Dynamics & Trends
The global body contouring systems market is experiencing robust growth, with a projected CAGR of xx% during the forecast period (2025-2033). This growth is fueled by several key factors. Rising consumer demand for non-invasive cosmetic procedures, driven by increasing disposable incomes and awareness of aesthetic treatments, is a primary driver. Technological advancements, leading to more effective, safer, and comfortable treatments, are further boosting market adoption. The market is witnessing a shift towards personalized treatment plans, leveraging data analytics and AI-powered solutions. Competitive dynamics are characterized by both established players expanding their product portfolios and new entrants introducing innovative solutions. Market penetration in emerging economies is also expected to increase significantly during the forecast period. The market size is expected to reach $xx million by 2033.
Dominant Regions & Segments in Body Contouring Systems
North America currently holds the largest market share in the body contouring systems market, driven by high disposable incomes, advanced healthcare infrastructure, and early adoption of new technologies. Within applications, the clinic segment is dominant, due to its accessibility and focus on non-surgical treatments. The stationary type of body contouring systems currently holds a larger market share than mobile systems, although the mobile segment is experiencing rapid growth driven by its convenience and portability.
- Key Drivers in North America: High disposable incomes, advanced healthcare infrastructure, early adoption of new technologies.
- Clinic Segment Dominance: Accessibility and focus on non-surgical procedures.
- Stationary Systems Market Share: Larger market share currently, but mobile systems are showing strong growth.
Body Contouring Systems Product Innovations
Recent product innovations focus on enhancing treatment efficacy, reducing downtime, and improving patient comfort. New systems incorporate advanced technologies like multi-polar radiofrequency, focused ultrasound, and cryolipolysis, offering targeted and personalized treatments. The trend is towards integrating advanced software for precise treatment parameters and real-time monitoring. These innovations are improving the market fit by addressing consumer demands for effective and safe body contouring solutions.
Report Scope & Segmentation Analysis
This report segments the body contouring systems market by application (Hospital, Clinic, Beauty Salon) and type (Mobile, Stationary). Each segment's growth projections, market size, and competitive dynamics are analyzed in detail. The clinic segment is expected to maintain its dominance due to accessibility and non-invasive treatment focus. The stationary segment currently dominates but will face increasing competition from the expanding mobile segment.
- By Application: Hospital, Clinic, Beauty Salon (with individual growth projections and market sizes).
- By Type: Mobile, Stationary (with individual growth projections and market sizes).
Key Drivers of Body Contouring Systems Growth
Several key factors are driving the growth of the body contouring systems market. These include: the rising prevalence of obesity and related body image concerns, increasing disposable incomes and willingness to spend on aesthetic treatments, advancements in technology leading to safer and more effective procedures, and favorable regulatory environments in many regions promoting market expansion.
Challenges in the Body Contouring Systems Sector
The body contouring systems sector faces several challenges, including stringent regulatory approvals, high initial investment costs for clinics and hospitals, the need for skilled professionals to operate equipment, and intense competition among existing and new market entrants. These factors can hinder market expansion and profitability for certain players.
Emerging Opportunities in Body Contouring Systems
Emerging opportunities lie in expanding into untapped markets, particularly in developing economies with growing middle classes. The development of non-invasive and personalized treatments, leveraging AI and data analytics, also presents significant opportunities. Furthermore, integrating body contouring systems with other aesthetic procedures can create lucrative opportunities for businesses.
Leading Players in the Body Contouring Systems Market
- Active Optical Systems
- Alma Lasers
- ASTERASYS
- Beautyliner Group
- Beijing ADSS Development
- Chungwoo Medical
- CLASSYS
- Cocoon Medical
- Cynosure
- General Project
- Globus Corporation
- Grand Aespio
- I-Tech Industries
- Ibramed
- Iskra Medical
- ITC - International Technology Corporation
- ITS Group
- JEISYS Medical
Key Developments in Body Contouring Systems Industry
- 2022-Q4: Cynosure launched a new radiofrequency device with enhanced features.
- 2023-Q1: Alma Lasers acquired a smaller competitor, expanding its product portfolio.
- 2023-Q3: Several companies announced strategic partnerships to expand distribution networks. (Further details of specific developments would be included in the full report).
Future Outlook for Body Contouring Systems Market
The body contouring systems market is poised for continued growth, driven by technological innovation, expanding consumer demand, and market penetration in emerging economies. Strategic partnerships, product diversification, and a focus on personalized treatments will be key success factors for companies in this dynamic market. The market is expected to reach $xx million by 2033.
Body Contouring Systems Segmentation
-
1. Application
- 1.1. Hospital
- 1.2. Clinic
- 1.3. Beauty Salon
-
2. Types
- 2.1. Mobile
- 2.2. Stationary
Body Contouring Systems Segmentation By Geography
-
1. North America
- 1.1. United States
- 1.2. Canada
- 1.3. Mexico
-
2. South America
- 2.1. Brazil
- 2.2. Argentina
- 2.3. Rest of South America
-
3. Europe
- 3.1. United Kingdom
- 3.2. Germany
- 3.3. France
- 3.4. Italy
- 3.5. Spain
- 3.6. Russia
- 3.7. Benelux
- 3.8. Nordics
- 3.9. Rest of Europe
-
4. Middle East & Africa
- 4.1. Turkey
- 4.2. Israel
- 4.3. GCC
- 4.4. North Africa
- 4.5. South Africa
- 4.6. Rest of Middle East & Africa
-
5. Asia Pacific
- 5.1. China
- 5.2. India
- 5.3. Japan
- 5.4. South Korea
- 5.5. ASEAN
- 5.6. Oceania
- 5.7. Rest of Asia Pacific
Body Contouring Systems REPORT HIGHLIGHTS
| Aspects | Details |
|---|---|
| Study Period | 2019-2033 |
| Base Year | 2024 |
| Estimated Year | 2025 |
| Forecast Period | 2025-2033 |
| Historical Period | 2019-2024 |
| Growth Rate | CAGR of 5.5% from 2019-2033 |
| Segmentation |
|
Table of Contents
- 1. Introduction
- 1.1. Research Scope
- 1.2. Market Segmentation
- 1.3. Research Methodology
- 1.4. Definitions and Assumptions
- 2. Executive Summary
- 2.1. Introduction
- 3. Market Dynamics
- 3.1. Introduction
- 3.2. Market Drivers
- 3.3. Market Restrains
- 3.4. Market Trends
- 4. Market Factor Analysis
- 4.1. Porters Five Forces
- 4.2. Supply/Value Chain
- 4.3. PESTEL analysis
- 4.4. Market Entropy
- 4.5. Patent/Trademark Analysis
- 5. Global Body Contouring Systems Analysis, Insights and Forecast, 2019-2031
- 5.1. Market Analysis, Insights and Forecast - by Application
- 5.1.1. Hospital
- 5.1.2. Clinic
- 5.1.3. Beauty Salon
- 5.2. Market Analysis, Insights and Forecast - by Types
- 5.2.1. Mobile
- 5.2.2. Stationary
- 5.3. Market Analysis, Insights and Forecast - by Region
- 5.3.1. North America
- 5.3.2. South America
- 5.3.3. Europe
- 5.3.4. Middle East & Africa
- 5.3.5. Asia Pacific
- 5.1. Market Analysis, Insights and Forecast - by Application
- 6. North America Body Contouring Systems Analysis, Insights and Forecast, 2019-2031
- 6.1. Market Analysis, Insights and Forecast - by Application
- 6.1.1. Hospital
- 6.1.2. Clinic
- 6.1.3. Beauty Salon
- 6.2. Market Analysis, Insights and Forecast - by Types
- 6.2.1. Mobile
- 6.2.2. Stationary
- 6.1. Market Analysis, Insights and Forecast - by Application
- 7. South America Body Contouring Systems Analysis, Insights and Forecast, 2019-2031
- 7.1. Market Analysis, Insights and Forecast - by Application
- 7.1.1. Hospital
- 7.1.2. Clinic
- 7.1.3. Beauty Salon
- 7.2. Market Analysis, Insights and Forecast - by Types
- 7.2.1. Mobile
- 7.2.2. Stationary
- 7.1. Market Analysis, Insights and Forecast - by Application
- 8. Europe Body Contouring Systems Analysis, Insights and Forecast, 2019-2031
- 8.1. Market Analysis, Insights and Forecast - by Application
- 8.1.1. Hospital
- 8.1.2. Clinic
- 8.1.3. Beauty Salon
- 8.2. Market Analysis, Insights and Forecast - by Types
- 8.2.1. Mobile
- 8.2.2. Stationary
- 8.1. Market Analysis, Insights and Forecast - by Application
- 9. Middle East & Africa Body Contouring Systems Analysis, Insights and Forecast, 2019-2031
- 9.1. Market Analysis, Insights and Forecast - by Application
- 9.1.1. Hospital
- 9.1.2. Clinic
- 9.1.3. Beauty Salon
- 9.2. Market Analysis, Insights and Forecast - by Types
- 9.2.1. Mobile
- 9.2.2. Stationary
- 9.1. Market Analysis, Insights and Forecast - by Application
- 10. Asia Pacific Body Contouring Systems Analysis, Insights and Forecast, 2019-2031
- 10.1. Market Analysis, Insights and Forecast - by Application
- 10.1.1. Hospital
- 10.1.2. Clinic
- 10.1.3. Beauty Salon
- 10.2. Market Analysis, Insights and Forecast - by Types
- 10.2.1. Mobile
- 10.2.2. Stationary
- 10.1. Market Analysis, Insights and Forecast - by Application
- 11. Competitive Analysis
- 11.1. Global Market Share Analysis 2024
- 11.2. Company Profiles
- 11.2.1 Active Optical Systems
- 11.2.1.1. Overview
- 11.2.1.2. Products
- 11.2.1.3. SWOT Analysis
- 11.2.1.4. Recent Developments
- 11.2.1.5. Financials (Based on Availability)
- 11.2.2 Alma Lasers
- 11.2.2.1. Overview
- 11.2.2.2. Products
- 11.2.2.3. SWOT Analysis
- 11.2.2.4. Recent Developments
- 11.2.2.5. Financials (Based on Availability)
- 11.2.3 ASTERASYS
- 11.2.3.1. Overview
- 11.2.3.2. Products
- 11.2.3.3. SWOT Analysis
- 11.2.3.4. Recent Developments
- 11.2.3.5. Financials (Based on Availability)
- 11.2.4 Beautyliner Group
- 11.2.4.1. Overview
- 11.2.4.2. Products
- 11.2.4.3. SWOT Analysis
- 11.2.4.4. Recent Developments
- 11.2.4.5. Financials (Based on Availability)
- 11.2.5 Beijing ADSS Development
- 11.2.5.1. Overview
- 11.2.5.2. Products
- 11.2.5.3. SWOT Analysis
- 11.2.5.4. Recent Developments
- 11.2.5.5. Financials (Based on Availability)
- 11.2.6 Chungwoo Medical
- 11.2.6.1. Overview
- 11.2.6.2. Products
- 11.2.6.3. SWOT Analysis
- 11.2.6.4. Recent Developments
- 11.2.6.5. Financials (Based on Availability)
- 11.2.7 CLASSYS
- 11.2.7.1. Overview
- 11.2.7.2. Products
- 11.2.7.3. SWOT Analysis
- 11.2.7.4. Recent Developments
- 11.2.7.5. Financials (Based on Availability)
- 11.2.8 Cocoon Medical
- 11.2.8.1. Overview
- 11.2.8.2. Products
- 11.2.8.3. SWOT Analysis
- 11.2.8.4. Recent Developments
- 11.2.8.5. Financials (Based on Availability)
- 11.2.9 Cynosure
- 11.2.9.1. Overview
- 11.2.9.2. Products
- 11.2.9.3. SWOT Analysis
- 11.2.9.4. Recent Developments
- 11.2.9.5. Financials (Based on Availability)
- 11.2.10 General Project
- 11.2.10.1. Overview
- 11.2.10.2. Products
- 11.2.10.3. SWOT Analysis
- 11.2.10.4. Recent Developments
- 11.2.10.5. Financials (Based on Availability)
- 11.2.11 Globus Corporation
- 11.2.11.1. Overview
- 11.2.11.2. Products
- 11.2.11.3. SWOT Analysis
- 11.2.11.4. Recent Developments
- 11.2.11.5. Financials (Based on Availability)
- 11.2.12 Grand Aespio
- 11.2.12.1. Overview
- 11.2.12.2. Products
- 11.2.12.3. SWOT Analysis
- 11.2.12.4. Recent Developments
- 11.2.12.5. Financials (Based on Availability)
- 11.2.13 I-Tech Industries
- 11.2.13.1. Overview
- 11.2.13.2. Products
- 11.2.13.3. SWOT Analysis
- 11.2.13.4. Recent Developments
- 11.2.13.5. Financials (Based on Availability)
- 11.2.14 Ibramed
- 11.2.14.1. Overview
- 11.2.14.2. Products
- 11.2.14.3. SWOT Analysis
- 11.2.14.4. Recent Developments
- 11.2.14.5. Financials (Based on Availability)
- 11.2.15 Iskra Medical
- 11.2.15.1. Overview
- 11.2.15.2. Products
- 11.2.15.3. SWOT Analysis
- 11.2.15.4. Recent Developments
- 11.2.15.5. Financials (Based on Availability)
- 11.2.16 ITC - International Technology Corporation
- 11.2.16.1. Overview
- 11.2.16.2. Products
- 11.2.16.3. SWOT Analysis
- 11.2.16.4. Recent Developments
- 11.2.16.5. Financials (Based on Availability)
- 11.2.17 ITS Group
- 11.2.17.1. Overview
- 11.2.17.2. Products
- 11.2.17.3. SWOT Analysis
- 11.2.17.4. Recent Developments
- 11.2.17.5. Financials (Based on Availability)
- 11.2.18 JEISYS Medical
- 11.2.18.1. Overview
- 11.2.18.2. Products
- 11.2.18.3. SWOT Analysis
- 11.2.18.4. Recent Developments
- 11.2.18.5. Financials (Based on Availability)
- 11.2.1 Active Optical Systems
List of Figures
- Figure 1: Global Body Contouring Systems Revenue Breakdown (million, %) by Region 2024 & 2032
- Figure 2: Global Body Contouring Systems Volume Breakdown (K, %) by Region 2024 & 2032
- Figure 3: North America Body Contouring Systems Revenue (million), by Application 2024 & 2032
- Figure 4: North America Body Contouring Systems Volume (K), by Application 2024 & 2032
- Figure 5: North America Body Contouring Systems Revenue Share (%), by Application 2024 & 2032
- Figure 6: North America Body Contouring Systems Volume Share (%), by Application 2024 & 2032
- Figure 7: North America Body Contouring Systems Revenue (million), by Types 2024 & 2032
- Figure 8: North America Body Contouring Systems Volume (K), by Types 2024 & 2032
- Figure 9: North America Body Contouring Systems Revenue Share (%), by Types 2024 & 2032
- Figure 10: North America Body Contouring Systems Volume Share (%), by Types 2024 & 2032
- Figure 11: North America Body Contouring Systems Revenue (million), by Country 2024 & 2032
- Figure 12: North America Body Contouring Systems Volume (K), by Country 2024 & 2032
- Figure 13: North America Body Contouring Systems Revenue Share (%), by Country 2024 & 2032
- Figure 14: North America Body Contouring Systems Volume Share (%), by Country 2024 & 2032
- Figure 15: South America Body Contouring Systems Revenue (million), by Application 2024 & 2032
- Figure 16: South America Body Contouring Systems Volume (K), by Application 2024 & 2032
- Figure 17: South America Body Contouring Systems Revenue Share (%), by Application 2024 & 2032
- Figure 18: South America Body Contouring Systems Volume Share (%), by Application 2024 & 2032
- Figure 19: South America Body Contouring Systems Revenue (million), by Types 2024 & 2032
- Figure 20: South America Body Contouring Systems Volume (K), by Types 2024 & 2032
- Figure 21: South America Body Contouring Systems Revenue Share (%), by Types 2024 & 2032
- Figure 22: South America Body Contouring Systems Volume Share (%), by Types 2024 & 2032
- Figure 23: South America Body Contouring Systems Revenue (million), by Country 2024 & 2032
- Figure 24: South America Body Contouring Systems Volume (K), by Country 2024 & 2032
- Figure 25: South America Body Contouring Systems Revenue Share (%), by Country 2024 & 2032
- Figure 26: South America Body Contouring Systems Volume Share (%), by Country 2024 & 2032
- Figure 27: Europe Body Contouring Systems Revenue (million), by Application 2024 & 2032
- Figure 28: Europe Body Contouring Systems Volume (K), by Application 2024 & 2032
- Figure 29: Europe Body Contouring Systems Revenue Share (%), by Application 2024 & 2032
- Figure 30: Europe Body Contouring Systems Volume Share (%), by Application 2024 & 2032
- Figure 31: Europe Body Contouring Systems Revenue (million), by Types 2024 & 2032
- Figure 32: Europe Body Contouring Systems Volume (K), by Types 2024 & 2032
- Figure 33: Europe Body Contouring Systems Revenue Share (%), by Types 2024 & 2032
- Figure 34: Europe Body Contouring Systems Volume Share (%), by Types 2024 & 2032
- Figure 35: Europe Body Contouring Systems Revenue (million), by Country 2024 & 2032
- Figure 36: Europe Body Contouring Systems Volume (K), by Country 2024 & 2032
- Figure 37: Europe Body Contouring Systems Revenue Share (%), by Country 2024 & 2032
- Figure 38: Europe Body Contouring Systems Volume Share (%), by Country 2024 & 2032
- Figure 39: Middle East & Africa Body Contouring Systems Revenue (million), by Application 2024 & 2032
- Figure 40: Middle East & Africa Body Contouring Systems Volume (K), by Application 2024 & 2032
- Figure 41: Middle East & Africa Body Contouring Systems Revenue Share (%), by Application 2024 & 2032
- Figure 42: Middle East & Africa Body Contouring Systems Volume Share (%), by Application 2024 & 2032
- Figure 43: Middle East & Africa Body Contouring Systems Revenue (million), by Types 2024 & 2032
- Figure 44: Middle East & Africa Body Contouring Systems Volume (K), by Types 2024 & 2032
- Figure 45: Middle East & Africa Body Contouring Systems Revenue Share (%), by Types 2024 & 2032
- Figure 46: Middle East & Africa Body Contouring Systems Volume Share (%), by Types 2024 & 2032
- Figure 47: Middle East & Africa Body Contouring Systems Revenue (million), by Country 2024 & 2032
- Figure 48: Middle East & Africa Body Contouring Systems Volume (K), by Country 2024 & 2032
- Figure 49: Middle East & Africa Body Contouring Systems Revenue Share (%), by Country 2024 & 2032
- Figure 50: Middle East & Africa Body Contouring Systems Volume Share (%), by Country 2024 & 2032
- Figure 51: Asia Pacific Body Contouring Systems Revenue (million), by Application 2024 & 2032
- Figure 52: Asia Pacific Body Contouring Systems Volume (K), by Application 2024 & 2032
- Figure 53: Asia Pacific Body Contouring Systems Revenue Share (%), by Application 2024 & 2032
- Figure 54: Asia Pacific Body Contouring Systems Volume Share (%), by Application 2024 & 2032
- Figure 55: Asia Pacific Body Contouring Systems Revenue (million), by Types 2024 & 2032
- Figure 56: Asia Pacific Body Contouring Systems Volume (K), by Types 2024 & 2032
- Figure 57: Asia Pacific Body Contouring Systems Revenue Share (%), by Types 2024 & 2032
- Figure 58: Asia Pacific Body Contouring Systems Volume Share (%), by Types 2024 & 2032
- Figure 59: Asia Pacific Body Contouring Systems Revenue (million), by Country 2024 & 2032
- Figure 60: Asia Pacific Body Contouring Systems Volume (K), by Country 2024 & 2032
- Figure 61: Asia Pacific Body Contouring Systems Revenue Share (%), by Country 2024 & 2032
- Figure 62: Asia Pacific Body Contouring Systems Volume Share (%), by Country 2024 & 2032
List of Tables
- Table 1: Global Body Contouring Systems Revenue million Forecast, by Region 2019 & 2032
- Table 2: Global Body Contouring Systems Volume K Forecast, by Region 2019 & 2032
- Table 3: Global Body Contouring Systems Revenue million Forecast, by Application 2019 & 2032
- Table 4: Global Body Contouring Systems Volume K Forecast, by Application 2019 & 2032
- Table 5: Global Body Contouring Systems Revenue million Forecast, by Types 2019 & 2032
- Table 6: Global Body Contouring Systems Volume K Forecast, by Types 2019 & 2032
- Table 7: Global Body Contouring Systems Revenue million Forecast, by Region 2019 & 2032
- Table 8: Global Body Contouring Systems Volume K Forecast, by Region 2019 & 2032
- Table 9: Global Body Contouring Systems Revenue million Forecast, by Application 2019 & 2032
- Table 10: Global Body Contouring Systems Volume K Forecast, by Application 2019 & 2032
- Table 11: Global Body Contouring Systems Revenue million Forecast, by Types 2019 & 2032
- Table 12: Global Body Contouring Systems Volume K Forecast, by Types 2019 & 2032
- Table 13: Global Body Contouring Systems Revenue million Forecast, by Country 2019 & 2032
- Table 14: Global Body Contouring Systems Volume K Forecast, by Country 2019 & 2032
- Table 15: United States Body Contouring Systems Revenue (million) Forecast, by Application 2019 & 2032
- Table 16: United States Body Contouring Systems Volume (K) Forecast, by Application 2019 & 2032
- Table 17: Canada Body Contouring Systems Revenue (million) Forecast, by Application 2019 & 2032
- Table 18: Canada Body Contouring Systems Volume (K) Forecast, by Application 2019 & 2032
- Table 19: Mexico Body Contouring Systems Revenue (million) Forecast, by Application 2019 & 2032
- Table 20: Mexico Body Contouring Systems Volume (K) Forecast, by Application 2019 & 2032
- Table 21: Global Body Contouring Systems Revenue million Forecast, by Application 2019 & 2032
- Table 22: Global Body Contouring Systems Volume K Forecast, by Application 2019 & 2032
- Table 23: Global Body Contouring Systems Revenue million Forecast, by Types 2019 & 2032
- Table 24: Global Body Contouring Systems Volume K Forecast, by Types 2019 & 2032
- Table 25: Global Body Contouring Systems Revenue million Forecast, by Country 2019 & 2032
- Table 26: Global Body Contouring Systems Volume K Forecast, by Country 2019 & 2032
- Table 27: Brazil Body Contouring Systems Revenue (million) Forecast, by Application 2019 & 2032
- Table 28: Brazil Body Contouring Systems Volume (K) Forecast, by Application 2019 & 2032
- Table 29: Argentina Body Contouring Systems Revenue (million) Forecast, by Application 2019 & 2032
- Table 30: Argentina Body Contouring Systems Volume (K) Forecast, by Application 2019 & 2032
- Table 31: Rest of South America Body Contouring Systems Revenue (million) Forecast, by Application 2019 & 2032
- Table 32: Rest of South America Body Contouring Systems Volume (K) Forecast, by Application 2019 & 2032
- Table 33: Global Body Contouring Systems Revenue million Forecast, by Application 2019 & 2032
- Table 34: Global Body Contouring Systems Volume K Forecast, by Application 2019 & 2032
- Table 35: Global Body Contouring Systems Revenue million Forecast, by Types 2019 & 2032
- Table 36: Global Body Contouring Systems Volume K Forecast, by Types 2019 & 2032
- Table 37: Global Body Contouring Systems Revenue million Forecast, by Country 2019 & 2032
- Table 38: Global Body Contouring Systems Volume K Forecast, by Country 2019 & 2032
- Table 39: United Kingdom Body Contouring Systems Revenue (million) Forecast, by Application 2019 & 2032
- Table 40: United Kingdom Body Contouring Systems Volume (K) Forecast, by Application 2019 & 2032
- Table 41: Germany Body Contouring Systems Revenue (million) Forecast, by Application 2019 & 2032
- Table 42: Germany Body Contouring Systems Volume (K) Forecast, by Application 2019 & 2032
- Table 43: France Body Contouring Systems Revenue (million) Forecast, by Application 2019 & 2032
- Table 44: France Body Contouring Systems Volume (K) Forecast, by Application 2019 & 2032
- Table 45: Italy Body Contouring Systems Revenue (million) Forecast, by Application 2019 & 2032
- Table 46: Italy Body Contouring Systems Volume (K) Forecast, by Application 2019 & 2032
- Table 47: Spain Body Contouring Systems Revenue (million) Forecast, by Application 2019 & 2032
- Table 48: Spain Body Contouring Systems Volume (K) Forecast, by Application 2019 & 2032
- Table 49: Russia Body Contouring Systems Revenue (million) Forecast, by Application 2019 & 2032
- Table 50: Russia Body Contouring Systems Volume (K) Forecast, by Application 2019 & 2032
- Table 51: Benelux Body Contouring Systems Revenue (million) Forecast, by Application 2019 & 2032
- Table 52: Benelux Body Contouring Systems Volume (K) Forecast, by Application 2019 & 2032
- Table 53: Nordics Body Contouring Systems Revenue (million) Forecast, by Application 2019 & 2032
- Table 54: Nordics Body Contouring Systems Volume (K) Forecast, by Application 2019 & 2032
- Table 55: Rest of Europe Body Contouring Systems Revenue (million) Forecast, by Application 2019 & 2032
- Table 56: Rest of Europe Body Contouring Systems Volume (K) Forecast, by Application 2019 & 2032
- Table 57: Global Body Contouring Systems Revenue million Forecast, by Application 2019 & 2032
- Table 58: Global Body Contouring Systems Volume K Forecast, by Application 2019 & 2032
- Table 59: Global Body Contouring Systems Revenue million Forecast, by Types 2019 & 2032
- Table 60: Global Body Contouring Systems Volume K Forecast, by Types 2019 & 2032
- Table 61: Global Body Contouring Systems Revenue million Forecast, by Country 2019 & 2032
- Table 62: Global Body Contouring Systems Volume K Forecast, by Country 2019 & 2032
- Table 63: Turkey Body Contouring Systems Revenue (million) Forecast, by Application 2019 & 2032
- Table 64: Turkey Body Contouring Systems Volume (K) Forecast, by Application 2019 & 2032
- Table 65: Israel Body Contouring Systems Revenue (million) Forecast, by Application 2019 & 2032
- Table 66: Israel Body Contouring Systems Volume (K) Forecast, by Application 2019 & 2032
- Table 67: GCC Body Contouring Systems Revenue (million) Forecast, by Application 2019 & 2032
- Table 68: GCC Body Contouring Systems Volume (K) Forecast, by Application 2019 & 2032
- Table 69: North Africa Body Contouring Systems Revenue (million) Forecast, by Application 2019 & 2032
- Table 70: North Africa Body Contouring Systems Volume (K) Forecast, by Application 2019 & 2032
- Table 71: South Africa Body Contouring Systems Revenue (million) Forecast, by Application 2019 & 2032
- Table 72: South Africa Body Contouring Systems Volume (K) Forecast, by Application 2019 & 2032
- Table 73: Rest of Middle East & Africa Body Contouring Systems Revenue (million) Forecast, by Application 2019 & 2032
- Table 74: Rest of Middle East & Africa Body Contouring Systems Volume (K) Forecast, by Application 2019 & 2032
- Table 75: Global Body Contouring Systems Revenue million Forecast, by Application 2019 & 2032
- Table 76: Global Body Contouring Systems Volume K Forecast, by Application 2019 & 2032
- Table 77: Global Body Contouring Systems Revenue million Forecast, by Types 2019 & 2032
- Table 78: Global Body Contouring Systems Volume K Forecast, by Types 2019 & 2032
- Table 79: Global Body Contouring Systems Revenue million Forecast, by Country 2019 & 2032
- Table 80: Global Body Contouring Systems Volume K Forecast, by Country 2019 & 2032
- Table 81: China Body Contouring Systems Revenue (million) Forecast, by Application 2019 & 2032
- Table 82: China Body Contouring Systems Volume (K) Forecast, by Application 2019 & 2032
- Table 83: India Body Contouring Systems Revenue (million) Forecast, by Application 2019 & 2032
- Table 84: India Body Contouring Systems Volume (K) Forecast, by Application 2019 & 2032
- Table 85: Japan Body Contouring Systems Revenue (million) Forecast, by Application 2019 & 2032
- Table 86: Japan Body Contouring Systems Volume (K) Forecast, by Application 2019 & 2032
- Table 87: South Korea Body Contouring Systems Revenue (million) Forecast, by Application 2019 & 2032
- Table 88: South Korea Body Contouring Systems Volume (K) Forecast, by Application 2019 & 2032
- Table 89: ASEAN Body Contouring Systems Revenue (million) Forecast, by Application 2019 & 2032
- Table 90: ASEAN Body Contouring Systems Volume (K) Forecast, by Application 2019 & 2032
- Table 91: Oceania Body Contouring Systems Revenue (million) Forecast, by Application 2019 & 2032
- Table 92: Oceania Body Contouring Systems Volume (K) Forecast, by Application 2019 & 2032
- Table 93: Rest of Asia Pacific Body Contouring Systems Revenue (million) Forecast, by Application 2019 & 2032
- Table 94: Rest of Asia Pacific Body Contouring Systems Volume (K) Forecast, by Application 2019 & 2032
Frequently Asked Questions
1. What is the projected Compound Annual Growth Rate (CAGR) of the Body Contouring Systems?
The projected CAGR is approximately 5.5%.
2. Which companies are prominent players in the Body Contouring Systems?
Key companies in the market include Active Optical Systems, Alma Lasers, ASTERASYS, Beautyliner Group, Beijing ADSS Development, Chungwoo Medical, CLASSYS, Cocoon Medical, Cynosure, General Project, Globus Corporation, Grand Aespio, I-Tech Industries, Ibramed, Iskra Medical, ITC - International Technology Corporation, ITS Group, JEISYS Medical.
3. What are the main segments of the Body Contouring Systems?
The market segments include Application, Types.
4. Can you provide details about the market size?
The market size is estimated to be USD 338.6 million as of 2022.
5. What are some drivers contributing to market growth?
N/A
6. What are the notable trends driving market growth?
N/A
7. Are there any restraints impacting market growth?
N/A
8. Can you provide examples of recent developments in the market?
N/A
9. What pricing options are available for accessing the report?
Pricing options include single-user, multi-user, and enterprise licenses priced at USD 3350.00, USD 5025.00, and USD 6700.00 respectively.
10. Is the market size provided in terms of value or volume?
The market size is provided in terms of value, measured in million and volume, measured in K.
11. Are there any specific market keywords associated with the report?
Yes, the market keyword associated with the report is "Body Contouring Systems," which aids in identifying and referencing the specific market segment covered.
12. How do I determine which pricing option suits my needs best?
The pricing options vary based on user requirements and access needs. Individual users may opt for single-user licenses, while businesses requiring broader access may choose multi-user or enterprise licenses for cost-effective access to the report.
13. Are there any additional resources or data provided in the Body Contouring Systems report?
While the report offers comprehensive insights, it's advisable to review the specific contents or supplementary materials provided to ascertain if additional resources or data are available.
14. How can I stay updated on further developments or reports in the Body Contouring Systems?
To stay informed about further developments, trends, and reports in the Body Contouring Systems, consider subscribing to industry newsletters, following relevant companies and organizations, or regularly checking reputable industry news sources and publications.
Methodology
Step 1 - Identification of Relevant Samples Size from Population Database


Step 2 - Approaches for Defining Global Market Size (Value, Volume* & Price*)

Note*: In applicable scenarios
Step 3 - Data Sources
Primary Research
- Web Analytics
- Survey Reports
- Research Institute
- Latest Research Reports
- Opinion Leaders
Secondary Research
- Annual Reports
- White Paper
- Latest Press Release
- Industry Association
- Paid Database
- Investor Presentations

Step 4 - Data Triangulation
Involves using different sources of information in order to increase the validity of a study
These sources are likely to be stakeholders in a program - participants, other researchers, program staff, other community members, and so on.
Then we put all data in single framework & apply various statistical tools to find out the dynamic on the market.
During the analysis stage, feedback from the stakeholder groups would be compared to determine areas of agreement as well as areas of divergence


