
Key Insights
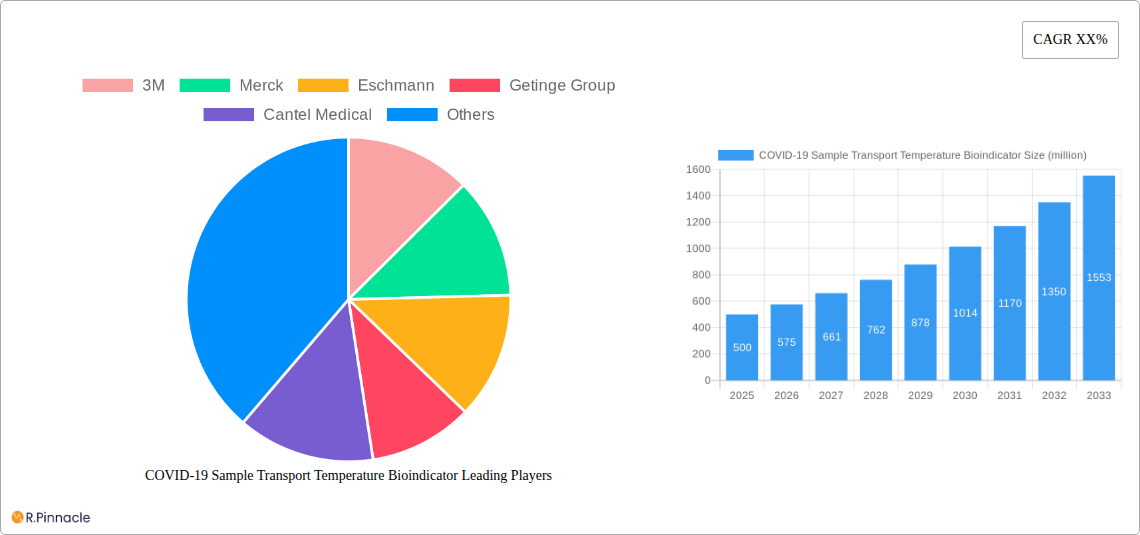
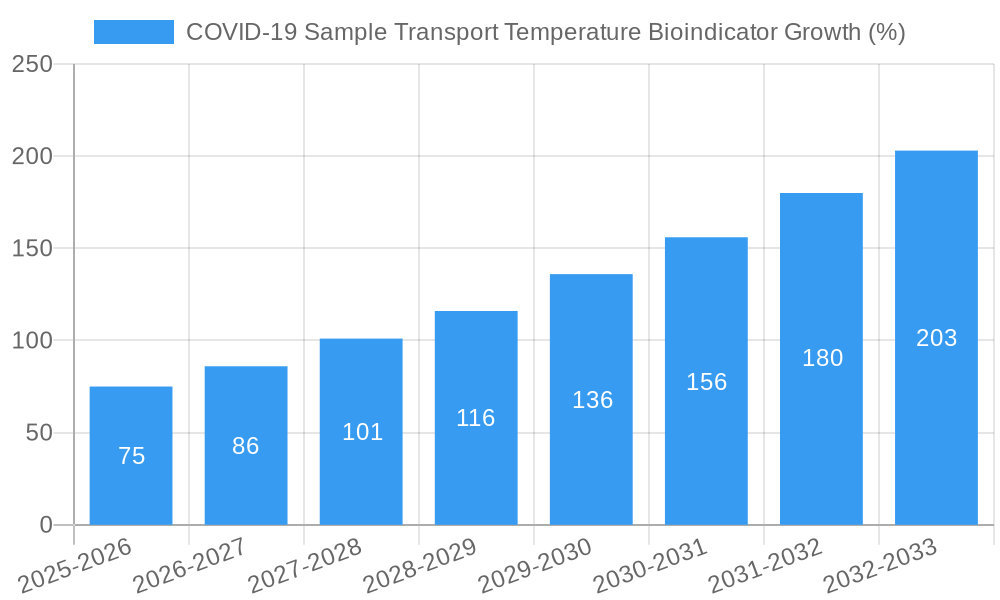
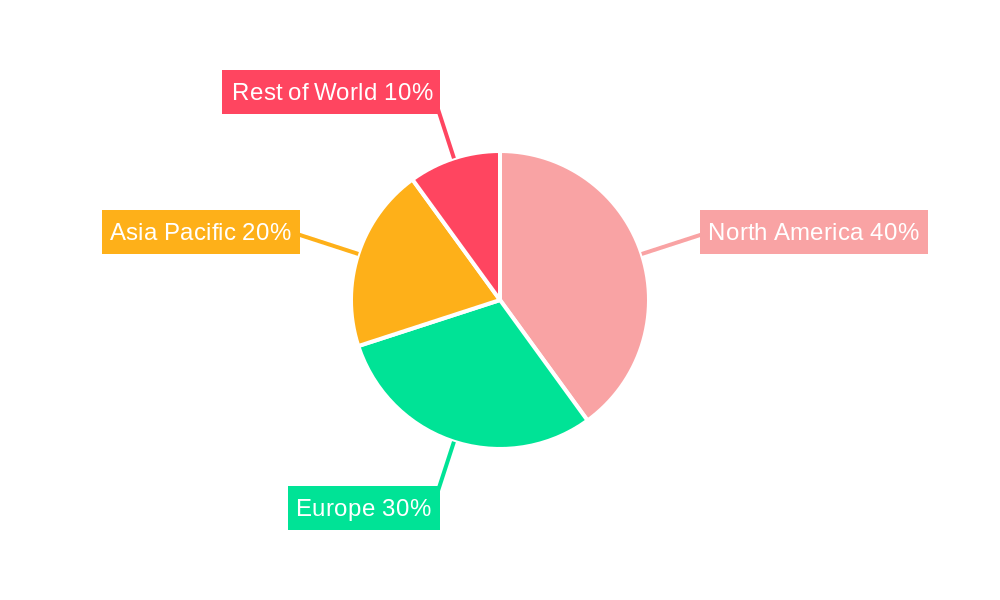
The COVID-19 pandemic significantly accelerated the demand for reliable sample transport temperature bioindicators, driving substantial market growth. The market, estimated at $500 million in 2025, is projected to experience a robust Compound Annual Growth Rate (CAGR) of 15% from 2025 to 2033, reaching approximately $1.8 billion by 2033. This growth is fueled by several key factors. Firstly, the stringent requirements for maintaining the integrity of COVID-19 samples during transport necessitate the widespread adoption of these bioindicators, ensuring accurate and reliable test results. Secondly, increasing diagnostic testing capabilities globally, particularly in developing nations, are fueling demand. Thirdly, the rising awareness of the importance of cold chain management for infectious disease samples and the development of more sophisticated, user-friendly bioindicator technologies are further contributing to market expansion. The disposable bioindicator strip segment currently dominates the market due to its convenience and cost-effectiveness for single-use applications. However, reusable bioindicator strips are gaining traction due to their environmental benefits and potential for cost savings in high-volume settings. Hospitals and laboratories represent the largest application segments, reflecting the high concentration of COVID-19 testing and sample management within these facilities. North America and Europe currently hold the largest market share, driven by advanced healthcare infrastructure and stringent regulatory frameworks. However, the Asia-Pacific region is expected to witness the fastest growth, fueled by rising healthcare expenditure and increasing adoption of advanced diagnostic technologies. Competitive dynamics are characterized by a mix of established players like 3M and Merck and smaller specialized companies.
Despite this significant growth, the market faces some challenges. The high initial investment for implementing temperature monitoring systems and the potential for inaccurate results if used improperly can act as restraints. Furthermore, fluctuations in raw material costs and stringent regulatory compliance requirements can impact market dynamics. However, the ongoing need for efficient and reliable sample transport in various healthcare settings suggests that the long-term market outlook remains positive, with continued innovation in bioindicator technology expected to drive further expansion. The shift towards point-of-care diagnostics and telehealth may present new opportunities for growth in the future.
COVID-19 Sample Transport Temperature Bioindicator Market Report: 2019-2033
This comprehensive report provides a detailed analysis of the global COVID-19 Sample Transport Temperature Bioindicator market, offering invaluable insights for industry professionals, investors, and researchers. The study period spans 2019-2033, with a base year of 2025 and a forecast period of 2025-2033. The report meticulously examines market size, growth drivers, challenges, opportunities, and key players, providing a 360-degree view of this crucial sector. Expect detailed segmentation by application (Hospital, Laboratory, Other) and type (Disposable Bioindicator Strip, Reusable Bioindicator Strip), along with regional breakdowns. The report also features a thorough examination of market dynamics, including M&A activities and innovation trends, providing actionable intelligence for informed decision-making. The market is projected to reach xx million by 2033.
COVID-19 Sample Transport Temperature Bioindicator Market Structure & Innovation Trends
The COVID-19 Sample Transport Temperature Bioindicator market exhibits a moderately consolidated structure, with key players like 3M, Merck, Eschmann, Getinge Group, Cantel Medical, Mesa Laboratories, Steris, Fuze Medical, Matachana, Hu-Friedy, Advanced Sterilization, Terragene, Andersen, Hercuvan, SpotSee, and Temptime Corporation holding significant market share. The combined market share of the top five companies is estimated at xx million in 2025. Innovation is driven by the need for improved accuracy, ease of use, and cost-effectiveness. Regulatory frameworks, particularly those related to medical device safety and efficacy, significantly influence market dynamics. Product substitutes, such as alternative temperature monitoring methods, exert competitive pressure. The end-user demographics are primarily healthcare professionals in hospitals and laboratories. M&A activities have been moderate, with a total deal value of approximately xx million recorded between 2019 and 2024.
- Market Concentration: Moderately consolidated.
- Innovation Drivers: Accuracy, ease of use, cost-effectiveness.
- Regulatory Framework: Stringent medical device regulations.
- Product Substitutes: Alternative temperature monitoring technologies.
- End-User Demographics: Healthcare professionals.
- M&A Activity: xx million in deal value (2019-2024).
COVID-19 Sample Transport Temperature Bioindicator Market Dynamics & Trends
The COVID-19 pandemic significantly boosted the demand for sample transport temperature bioindicators, driving market growth. The CAGR for the period 2025-2033 is projected at xx%, with market penetration steadily increasing across various regions. Technological advancements, particularly in sensor technology and data logging capabilities, are transforming the market. Consumer preference is shifting towards more accurate, reliable, and user-friendly products. Competitive dynamics are shaped by product differentiation, pricing strategies, and technological innovation.
Dominant Regions & Segments in COVID-19 Sample Transport Temperature Bioindicator
The Hospital segment dominates the application landscape, accounting for xx million in 2025, driven by the high volume of COVID-19 testing and sample transportation within hospital settings. The Disposable Bioindicator Strip segment leads the type segment, capturing xx million in 2025 due to convenience and cost-effectiveness. North America is currently the leading region, holding a significant market share in 2025 owing to advanced healthcare infrastructure and high adoption rates.
- Key Drivers for Hospital Segment: High volume of sample transportation.
- Key Drivers for Disposable Bioindicator Strip Segment: Convenience and cost-effectiveness.
- Key Drivers for North America: Advanced healthcare infrastructure, high adoption rates.
COVID-19 Sample Transport Temperature Bioindicator Product Innovations
Recent product innovations focus on enhancing accuracy, reliability, and ease of use. Miniaturization, wireless connectivity, and integrated data logging are key technological trends. Products are designed to seamlessly integrate into existing laboratory workflows, offering superior performance and reduced operational costs. This aligns perfectly with the growing demand for efficient and reliable temperature monitoring solutions in the healthcare sector.
Report Scope & Segmentation Analysis
This report segments the market by application (Hospital, Laboratory, Other) and type (Disposable Bioindicator Strip, Reusable Bioindicator Strip). The Hospital segment is projected to witness significant growth due to high sample volumes, while the Disposable Bioindicator Strip segment is expected to dominate due to its convenience. Each segment is further analyzed based on market size, growth projections, and competitive dynamics.
Key Drivers of COVID-19 Sample Transport Temperature Bioindicator Growth
Key growth drivers include the increasing prevalence of infectious diseases, the rising demand for accurate temperature monitoring in sample transportation, stringent regulatory requirements for sample integrity, and technological advancements in sensor and data logging technologies. The global focus on improving healthcare infrastructure and increasing investments in research and development are also contributing factors.
Challenges in the COVID-19 Sample Transport Temperature Bioindicator Sector
Challenges include stringent regulatory compliance, supply chain disruptions, and intense competition. The cost of advanced bioindicators can be a barrier to adoption in some regions. Maintaining consistent quality control and ensuring the accuracy of the bioindicators are also ongoing challenges for manufacturers.
Emerging Opportunities in COVID-19 Sample Transport Temperature Bioindicator
Emerging opportunities lie in the development of smart bioindicators with integrated data logging and wireless connectivity. Expansion into developing economies with increasing healthcare spending and the development of bioindicators for niche applications present significant growth potential. The adoption of telehealth and home healthcare services is also creating new opportunities for point-of-care testing and temperature monitoring solutions.
Leading Players in the COVID-19 Sample Transport Temperature Bioindicator Market
- 3M
- Merck
- Eschmann
- Getinge Group
- Cantel Medical
- Mesa Laboratories
- Steris
- Fuze Medical
- Matachana
- Hu-Friedy
- Advanced Sterilization
- Terragene
- Andersen
- Hercuvan
- SpotSee
- Temptime Corporation
Key Developments in COVID-19 Sample Transport Temperature Bioindicator Industry
- 2022-03: 3M launched a new generation of disposable bioindicator strips with improved accuracy.
- 2021-11: Merck acquired a smaller bioindicator manufacturer, expanding its product portfolio.
- 2020-05: Getinge Group invested in R&D to develop a wireless bioindicator system. (Further developments can be added here as they become available)
Future Outlook for COVID-19 Sample Transport Temperature Bioindicator Market
The market is poised for sustained growth, driven by technological advancements, increasing healthcare expenditure, and rising demand for accurate temperature monitoring solutions. Strategic partnerships, investments in R&D, and product diversification will be key to success in this competitive market. The market is expected to continue its expansion, with significant opportunities for innovation and growth in the coming years.
COVID-19 Sample Transport Temperature Bioindicator Segmentation
-
1. Application
- 1.1. Hospital
- 1.2. Laboratory
- 1.3. Other
-
2. Types
- 2.1. Disposable Bioindicator Strip
- 2.2. Reusable Bioindicator Strip
COVID-19 Sample Transport Temperature Bioindicator Segmentation By Geography
-
1. North America
- 1.1. United States
- 1.2. Canada
- 1.3. Mexico
-
2. South America
- 2.1. Brazil
- 2.2. Argentina
- 2.3. Rest of South America
-
3. Europe
- 3.1. United Kingdom
- 3.2. Germany
- 3.3. France
- 3.4. Italy
- 3.5. Spain
- 3.6. Russia
- 3.7. Benelux
- 3.8. Nordics
- 3.9. Rest of Europe
-
4. Middle East & Africa
- 4.1. Turkey
- 4.2. Israel
- 4.3. GCC
- 4.4. North Africa
- 4.5. South Africa
- 4.6. Rest of Middle East & Africa
-
5. Asia Pacific
- 5.1. China
- 5.2. India
- 5.3. Japan
- 5.4. South Korea
- 5.5. ASEAN
- 5.6. Oceania
- 5.7. Rest of Asia Pacific
COVID-19 Sample Transport Temperature Bioindicator REPORT HIGHLIGHTS
| Aspects | Details |
|---|---|
| Study Period | 2019-2033 |
| Base Year | 2024 |
| Estimated Year | 2025 |
| Forecast Period | 2025-2033 |
| Historical Period | 2019-2024 |
| Growth Rate | CAGR of XX% from 2019-2033 |
| Segmentation |
|
Table of Contents
- 1. Introduction
- 1.1. Research Scope
- 1.2. Market Segmentation
- 1.3. Research Methodology
- 1.4. Definitions and Assumptions
- 2. Executive Summary
- 2.1. Introduction
- 3. Market Dynamics
- 3.1. Introduction
- 3.2. Market Drivers
- 3.3. Market Restrains
- 3.4. Market Trends
- 4. Market Factor Analysis
- 4.1. Porters Five Forces
- 4.2. Supply/Value Chain
- 4.3. PESTEL analysis
- 4.4. Market Entropy
- 4.5. Patent/Trademark Analysis
- 5. Global COVID-19 Sample Transport Temperature Bioindicator Analysis, Insights and Forecast, 2019-2031
- 5.1. Market Analysis, Insights and Forecast - by Application
- 5.1.1. Hospital
- 5.1.2. Laboratory
- 5.1.3. Other
- 5.2. Market Analysis, Insights and Forecast - by Types
- 5.2.1. Disposable Bioindicator Strip
- 5.2.2. Reusable Bioindicator Strip
- 5.3. Market Analysis, Insights and Forecast - by Region
- 5.3.1. North America
- 5.3.2. South America
- 5.3.3. Europe
- 5.3.4. Middle East & Africa
- 5.3.5. Asia Pacific
- 5.1. Market Analysis, Insights and Forecast - by Application
- 6. North America COVID-19 Sample Transport Temperature Bioindicator Analysis, Insights and Forecast, 2019-2031
- 6.1. Market Analysis, Insights and Forecast - by Application
- 6.1.1. Hospital
- 6.1.2. Laboratory
- 6.1.3. Other
- 6.2. Market Analysis, Insights and Forecast - by Types
- 6.2.1. Disposable Bioindicator Strip
- 6.2.2. Reusable Bioindicator Strip
- 6.1. Market Analysis, Insights and Forecast - by Application
- 7. South America COVID-19 Sample Transport Temperature Bioindicator Analysis, Insights and Forecast, 2019-2031
- 7.1. Market Analysis, Insights and Forecast - by Application
- 7.1.1. Hospital
- 7.1.2. Laboratory
- 7.1.3. Other
- 7.2. Market Analysis, Insights and Forecast - by Types
- 7.2.1. Disposable Bioindicator Strip
- 7.2.2. Reusable Bioindicator Strip
- 7.1. Market Analysis, Insights and Forecast - by Application
- 8. Europe COVID-19 Sample Transport Temperature Bioindicator Analysis, Insights and Forecast, 2019-2031
- 8.1. Market Analysis, Insights and Forecast - by Application
- 8.1.1. Hospital
- 8.1.2. Laboratory
- 8.1.3. Other
- 8.2. Market Analysis, Insights and Forecast - by Types
- 8.2.1. Disposable Bioindicator Strip
- 8.2.2. Reusable Bioindicator Strip
- 8.1. Market Analysis, Insights and Forecast - by Application
- 9. Middle East & Africa COVID-19 Sample Transport Temperature Bioindicator Analysis, Insights and Forecast, 2019-2031
- 9.1. Market Analysis, Insights and Forecast - by Application
- 9.1.1. Hospital
- 9.1.2. Laboratory
- 9.1.3. Other
- 9.2. Market Analysis, Insights and Forecast - by Types
- 9.2.1. Disposable Bioindicator Strip
- 9.2.2. Reusable Bioindicator Strip
- 9.1. Market Analysis, Insights and Forecast - by Application
- 10. Asia Pacific COVID-19 Sample Transport Temperature Bioindicator Analysis, Insights and Forecast, 2019-2031
- 10.1. Market Analysis, Insights and Forecast - by Application
- 10.1.1. Hospital
- 10.1.2. Laboratory
- 10.1.3. Other
- 10.2. Market Analysis, Insights and Forecast - by Types
- 10.2.1. Disposable Bioindicator Strip
- 10.2.2. Reusable Bioindicator Strip
- 10.1. Market Analysis, Insights and Forecast - by Application
- 11. Competitive Analysis
- 11.1. Global Market Share Analysis 2024
- 11.2. Company Profiles
- 11.2.1 3M
- 11.2.1.1. Overview
- 11.2.1.2. Products
- 11.2.1.3. SWOT Analysis
- 11.2.1.4. Recent Developments
- 11.2.1.5. Financials (Based on Availability)
- 11.2.2 Merck
- 11.2.2.1. Overview
- 11.2.2.2. Products
- 11.2.2.3. SWOT Analysis
- 11.2.2.4. Recent Developments
- 11.2.2.5. Financials (Based on Availability)
- 11.2.3 Eschmann
- 11.2.3.1. Overview
- 11.2.3.2. Products
- 11.2.3.3. SWOT Analysis
- 11.2.3.4. Recent Developments
- 11.2.3.5. Financials (Based on Availability)
- 11.2.4 Getinge Group
- 11.2.4.1. Overview
- 11.2.4.2. Products
- 11.2.4.3. SWOT Analysis
- 11.2.4.4. Recent Developments
- 11.2.4.5. Financials (Based on Availability)
- 11.2.5 Cantel Medical
- 11.2.5.1. Overview
- 11.2.5.2. Products
- 11.2.5.3. SWOT Analysis
- 11.2.5.4. Recent Developments
- 11.2.5.5. Financials (Based on Availability)
- 11.2.6 Mesa Laboratories
- 11.2.6.1. Overview
- 11.2.6.2. Products
- 11.2.6.3. SWOT Analysis
- 11.2.6.4. Recent Developments
- 11.2.6.5. Financials (Based on Availability)
- 11.2.7 Steris
- 11.2.7.1. Overview
- 11.2.7.2. Products
- 11.2.7.3. SWOT Analysis
- 11.2.7.4. Recent Developments
- 11.2.7.5. Financials (Based on Availability)
- 11.2.8 Fuze Medical
- 11.2.8.1. Overview
- 11.2.8.2. Products
- 11.2.8.3. SWOT Analysis
- 11.2.8.4. Recent Developments
- 11.2.8.5. Financials (Based on Availability)
- 11.2.9 Matachana
- 11.2.9.1. Overview
- 11.2.9.2. Products
- 11.2.9.3. SWOT Analysis
- 11.2.9.4. Recent Developments
- 11.2.9.5. Financials (Based on Availability)
- 11.2.10 Hu-Friedy
- 11.2.10.1. Overview
- 11.2.10.2. Products
- 11.2.10.3. SWOT Analysis
- 11.2.10.4. Recent Developments
- 11.2.10.5. Financials (Based on Availability)
- 11.2.11 Advanced Sterilization
- 11.2.11.1. Overview
- 11.2.11.2. Products
- 11.2.11.3. SWOT Analysis
- 11.2.11.4. Recent Developments
- 11.2.11.5. Financials (Based on Availability)
- 11.2.12 Terragene
- 11.2.12.1. Overview
- 11.2.12.2. Products
- 11.2.12.3. SWOT Analysis
- 11.2.12.4. Recent Developments
- 11.2.12.5. Financials (Based on Availability)
- 11.2.13 Andersen
- 11.2.13.1. Overview
- 11.2.13.2. Products
- 11.2.13.3. SWOT Analysis
- 11.2.13.4. Recent Developments
- 11.2.13.5. Financials (Based on Availability)
- 11.2.14 Hercuvan
- 11.2.14.1. Overview
- 11.2.14.2. Products
- 11.2.14.3. SWOT Analysis
- 11.2.14.4. Recent Developments
- 11.2.14.5. Financials (Based on Availability)
- 11.2.15 SpotSee
- 11.2.15.1. Overview
- 11.2.15.2. Products
- 11.2.15.3. SWOT Analysis
- 11.2.15.4. Recent Developments
- 11.2.15.5. Financials (Based on Availability)
- 11.2.16 Temptime Corporation
- 11.2.16.1. Overview
- 11.2.16.2. Products
- 11.2.16.3. SWOT Analysis
- 11.2.16.4. Recent Developments
- 11.2.16.5. Financials (Based on Availability)
- 11.2.1 3M
List of Figures
- Figure 1: Global COVID-19 Sample Transport Temperature Bioindicator Revenue Breakdown (million, %) by Region 2024 & 2032
- Figure 2: North America COVID-19 Sample Transport Temperature Bioindicator Revenue (million), by Application 2024 & 2032
- Figure 3: North America COVID-19 Sample Transport Temperature Bioindicator Revenue Share (%), by Application 2024 & 2032
- Figure 4: North America COVID-19 Sample Transport Temperature Bioindicator Revenue (million), by Types 2024 & 2032
- Figure 5: North America COVID-19 Sample Transport Temperature Bioindicator Revenue Share (%), by Types 2024 & 2032
- Figure 6: North America COVID-19 Sample Transport Temperature Bioindicator Revenue (million), by Country 2024 & 2032
- Figure 7: North America COVID-19 Sample Transport Temperature Bioindicator Revenue Share (%), by Country 2024 & 2032
- Figure 8: South America COVID-19 Sample Transport Temperature Bioindicator Revenue (million), by Application 2024 & 2032
- Figure 9: South America COVID-19 Sample Transport Temperature Bioindicator Revenue Share (%), by Application 2024 & 2032
- Figure 10: South America COVID-19 Sample Transport Temperature Bioindicator Revenue (million), by Types 2024 & 2032
- Figure 11: South America COVID-19 Sample Transport Temperature Bioindicator Revenue Share (%), by Types 2024 & 2032
- Figure 12: South America COVID-19 Sample Transport Temperature Bioindicator Revenue (million), by Country 2024 & 2032
- Figure 13: South America COVID-19 Sample Transport Temperature Bioindicator Revenue Share (%), by Country 2024 & 2032
- Figure 14: Europe COVID-19 Sample Transport Temperature Bioindicator Revenue (million), by Application 2024 & 2032
- Figure 15: Europe COVID-19 Sample Transport Temperature Bioindicator Revenue Share (%), by Application 2024 & 2032
- Figure 16: Europe COVID-19 Sample Transport Temperature Bioindicator Revenue (million), by Types 2024 & 2032
- Figure 17: Europe COVID-19 Sample Transport Temperature Bioindicator Revenue Share (%), by Types 2024 & 2032
- Figure 18: Europe COVID-19 Sample Transport Temperature Bioindicator Revenue (million), by Country 2024 & 2032
- Figure 19: Europe COVID-19 Sample Transport Temperature Bioindicator Revenue Share (%), by Country 2024 & 2032
- Figure 20: Middle East & Africa COVID-19 Sample Transport Temperature Bioindicator Revenue (million), by Application 2024 & 2032
- Figure 21: Middle East & Africa COVID-19 Sample Transport Temperature Bioindicator Revenue Share (%), by Application 2024 & 2032
- Figure 22: Middle East & Africa COVID-19 Sample Transport Temperature Bioindicator Revenue (million), by Types 2024 & 2032
- Figure 23: Middle East & Africa COVID-19 Sample Transport Temperature Bioindicator Revenue Share (%), by Types 2024 & 2032
- Figure 24: Middle East & Africa COVID-19 Sample Transport Temperature Bioindicator Revenue (million), by Country 2024 & 2032
- Figure 25: Middle East & Africa COVID-19 Sample Transport Temperature Bioindicator Revenue Share (%), by Country 2024 & 2032
- Figure 26: Asia Pacific COVID-19 Sample Transport Temperature Bioindicator Revenue (million), by Application 2024 & 2032
- Figure 27: Asia Pacific COVID-19 Sample Transport Temperature Bioindicator Revenue Share (%), by Application 2024 & 2032
- Figure 28: Asia Pacific COVID-19 Sample Transport Temperature Bioindicator Revenue (million), by Types 2024 & 2032
- Figure 29: Asia Pacific COVID-19 Sample Transport Temperature Bioindicator Revenue Share (%), by Types 2024 & 2032
- Figure 30: Asia Pacific COVID-19 Sample Transport Temperature Bioindicator Revenue (million), by Country 2024 & 2032
- Figure 31: Asia Pacific COVID-19 Sample Transport Temperature Bioindicator Revenue Share (%), by Country 2024 & 2032
List of Tables
- Table 1: Global COVID-19 Sample Transport Temperature Bioindicator Revenue million Forecast, by Region 2019 & 2032
- Table 2: Global COVID-19 Sample Transport Temperature Bioindicator Revenue million Forecast, by Application 2019 & 2032
- Table 3: Global COVID-19 Sample Transport Temperature Bioindicator Revenue million Forecast, by Types 2019 & 2032
- Table 4: Global COVID-19 Sample Transport Temperature Bioindicator Revenue million Forecast, by Region 2019 & 2032
- Table 5: Global COVID-19 Sample Transport Temperature Bioindicator Revenue million Forecast, by Application 2019 & 2032
- Table 6: Global COVID-19 Sample Transport Temperature Bioindicator Revenue million Forecast, by Types 2019 & 2032
- Table 7: Global COVID-19 Sample Transport Temperature Bioindicator Revenue million Forecast, by Country 2019 & 2032
- Table 8: United States COVID-19 Sample Transport Temperature Bioindicator Revenue (million) Forecast, by Application 2019 & 2032
- Table 9: Canada COVID-19 Sample Transport Temperature Bioindicator Revenue (million) Forecast, by Application 2019 & 2032
- Table 10: Mexico COVID-19 Sample Transport Temperature Bioindicator Revenue (million) Forecast, by Application 2019 & 2032
- Table 11: Global COVID-19 Sample Transport Temperature Bioindicator Revenue million Forecast, by Application 2019 & 2032
- Table 12: Global COVID-19 Sample Transport Temperature Bioindicator Revenue million Forecast, by Types 2019 & 2032
- Table 13: Global COVID-19 Sample Transport Temperature Bioindicator Revenue million Forecast, by Country 2019 & 2032
- Table 14: Brazil COVID-19 Sample Transport Temperature Bioindicator Revenue (million) Forecast, by Application 2019 & 2032
- Table 15: Argentina COVID-19 Sample Transport Temperature Bioindicator Revenue (million) Forecast, by Application 2019 & 2032
- Table 16: Rest of South America COVID-19 Sample Transport Temperature Bioindicator Revenue (million) Forecast, by Application 2019 & 2032
- Table 17: Global COVID-19 Sample Transport Temperature Bioindicator Revenue million Forecast, by Application 2019 & 2032
- Table 18: Global COVID-19 Sample Transport Temperature Bioindicator Revenue million Forecast, by Types 2019 & 2032
- Table 19: Global COVID-19 Sample Transport Temperature Bioindicator Revenue million Forecast, by Country 2019 & 2032
- Table 20: United Kingdom COVID-19 Sample Transport Temperature Bioindicator Revenue (million) Forecast, by Application 2019 & 2032
- Table 21: Germany COVID-19 Sample Transport Temperature Bioindicator Revenue (million) Forecast, by Application 2019 & 2032
- Table 22: France COVID-19 Sample Transport Temperature Bioindicator Revenue (million) Forecast, by Application 2019 & 2032
- Table 23: Italy COVID-19 Sample Transport Temperature Bioindicator Revenue (million) Forecast, by Application 2019 & 2032
- Table 24: Spain COVID-19 Sample Transport Temperature Bioindicator Revenue (million) Forecast, by Application 2019 & 2032
- Table 25: Russia COVID-19 Sample Transport Temperature Bioindicator Revenue (million) Forecast, by Application 2019 & 2032
- Table 26: Benelux COVID-19 Sample Transport Temperature Bioindicator Revenue (million) Forecast, by Application 2019 & 2032
- Table 27: Nordics COVID-19 Sample Transport Temperature Bioindicator Revenue (million) Forecast, by Application 2019 & 2032
- Table 28: Rest of Europe COVID-19 Sample Transport Temperature Bioindicator Revenue (million) Forecast, by Application 2019 & 2032
- Table 29: Global COVID-19 Sample Transport Temperature Bioindicator Revenue million Forecast, by Application 2019 & 2032
- Table 30: Global COVID-19 Sample Transport Temperature Bioindicator Revenue million Forecast, by Types 2019 & 2032
- Table 31: Global COVID-19 Sample Transport Temperature Bioindicator Revenue million Forecast, by Country 2019 & 2032
- Table 32: Turkey COVID-19 Sample Transport Temperature Bioindicator Revenue (million) Forecast, by Application 2019 & 2032
- Table 33: Israel COVID-19 Sample Transport Temperature Bioindicator Revenue (million) Forecast, by Application 2019 & 2032
- Table 34: GCC COVID-19 Sample Transport Temperature Bioindicator Revenue (million) Forecast, by Application 2019 & 2032
- Table 35: North Africa COVID-19 Sample Transport Temperature Bioindicator Revenue (million) Forecast, by Application 2019 & 2032
- Table 36: South Africa COVID-19 Sample Transport Temperature Bioindicator Revenue (million) Forecast, by Application 2019 & 2032
- Table 37: Rest of Middle East & Africa COVID-19 Sample Transport Temperature Bioindicator Revenue (million) Forecast, by Application 2019 & 2032
- Table 38: Global COVID-19 Sample Transport Temperature Bioindicator Revenue million Forecast, by Application 2019 & 2032
- Table 39: Global COVID-19 Sample Transport Temperature Bioindicator Revenue million Forecast, by Types 2019 & 2032
- Table 40: Global COVID-19 Sample Transport Temperature Bioindicator Revenue million Forecast, by Country 2019 & 2032
- Table 41: China COVID-19 Sample Transport Temperature Bioindicator Revenue (million) Forecast, by Application 2019 & 2032
- Table 42: India COVID-19 Sample Transport Temperature Bioindicator Revenue (million) Forecast, by Application 2019 & 2032
- Table 43: Japan COVID-19 Sample Transport Temperature Bioindicator Revenue (million) Forecast, by Application 2019 & 2032
- Table 44: South Korea COVID-19 Sample Transport Temperature Bioindicator Revenue (million) Forecast, by Application 2019 & 2032
- Table 45: ASEAN COVID-19 Sample Transport Temperature Bioindicator Revenue (million) Forecast, by Application 2019 & 2032
- Table 46: Oceania COVID-19 Sample Transport Temperature Bioindicator Revenue (million) Forecast, by Application 2019 & 2032
- Table 47: Rest of Asia Pacific COVID-19 Sample Transport Temperature Bioindicator Revenue (million) Forecast, by Application 2019 & 2032
Frequently Asked Questions
1. What is the projected Compound Annual Growth Rate (CAGR) of the COVID-19 Sample Transport Temperature Bioindicator?
The projected CAGR is approximately XX%.
2. Which companies are prominent players in the COVID-19 Sample Transport Temperature Bioindicator?
Key companies in the market include 3M, Merck, Eschmann, Getinge Group, Cantel Medical, Mesa Laboratories, Steris, Fuze Medical, Matachana, Hu-Friedy, Advanced Sterilization, Terragene, Andersen, Hercuvan, SpotSee, Temptime Corporation.
3. What are the main segments of the COVID-19 Sample Transport Temperature Bioindicator?
The market segments include Application, Types.
4. Can you provide details about the market size?
The market size is estimated to be USD XXX million as of 2022.
5. What are some drivers contributing to market growth?
N/A
6. What are the notable trends driving market growth?
N/A
7. Are there any restraints impacting market growth?
N/A
8. Can you provide examples of recent developments in the market?
N/A
9. What pricing options are available for accessing the report?
Pricing options include single-user, multi-user, and enterprise licenses priced at USD 4900.00, USD 7350.00, and USD 9800.00 respectively.
10. Is the market size provided in terms of value or volume?
The market size is provided in terms of value, measured in million.
11. Are there any specific market keywords associated with the report?
Yes, the market keyword associated with the report is "COVID-19 Sample Transport Temperature Bioindicator," which aids in identifying and referencing the specific market segment covered.
12. How do I determine which pricing option suits my needs best?
The pricing options vary based on user requirements and access needs. Individual users may opt for single-user licenses, while businesses requiring broader access may choose multi-user or enterprise licenses for cost-effective access to the report.
13. Are there any additional resources or data provided in the COVID-19 Sample Transport Temperature Bioindicator report?
While the report offers comprehensive insights, it's advisable to review the specific contents or supplementary materials provided to ascertain if additional resources or data are available.
14. How can I stay updated on further developments or reports in the COVID-19 Sample Transport Temperature Bioindicator?
To stay informed about further developments, trends, and reports in the COVID-19 Sample Transport Temperature Bioindicator, consider subscribing to industry newsletters, following relevant companies and organizations, or regularly checking reputable industry news sources and publications.
Methodology
Step 1 - Identification of Relevant Samples Size from Population Database


Step 2 - Approaches for Defining Global Market Size (Value, Volume* & Price*)

Note*: In applicable scenarios
Step 3 - Data Sources
Primary Research
- Web Analytics
- Survey Reports
- Research Institute
- Latest Research Reports
- Opinion Leaders
Secondary Research
- Annual Reports
- White Paper
- Latest Press Release
- Industry Association
- Paid Database
- Investor Presentations

Step 4 - Data Triangulation
Involves using different sources of information in order to increase the validity of a study
These sources are likely to be stakeholders in a program - participants, other researchers, program staff, other community members, and so on.
Then we put all data in single framework & apply various statistical tools to find out the dynamic on the market.
During the analysis stage, feedback from the stakeholder groups would be compared to determine areas of agreement as well as areas of divergence


