

Key Insights
The African glass bottles and containers market, valued at approximately 16000 million in 2024, is projected to experience robust growth, with a compound annual growth rate (CAGR) of 4.5% from 2024 to 2033. Key drivers include the burgeoning food and beverage industry, rising popularity of packaged goods, and the expansion of the pharmaceutical and cosmetics sectors. While raw material price fluctuations and supply chain disruptions pose challenges, the market's long-term outlook is positive due to significant untapped potential. The market is segmented by end-user industry (beverages, food, cosmetics, pharmaceuticals, and others) and geography. South Africa, Egypt, and Nigeria are major markets. The competitive landscape features multinational corporations and local players, fostering innovation and price competitiveness.
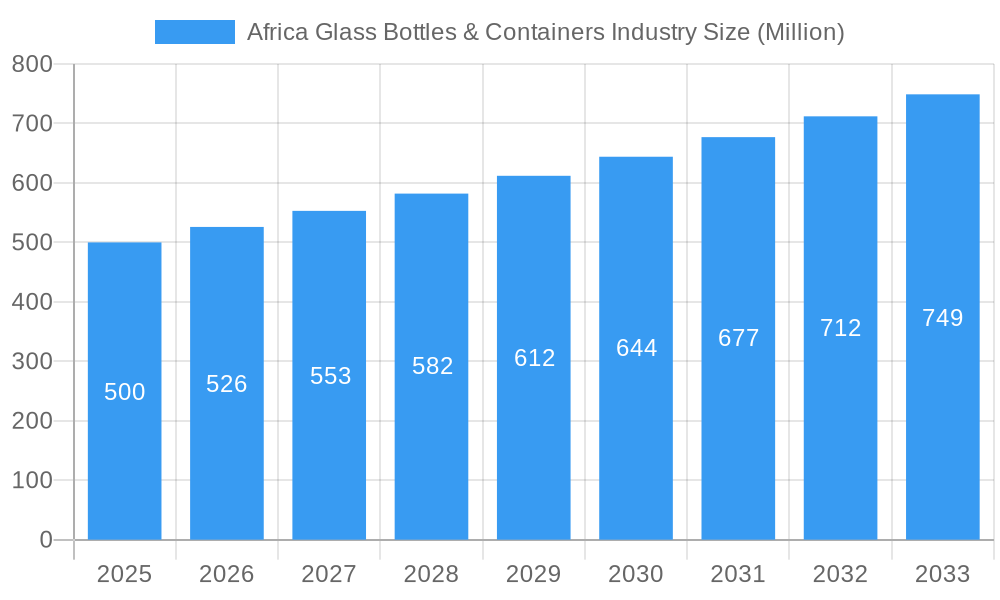
Africa Glass Bottles & Containers Industry Market Size (In Billion)
The beverage sector, encompassing alcoholic and non-alcoholic drinks, holds a significant share, driven by increasing consumption of bottled beverages. The food sector is also a major contributor, with growing demand for packaged food products. Cosmetics and pharmaceuticals, though currently smaller segments, demonstrate substantial growth potential fueled by rising disposable incomes and health awareness. Geographically, South Africa boasts an established glass manufacturing industry, while Nigeria and Egypt offer significant growth opportunities due to their large populations and developing economies. The "Rest of Africa" segment indicates substantial latent potential as these markets mature and develop robust infrastructure for packaging and distribution. Understanding these regional dynamics is critical for strategic market entry and expansion.
Africa Glass Bottles & Containers Industry Company Market Share
Africa Glass Bottles & Containers Industry Report: 2019-2033
This comprehensive report provides an in-depth analysis of the Africa glass bottles and containers industry, offering valuable insights for industry professionals, investors, and strategic decision-makers. Covering the period 2019-2033, with a base year of 2025 and a forecast period of 2025-2033, this report unveils the market's structure, dynamics, and future potential. The study incorporates extensive data and analysis on market size, growth drivers, challenges, and opportunities, providing a 360-degree view of this dynamic sector. The market value in 2025 is estimated at xx Million, and is projected to grow at a CAGR of xx% during the forecast period.
Africa Glass Bottles & Containers Industry Market Structure & Innovation Trends
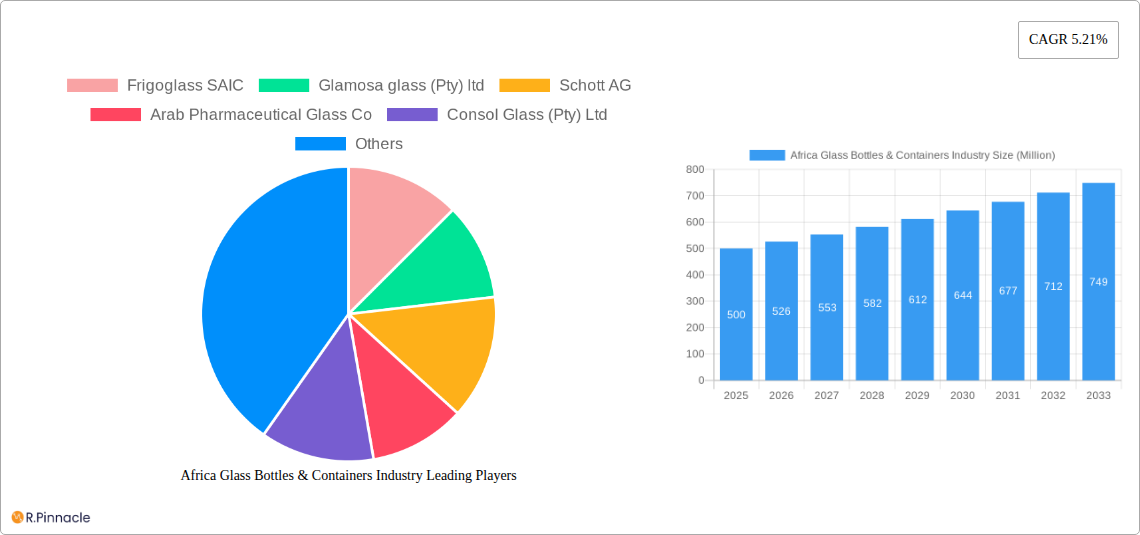
This section analyzes the competitive landscape of the African glass bottles and containers market, examining market concentration, innovation drivers, regulatory frameworks, and key industry activities. The market is characterized by a mix of large multinational corporations and smaller regional players. Major companies include Frigoglass SAIC, Glamosa glass (Pty) ltd, Schott AG, Arab Pharmaceutical Glass Co, Consol Glass (Pty) Ltd, Middle East Glass Manufacturing Company SAE (MEG), Kandil Glass, Bonpak (Pty) Ltd, Nurrin Pharmalab (Pty) Ltd, National Company for Glass and Crystal (SAE), and United Glass Company. However, the list is not exhaustive.
Market share data indicates a relatively fragmented market, with no single company dominating. The level of concentration is moderate, with the top five players collectively holding an estimated xx% market share in 2025. Innovation is driven by factors such as increasing demand for lightweight and sustainable packaging, advancements in glass manufacturing technologies, and the rising adoption of sophisticated design and decoration techniques.
Mergers and acquisitions (M&A) activity in the sector has been relatively moderate in recent years, with deal values averaging approximately xx Million per transaction. Key regulatory frameworks governing the industry vary across different African countries, impacting production costs, environmental regulations, and product safety standards. The sector faces challenges from substitute packaging materials, such as plastic and metal containers, with their ongoing impact on market share requiring close monitoring. End-user demographics, with a shift toward health-conscious consumers, also shape demand.
Africa Glass Bottles & Containers Industry Market Dynamics & Trends
The African glass bottles and containers market is experiencing significant growth driven by several factors. The rising population, coupled with increasing disposable incomes and urbanization, is leading to higher demand for packaged goods across various sectors. The expanding food and beverage industry, particularly the alcoholic and non-alcoholic beverage segments, is a key growth driver. Technological advancements in glass manufacturing, such as improved efficiency and automation, are enhancing production capabilities and reducing costs. Consumer preferences are shifting towards premium and differentiated packaging, influencing demand for innovative bottle designs and enhanced functionality. Furthermore, the growing popularity of e-commerce is contributing to the rising demand for tamper-evident and durable packaging.
Competitive dynamics remain intense, with companies focusing on product innovation, cost optimization, and expanding their distribution networks. The market is witnessing increasing adoption of sustainable packaging practices, as consumers and regulatory bodies are placing more emphasis on environmental sustainability. The CAGR for the market is projected to be xx%, driven primarily by growth in the beverage and food sectors. Market penetration across different African countries varies, with South Africa and Egypt exhibiting higher penetration rates compared to other regions.
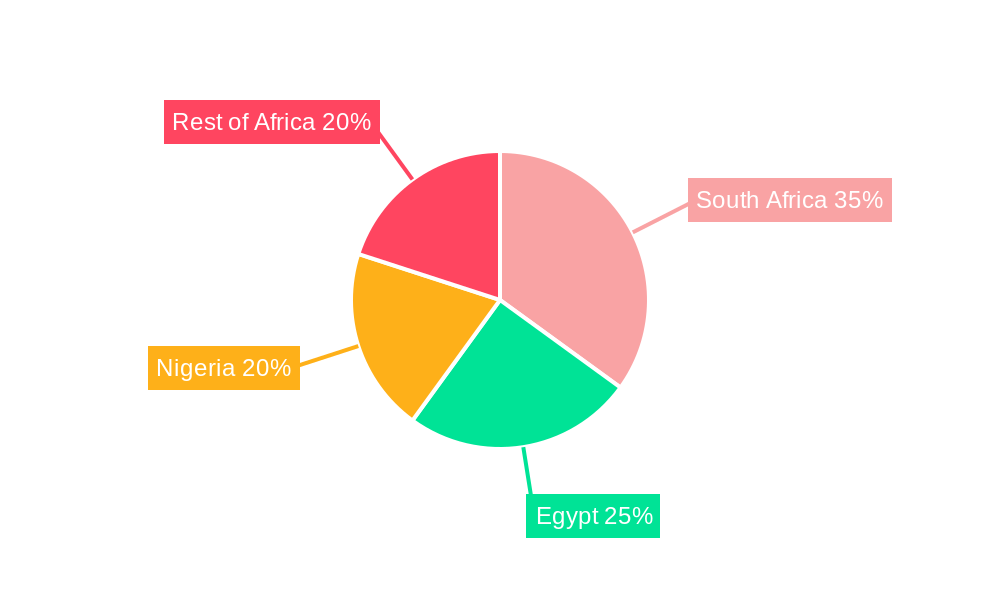
Dominant Regions & Segments in Africa Glass Bottles & Containers Industry
South Africa is currently the dominant market for glass bottles and containers in Africa, driven by a mature and diverse economy. This dominance is largely influenced by the country's robust food and beverage processing industries, established infrastructure, and a sizeable population. Egypt is another significant player, exhibiting strong growth potential due to its rapidly growing population and expanding manufacturing base. Nigeria presents a considerable long-term opportunity given its massive population, but infrastructure and economic stability issues have impacted its current market size. The "Rest of Africa" segment holds promising potential, with several countries experiencing positive economic growth and rising demand for packaged goods.
- Key Drivers for South Africa: Well-established food and beverage sector, advanced infrastructure, relatively stable economy.
- Key Drivers for Egypt: Large and growing population, expanding manufacturing sector, strategic location.
- Key Drivers for Nigeria: Massive population, growing middle class, potential for significant growth (currently constrained by infrastructure).
- Key Drivers for Rest of Africa: Rising disposable incomes, economic growth in several countries, increasing urbanization.
The beverage segment dominates the end-user industry landscape, accounting for the largest share of the market. However, other sectors, including food, cosmetics, and pharmaceuticals, are also experiencing significant growth, contributing to the overall market expansion.
Africa Glass Bottles & Containers Industry Product Innovations
Recent innovations in the industry include the development of lightweight glass bottles, which reduce transportation costs and improve environmental sustainability. There's also an increasing focus on custom-designed and aesthetically appealing bottles to meet the changing demands of consumers seeking premium and differentiated products. Technological advancements such as advanced coatings and decoration techniques, enabling improved product presentation and branding, are shaping the competitive landscape.
Report Scope & Segmentation Analysis
This report segments the African glass bottles and containers market by end-user industry (Beverages, Food, Cosmetics, Pharmaceutical, and Other End-user Industries) and by country (Egypt, Nigeria, South Africa, and Rest of Africa). Each segment's growth projections are analyzed, considering market size, competitive dynamics, and region-specific factors. For example, the beverage segment is projected to experience the fastest growth due to the increasing consumption of packaged drinks. Similarly, South Africa shows strong growth because of its advanced manufacturing capabilities and demand.
Key Drivers of Africa Glass Bottles & Containers Industry Growth
Several factors are driving the growth of the Africa glass bottles and containers market. These include: The rise in disposable incomes and urbanization, leading to increased demand for packaged goods; The expanding food and beverage industry, particularly the alcoholic and non-alcoholic beverage segments; Technological advancements in glass manufacturing processes, enhancing efficiency and reducing costs; and Government initiatives promoting industrial development and supporting local manufacturers.
Challenges in the Africa Glass Bottles & Containers Industry Sector
Challenges include: Infrastructure limitations in some African countries, hindering efficient transportation and logistics; Fluctuations in raw material prices, impacting production costs; Competition from alternative packaging materials, such as plastics, impacting market share; Regulatory hurdles and varying standards across different African countries; The increasing cost of energy, impacting manufacturing expenses.
Emerging Opportunities in Africa Glass Bottles & Containers Industry
Emerging opportunities include: The growing demand for sustainable and environmentally friendly packaging; The increasing popularity of e-commerce and the need for tamper-evident packaging; The rising demand for premium and differentiated packaging across various sectors; Expansion into new markets across Africa with growing economies and populations; Development of innovative product designs and specialized bottles for niche markets.
Leading Players in the Africa Glass Bottles & Containers Industry Market
- Frigoglass SAIC
- Glamosa glass (Pty) ltd
- Schott AG
- Arab Pharmaceutical Glass Co
- Consol Glass (Pty) Ltd
- Middle East Glass Manufacturing Company SAE (MEG)
- Kandil Glass
- Bonpak (Pty) Ltd
- Nurrin Pharmalab (Pty) Ltd
- National Company for Glass and Crystal (SAE)
- United Glass Company
Key Developments in Africa Glass Bottles & Containers Industry Industry
- November 2022: Ardagh Glass Packaging Africa announced plans to invest in a third furnace at its Nigel manufacturing site in South Africa, significantly boosting production capacity by late 2023.
- June 2022: Bravo Design created new gin bottles for Cape Saint Blaize Distillery in South Africa, highlighting innovative package design's role in market differentiation.
Future Outlook for Africa Glass Bottles & Containers Industry Market
The future outlook for the African glass bottles and containers market is positive. Continued population growth, expanding economies, and rising demand for packaged goods will fuel market expansion. The increasing focus on sustainable and innovative packaging will create new opportunities for manufacturers to develop and market environmentally friendly products. Strategic partnerships, technological advancements, and efficient supply chain management will be crucial for companies to thrive in this dynamic market.
Africa Glass Bottles & Containers Industry Segmentation
-
1. End-user Industry
-
1.1. Beverages**
- 1.1.1. Wine and Spirits
- 1.1.2. Beer and Cider
- 1.1.3. Other Beverages (Non-alcoholic and Alcoholic)
- 1.2. Food
- 1.3. Cosmetics
- 1.4. Pharmaceuticals
- 1.5. Other End-user Industries
-
1.1. Beverages**
Africa Glass Bottles & Containers Industry Segmentation By Geography
-
1. Africa
- 1.1. Nigeria
- 1.2. South Africa
- 1.3. Egypt
- 1.4. Kenya
- 1.5. Ethiopia
- 1.6. Morocco
- 1.7. Ghana
- 1.8. Algeria
- 1.9. Tanzania
- 1.10. Ivory Coast
Africa Glass Bottles & Containers Industry Regional Market Share
Geographic Coverage of Africa Glass Bottles & Containers Industry
Africa Glass Bottles & Containers Industry REPORT HIGHLIGHTS
| Aspects | Details |
|---|---|
| Study Period | 2020-2034 |
| Base Year | 2025 |
| Estimated Year | 2026 |
| Forecast Period | 2026-2034 |
| Historical Period | 2020-2025 |
| Growth Rate | CAGR of 4.5% from 2020-2034 |
| Segmentation |
|
Table of Contents
- 1. Introduction
- 1.1. Research Scope
- 1.2. Market Segmentation
- 1.3. Research Objective
- 1.4. Definitions and Assumptions
- 2. Executive Summary
- 2.1. Market Snapshot
- 3. Market Dynamics
- 3.1. Market Drivers
- 3.2. Market Restrains
- 3.3. Market Trends
- 3.4. Market Opportunities
- 4. Market Factor Analysis
- 4.1. Porters Five Forces
- 4.1.1. Bargaining Power of Suppliers
- 4.1.2. Bargaining Power of Buyers
- 4.1.3. Threat of New Entrants
- 4.1.4. Threat of Substitutes
- 4.1.5. Competitive Rivalry
- 4.2. PESTEL analysis
- 4.3. BCG Analysis
- 4.3.1. Stars (High Growth, High Market Share)
- 4.3.2. Cash Cows (Low Growth, High Market Share)
- 4.3.3. Question Mark (High Growth, Low Market Share)
- 4.3.4. Dogs (Low Growth, Low Market Share)
- 4.4. Ansoff Matrix Analysis
- 4.5. Supply Chain Analysis
- 4.6. Regulatory Landscape
- 4.7. Current Market Potential and Opportunity Assessment (TAM–SAM–SOM Framework)
- 4.8. PRI Analyst Note
- 4.1. Porters Five Forces
- 5. Market Analysis, Insights and Forecast 2021-2033
- 5.1. Market Analysis, Insights and Forecast - by End-user Industry
- 5.1.1. Beverages**
- 5.1.1.1. Wine and Spirits
- 5.1.1.2. Beer and Cider
- 5.1.1.3. Other Beverages (Non-alcoholic and Alcoholic)
- 5.1.2. Food
- 5.1.3. Cosmetics
- 5.1.4. Pharmaceuticals
- 5.1.5. Other End-user Industries
- 5.1.1. Beverages**
- 5.2. Market Analysis, Insights and Forecast - by Region
- 5.2.1. Africa
- 5.1. Market Analysis, Insights and Forecast - by End-user Industry
- 6. Africa Glass Bottles & Containers Industry Analysis, Insights and Forecast, 2021-2033
- 6.1. Market Analysis, Insights and Forecast - by End-user Industry
- 6.1.1. Beverages**
- 6.1.1.1. Wine and Spirits
- 6.1.1.2. Beer and Cider
- 6.1.1.3. Other Beverages (Non-alcoholic and Alcoholic)
- 6.1.2. Food
- 6.1.3. Cosmetics
- 6.1.4. Pharmaceuticals
- 6.1.5. Other End-user Industries
- 6.1.1. Beverages**
- 6.1. Market Analysis, Insights and Forecast - by End-user Industry
- 7. Competitive Analysis
- 7.1. Company Profiles
- 7.1.1 Frigoglass SAIC
- 7.1.1.1. Company Overview
- 7.1.1.2. Products
- 7.1.1.3. Company Financials
- 7.1.1.4. SWOT Analysis
- 7.1.2 Glamosa glass (Pty) ltd
- 7.1.2.1. Company Overview
- 7.1.2.2. Products
- 7.1.2.3. Company Financials
- 7.1.2.4. SWOT Analysis
- 7.1.3 Schott AG
- 7.1.3.1. Company Overview
- 7.1.3.2. Products
- 7.1.3.3. Company Financials
- 7.1.3.4. SWOT Analysis
- 7.1.4 Arab Pharmaceutical Glass Co
- 7.1.4.1. Company Overview
- 7.1.4.2. Products
- 7.1.4.3. Company Financials
- 7.1.4.4. SWOT Analysis
- 7.1.5 Consol Glass (Pty) Ltd
- 7.1.5.1. Company Overview
- 7.1.5.2. Products
- 7.1.5.3. Company Financials
- 7.1.5.4. SWOT Analysis
- 7.1.6 Middle East Glass Manufacturing Company SAE (MEG)
- 7.1.6.1. Company Overview
- 7.1.6.2. Products
- 7.1.6.3. Company Financials
- 7.1.6.4. SWOT Analysis
- 7.1.7 Kandil Glass
- 7.1.7.1. Company Overview
- 7.1.7.2. Products
- 7.1.7.3. Company Financials
- 7.1.7.4. SWOT Analysis
- 7.1.8 Bonpak (Pty) Ltd
- 7.1.8.1. Company Overview
- 7.1.8.2. Products
- 7.1.8.3. Company Financials
- 7.1.8.4. SWOT Analysis
- 7.1.9 Nurrin Pharmalab (Pty) Ltd*List Not Exhaustive
- 7.1.9.1. Company Overview
- 7.1.9.2. Products
- 7.1.9.3. Company Financials
- 7.1.9.4. SWOT Analysis
- 7.1.10 National Company for Glass and Crystal (SAE)
- 7.1.10.1. Company Overview
- 7.1.10.2. Products
- 7.1.10.3. Company Financials
- 7.1.10.4. SWOT Analysis
- 7.1.11 United Glass Company
- 7.1.11.1. Company Overview
- 7.1.11.2. Products
- 7.1.11.3. Company Financials
- 7.1.11.4. SWOT Analysis
- 7.1.1 Frigoglass SAIC
- 7.2. Market Entropy
- 7.2.1 Company's Key Areas Served
- 7.2.2 Recent Developments
- 7.3. Company Market Share Analysis 2025
- 7.3.1 Top 5 Companies Market Share Analysis
- 7.3.2 Top 3 Companies Market Share Analysis
- 7.4. List of Potential Customers
- 8. Research Methodology
List of Figures
- Figure 1: Africa Glass Bottles & Containers Industry Revenue Breakdown (million, %) by Product 2025 & 2033
- Figure 2: Africa Glass Bottles & Containers Industry Share (%) by Company 2025
List of Tables
- Table 1: Africa Glass Bottles & Containers Industry Revenue million Forecast, by End-user Industry 2020 & 2033
- Table 2: Africa Glass Bottles & Containers Industry Volume Billion Forecast, by End-user Industry 2020 & 2033
- Table 3: Africa Glass Bottles & Containers Industry Revenue million Forecast, by Region 2020 & 2033
- Table 4: Africa Glass Bottles & Containers Industry Volume Billion Forecast, by Region 2020 & 2033
- Table 5: Africa Glass Bottles & Containers Industry Revenue million Forecast, by End-user Industry 2020 & 2033
- Table 6: Africa Glass Bottles & Containers Industry Volume Billion Forecast, by End-user Industry 2020 & 2033
- Table 7: Africa Glass Bottles & Containers Industry Revenue million Forecast, by Country 2020 & 2033
- Table 8: Africa Glass Bottles & Containers Industry Volume Billion Forecast, by Country 2020 & 2033
- Table 9: Nigeria Africa Glass Bottles & Containers Industry Revenue (million) Forecast, by Application 2020 & 2033
- Table 10: Nigeria Africa Glass Bottles & Containers Industry Volume (Billion) Forecast, by Application 2020 & 2033
- Table 11: South Africa Africa Glass Bottles & Containers Industry Revenue (million) Forecast, by Application 2020 & 2033
- Table 12: South Africa Africa Glass Bottles & Containers Industry Volume (Billion) Forecast, by Application 2020 & 2033
- Table 13: Egypt Africa Glass Bottles & Containers Industry Revenue (million) Forecast, by Application 2020 & 2033
- Table 14: Egypt Africa Glass Bottles & Containers Industry Volume (Billion) Forecast, by Application 2020 & 2033
- Table 15: Kenya Africa Glass Bottles & Containers Industry Revenue (million) Forecast, by Application 2020 & 2033
- Table 16: Kenya Africa Glass Bottles & Containers Industry Volume (Billion) Forecast, by Application 2020 & 2033
- Table 17: Ethiopia Africa Glass Bottles & Containers Industry Revenue (million) Forecast, by Application 2020 & 2033
- Table 18: Ethiopia Africa Glass Bottles & Containers Industry Volume (Billion) Forecast, by Application 2020 & 2033
- Table 19: Morocco Africa Glass Bottles & Containers Industry Revenue (million) Forecast, by Application 2020 & 2033
- Table 20: Morocco Africa Glass Bottles & Containers Industry Volume (Billion) Forecast, by Application 2020 & 2033
- Table 21: Ghana Africa Glass Bottles & Containers Industry Revenue (million) Forecast, by Application 2020 & 2033
- Table 22: Ghana Africa Glass Bottles & Containers Industry Volume (Billion) Forecast, by Application 2020 & 2033
- Table 23: Algeria Africa Glass Bottles & Containers Industry Revenue (million) Forecast, by Application 2020 & 2033
- Table 24: Algeria Africa Glass Bottles & Containers Industry Volume (Billion) Forecast, by Application 2020 & 2033
- Table 25: Tanzania Africa Glass Bottles & Containers Industry Revenue (million) Forecast, by Application 2020 & 2033
- Table 26: Tanzania Africa Glass Bottles & Containers Industry Volume (Billion) Forecast, by Application 2020 & 2033
- Table 27: Ivory Coast Africa Glass Bottles & Containers Industry Revenue (million) Forecast, by Application 2020 & 2033
- Table 28: Ivory Coast Africa Glass Bottles & Containers Industry Volume (Billion) Forecast, by Application 2020 & 2033
Frequently Asked Questions
1. What is the projected Compound Annual Growth Rate (CAGR) of the Africa Glass Bottles & Containers Industry?
The projected CAGR is approximately 4.5%.
2. Which companies are prominent players in the Africa Glass Bottles & Containers Industry?
Key companies in the market include Frigoglass SAIC, Glamosa glass (Pty) ltd, Schott AG, Arab Pharmaceutical Glass Co, Consol Glass (Pty) Ltd, Middle East Glass Manufacturing Company SAE (MEG), Kandil Glass, Bonpak (Pty) Ltd, Nurrin Pharmalab (Pty) Ltd*List Not Exhaustive, National Company for Glass and Crystal (SAE), United Glass Company.
3. What are the main segments of the Africa Glass Bottles & Containers Industry?
The market segments include End-user Industry.
4. Can you provide details about the market size?
The market size is estimated to be USD 16000 million as of 2022.
5. What are some drivers contributing to market growth?
Growing Disposable Income and Integration of Glass Bottles and Containers in Premium Packaging; Shift Toward Glass Bottles and Containers due to Stringent Regulations.
6. What are the notable trends driving market growth?
Beverages is expected to Hold Major Market Share.
7. Are there any restraints impacting market growth?
Stringent Government Rules and Regulations.
8. Can you provide examples of recent developments in the market?
November 2022: At its Nigel manufacturing site in Gauteng, South Africa, Ardagh Glass Packaging Africa revealed plans to invest in a third furnace. Following the recently completed Nigel 2 (N2) extension, investing in a third furnace (N3) would boost the facility's capacity even more. The extension is anticipated to be completed in late 2023 and would take advantage of Ardagh Group's technological expertise and global sourcing.
9. What pricing options are available for accessing the report?
Pricing options include single-user, multi-user, and enterprise licenses priced at USD 3800, USD 4500, and USD 5800 respectively.
10. Is the market size provided in terms of value or volume?
The market size is provided in terms of value, measured in million and volume, measured in Billion.
11. Are there any specific market keywords associated with the report?
Yes, the market keyword associated with the report is "Africa Glass Bottles & Containers Industry," which aids in identifying and referencing the specific market segment covered.
12. How do I determine which pricing option suits my needs best?
The pricing options vary based on user requirements and access needs. Individual users may opt for single-user licenses, while businesses requiring broader access may choose multi-user or enterprise licenses for cost-effective access to the report.
13. Are there any additional resources or data provided in the Africa Glass Bottles & Containers Industry report?
While the report offers comprehensive insights, it's advisable to review the specific contents or supplementary materials provided to ascertain if additional resources or data are available.
14. How can I stay updated on further developments or reports in the Africa Glass Bottles & Containers Industry?
To stay informed about further developments, trends, and reports in the Africa Glass Bottles & Containers Industry, consider subscribing to industry newsletters, following relevant companies and organizations, or regularly checking reputable industry news sources and publications.
Methodology
Step 1 - Identification of Relevant Samples Size from Population Database


Step 2 - Approaches for Defining Global Market Size (Value, Volume* & Price*)

Note*: In applicable scenarios
Step 3 - Data Sources
Primary Research
- Web Analytics
- Survey Reports
- Research Institute
- Latest Research Reports
- Opinion Leaders
Secondary Research
- Annual Reports
- White Paper
- Latest Press Release
- Industry Association
- Paid Database
- Investor Presentations

Step 4 - Data Triangulation
Involves using different sources of information in order to increase the validity of a study
These sources are likely to be stakeholders in a program - participants, other researchers, program staff, other community members, and so on.
Then we put all data in single framework & apply various statistical tools to find out the dynamic on the market.
During the analysis stage, feedback from the stakeholder groups would be compared to determine areas of agreement as well as areas of divergence