
Key Insights
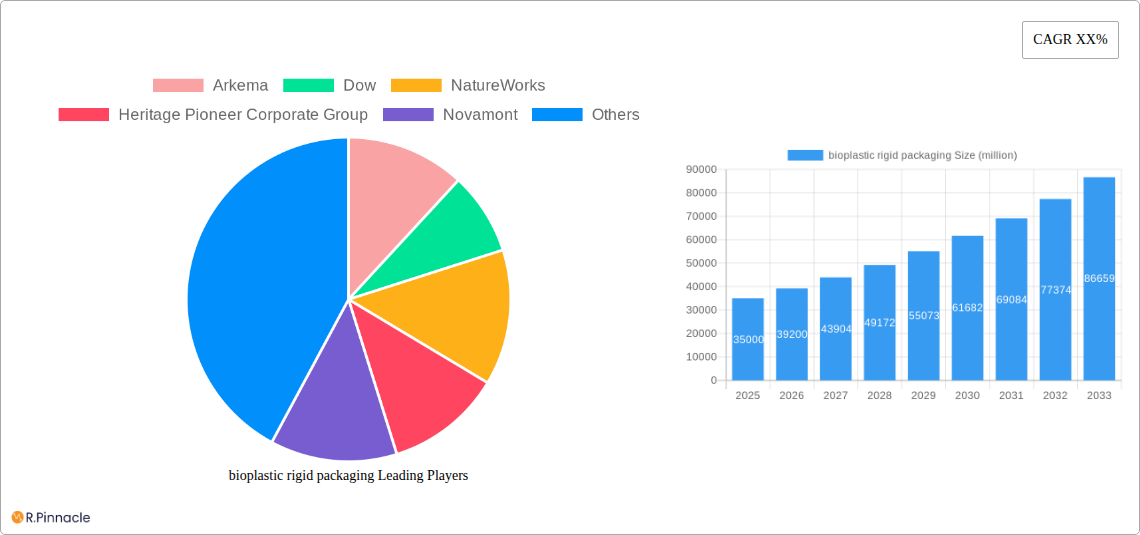
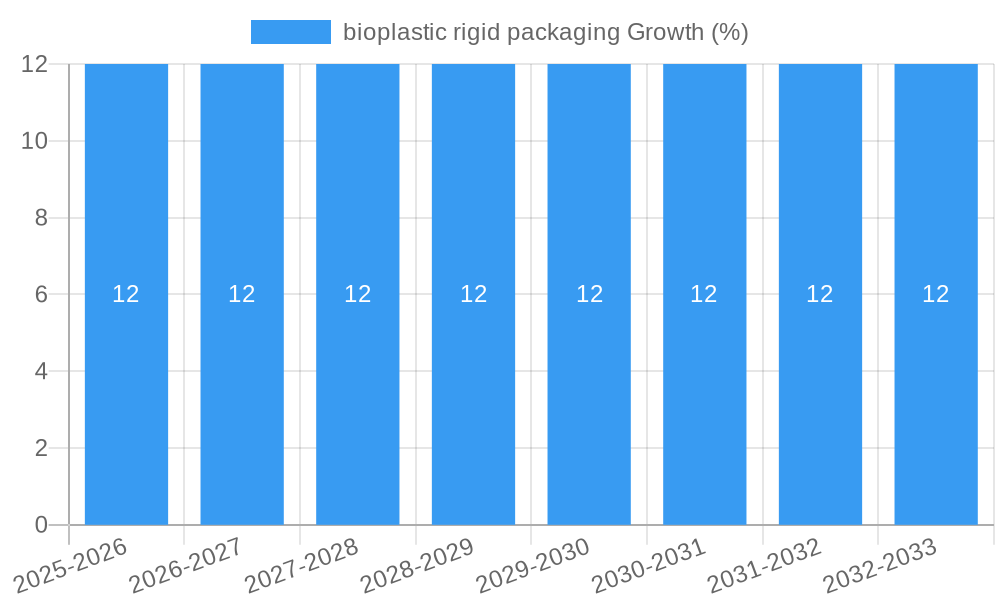
The bioplastic rigid packaging market is poised for significant expansion, projected to reach an estimated market size of approximately $35,000 million by 2025, driven by a compelling compound annual growth rate (CAGR) of around 12% through 2033. This robust growth is underpinned by a confluence of factors, with increasing environmental consciousness among consumers and stringent government regulations pushing for sustainable alternatives to conventional petroleum-based plastics being the primary catalysts. The demand for bio-PET and bio-PP, key segments within this market, is escalating as industries seek packaging solutions that offer a reduced carbon footprint and enhanced biodegradability. The food and beverage sector, a major consumer of rigid packaging, is leading this adoption, followed closely by kitchen utensils and the electronics industries, all of which are actively exploring greener material options. Innovations in biopolymer production and processing technologies are further fueling this growth, making bioplastics more cost-competitive and functionally equivalent to traditional plastics.
However, the market faces certain restraints that could temper its full potential. High initial production costs compared to conventional plastics, challenges in scaling up production to meet ever-increasing demand, and the need for robust recycling and composting infrastructure are significant hurdles. Fluctuations in the availability and cost of raw materials for bioplastics, such as agricultural feedstocks, can also introduce volatility. Despite these challenges, the overarching trend towards a circular economy and the growing awareness of plastic pollution are creating an undeniable momentum. Key players like Arkema, Dow, NatureWorks, and Novamont are investing heavily in research and development, forging strategic partnerships, and expanding their production capacities to capitalize on this burgeoning market, aiming to overcome existing limitations and solidify their positions in the evolving bioplastic rigid packaging landscape.
Bioplastic Rigid Packaging Market Report: Unlocking Sustainable Solutions for a Circular Economy
This comprehensive report offers an in-depth analysis of the bioplastic rigid packaging market, a rapidly evolving sector critical for achieving sustainability goals across diverse industries. We delve into market structure, dynamics, dominant regions, product innovations, and future outlook, providing actionable insights for stakeholders. The study leverages high-ranking keywords such as "sustainable packaging," "bio-based materials," "eco-friendly packaging solutions," and "circular economy packaging" to ensure maximum search visibility for industry professionals. This report is meticulously crafted for immediate use without any further modification.
bioplastic rigid packaging Market Structure & Innovation Trends
The bioplastic rigid packaging market exhibits a moderately concentrated structure, with key players like Arkema, Dow, NatureWorks, Heritage Pioneer Corporate Group, Novamont, Metabolix, Reverdia, Solvay, Bioamber, and Corbion holding significant market share. Innovation is a primary driver, fueled by relentless research and development in bio-based polymers and advanced manufacturing techniques. Regulatory frameworks, such as government mandates for recycled content and plastic reduction, are increasingly shaping market entry and product development. Product substitutes, particularly conventional plastics, continue to pose a competitive challenge, but the growing consumer demand for sustainable alternatives is shifting the landscape. End-user demographics are broadening, encompassing environmentally conscious consumers and businesses seeking to reduce their ecological footprint. Mergers and acquisitions (M&A) activities are on the rise as established companies aim to expand their portfolios and gain access to proprietary technologies. For instance, M&A deal values are estimated to reach xx million by 2025, indicating robust consolidation. The market share of bioplastic rigid packaging is projected to reach xx% by 2033, highlighting its growing importance.
bioplastic rigid packaging Market Dynamics & Trends
The bioplastic rigid packaging market is experiencing robust growth, propelled by a confluence of powerful market growth drivers. Mounting environmental concerns and the imperative for a circular economy are compelling industries to transition away from fossil fuel-based plastics. Government regulations and corporate sustainability commitments are further accelerating this shift. Technological disruptions, including advancements in polymerization processes and bio-based feedstock utilization, are enhancing the performance, cost-effectiveness, and versatility of bioplastic rigid packaging. Consumer preferences are increasingly leaning towards eco-friendly products, with a growing willingness to pay a premium for sustainable packaging. This trend is particularly evident in the Food & Beverages and Electronics Industries segments. Competitive dynamics are intensifying, with both established chemical giants and agile startups vying for market dominance. The market penetration of bioplastic rigid packaging is projected to reach xx% by 2033, signifying a substantial uptake across various applications. The Compound Annual Growth Rate (CAGR) is estimated to be xx% during the forecast period of 2025–2033, underscoring a healthy expansion trajectory. Innovations in material science are leading to the development of bioplastics with improved barrier properties, durability, and biodegradability, making them suitable for a wider range of rigid packaging applications. The increasing availability of sustainable feedstocks, such as agricultural waste and algae, is also contributing to the cost competitiveness and scalability of bioplastic production.
Dominant Regions & Segments in bioplastic rigid packaging
The bioplastic rigid packaging market is witnessing significant expansion, with the Asia Pacific region emerging as the dominant force, driven by robust economic growth, expanding manufacturing capabilities, and increasing government initiatives promoting sustainable practices. Countries like China and India are at the forefront, with substantial investments in bioplastic production and adoption.
Key Drivers of Dominance in the Asia Pacific:
- Economic Policies: Favorable government policies and incentives aimed at fostering a circular economy and reducing plastic waste.
- Infrastructure Development: Significant investments in manufacturing infrastructure and R&D facilities dedicated to bioplastics.
- Growing Consumer Awareness: Rising consumer consciousness regarding environmental issues, leading to increased demand for eco-friendly packaging.
- Large Manufacturing Hubs: Presence of major manufacturing hubs for industries heavily reliant on packaging, such as Food & Beverages and Electronics Industries.
Within this dynamic landscape, the Food & Beverages segment is exhibiting the strongest demand for bioplastic rigid packaging. This is attributed to stringent regulations regarding food safety and shelf-life, coupled with consumer preference for sustainable packaging for consumables. The increasing adoption of bio-PET and bio-PP in this segment, offering comparable performance to conventional plastics, further fuels its growth.
Segment Dominance Analysis:
- Application: Food & Beverages: This segment is projected to hold the largest market share, driven by the demand for sustainable and safe packaging solutions for a wide array of food products, including dairy, baked goods, ready-to-eat meals, and beverages. Key players like Amcor and Berry Plastics are actively developing and supplying innovative bioplastic rigid packaging for this sector.
- Types: Bio-PET and Bio-PP: Bio-PET, with its excellent clarity and barrier properties, is a preferred choice for beverage bottles and food containers. Bio-PP, known for its rigidity and chemical resistance, is gaining traction in applications requiring higher durability.
The Electronics Industries also present a substantial growth opportunity, with a rising demand for sustainable packaging to protect sensitive electronic components during transit and storage. The push for e-waste reduction and eco-friendly supply chains is driving the adoption of bioplastic rigid packaging in this sector. The Other application segment, encompassing cosmetics, personal care, and industrial goods, is also showing steady growth as businesses increasingly prioritize sustainability across their product lines.
bioplastic rigid packaging Product Innovations
Product innovations in the bioplastic rigid packaging market are central to its expansion. Companies are actively developing and launching advanced bioplastic resins, such as improved grades of bio-PET and bio-PP, offering enhanced performance characteristics like superior barrier properties, increased heat resistance, and greater durability. These innovations enable bioplastics to compete directly with traditional petroleum-based rigid packaging in demanding applications. The focus is on creating materials that are fully biodegradable or compostable, aligning with circular economy principles. These advancements are creating significant competitive advantages by addressing performance gaps and meeting the evolving sustainability requirements of end-users across the Food & Beverages, Kitchen Utensils, and Electronics Industries.
Report Scope & Segmentation Analysis
This report meticulously examines the bioplastic rigid packaging market across key segmentation parameters.
- Application: Food & Beverages: This segment, projected to reach a market size of xx million by 2033, is the primary growth engine, driven by consumer demand for sustainable food packaging solutions. Key market players are focusing on developing specialized bioplastic grades for this sector.
- Application: Kitchen Utensils: While currently a smaller segment, this application is expected to witness steady growth as eco-conscious consumers opt for sustainable alternatives for everyday kitchenware.
- Application: Electronics Industries: This segment is poised for significant expansion, fueled by the industry's commitment to reducing its environmental footprint and the need for protective, sustainable packaging for electronic devices.
- Application: Other: This broad category encompasses diverse applications such as personal care, cosmetics, and industrial goods, where sustainability initiatives are increasingly influencing packaging choices.
- Types: Bio-PET: This versatile bioplastic is projected to dominate the market due to its excellent clarity and barrier properties, making it ideal for beverage bottles, food containers, and personal care packaging.
- Types: Bio-PP: Known for its rigidity and chemical resistance, Bio-PP is gaining traction in applications requiring higher durability and resistance to temperature fluctuations.
Key Drivers of bioplastic rigid packaging Growth
The growth of the bioplastic rigid packaging market is propelled by a multifaceted array of factors. Environmental regulations, such as bans on single-use plastics and mandates for recycled content, are creating a strong push towards sustainable alternatives. Consumer awareness and demand for eco-friendly products are powerful pull factors, influencing purchasing decisions and pressuring brands to adopt greener packaging. Technological advancements in bioplastic production, leading to improved material properties and cost-competitiveness, are making bioplastics a viable option for a wider range of applications. Furthermore, corporate sustainability goals and the pursuit of a circular economy are driving significant investment and innovation within the industry.
Challenges in the bioplastic rigid packaging Sector
Despite its promising growth, the bioplastic rigid packaging sector faces several significant challenges. High production costs compared to conventional plastics remain a primary barrier, although this is gradually diminishing with technological advancements. Limited availability and supply chain complexities for certain bio-based feedstocks can also pose challenges to scalability. Regulatory inconsistencies across different regions can create complexities for global manufacturers. Furthermore, the need for consumer education regarding proper disposal and composting of bioplastics is crucial to ensure their effectiveness in a circular economy. Competitive pressures from established petrochemical-based plastics continue to exert influence on market penetration.
Emerging Opportunities in bioplastic rigid packaging
The bioplastic rigid packaging market is ripe with emerging opportunities. The development of advanced biodegradable and compostable bioplastics with enhanced performance characteristics presents significant potential. Expansion into new application areas, such as medical devices and durable goods, offers avenues for growth. The growing focus on developing regionalized bio-based feedstock supply chains can enhance sustainability and reduce logistical costs. Furthermore, the increasing integration of bioplastics into existing recycling and composting infrastructure will be crucial for their long-term success.
Leading Players in the bioplastic rigid packaging Market
- Arkema
- Dow
- NatureWorks
- Heritage Pioneer Corporate Group
- Novamont
- Metabolix
- Reverdia
- Solvay
- Bioamber
- Corbion
- Amcor
- Berry Plastics
Key Developments in bioplastic rigid packaging Industry
- 2023: NatureWorks launched a new generation of its Ingeo biopolymer, offering enhanced clarity and processability for rigid packaging applications.
- 2023: Arkema expanded its bio-based polymer portfolio, introducing new grades of Rilsan® Polyamide 11 for demanding packaging solutions.
- 2024: Amcor announced significant investments in expanding its capacity for producing high-performance bioplastic rigid packaging.
- 2024: Dow unveiled new bio-based solutions for rigid packaging, focusing on recyclability and reduced carbon footprint.
- 2024: Novamont introduced innovative compostable bioplastic formulations tailored for rigid food containers.
- 2025: Heritage Pioneer Corporate Group is projected to complete a new bioplastic production facility, increasing market supply.
Future Outlook for bioplastic rigid packaging Market
The future outlook for the bioplastic rigid packaging market is exceptionally positive. Continued innovation in material science, coupled with increasing global demand for sustainable solutions, will drive significant market expansion. Advancements in bio-based feedstocks and more efficient production processes will further enhance cost-competitiveness and scalability. Strategic collaborations between material producers, packaging converters, and brand owners will be crucial in accelerating adoption. The growing emphasis on a circular economy and government initiatives supporting sustainable packaging will create a fertile ground for growth, positioning bioplastic rigid packaging as a cornerstone of future packaging solutions. The market is poised to witness sustained growth, driven by a commitment to environmental responsibility and evolving consumer expectations.
bioplastic rigid packaging Segmentation
-
1. Application
- 1.1. Food & Beverages
- 1.2. Kitchen Utensils
- 1.3. Electronics Industries
- 1.4. Other
-
2. Types
- 2.1. Bio-PET
- 2.2. Bio-PP
bioplastic rigid packaging Segmentation By Geography
-
1. North America
- 1.1. United States
- 1.2. Canada
- 1.3. Mexico
-
2. South America
- 2.1. Brazil
- 2.2. Argentina
- 2.3. Rest of South America
-
3. Europe
- 3.1. United Kingdom
- 3.2. Germany
- 3.3. France
- 3.4. Italy
- 3.5. Spain
- 3.6. Russia
- 3.7. Benelux
- 3.8. Nordics
- 3.9. Rest of Europe
-
4. Middle East & Africa
- 4.1. Turkey
- 4.2. Israel
- 4.3. GCC
- 4.4. North Africa
- 4.5. South Africa
- 4.6. Rest of Middle East & Africa
-
5. Asia Pacific
- 5.1. China
- 5.2. India
- 5.3. Japan
- 5.4. South Korea
- 5.5. ASEAN
- 5.6. Oceania
- 5.7. Rest of Asia Pacific

bioplastic rigid packaging REPORT HIGHLIGHTS
| Aspects | Details |
|---|---|
| Study Period | 2019-2033 |
| Base Year | 2024 |
| Estimated Year | 2025 |
| Forecast Period | 2025-2033 |
| Historical Period | 2019-2024 |
| Growth Rate | CAGR of XX% from 2019-2033 |
| Segmentation |
|
Table of Contents
- 1. Introduction
- 1.1. Research Scope
- 1.2. Market Segmentation
- 1.3. Research Methodology
- 1.4. Definitions and Assumptions
- 2. Executive Summary
- 2.1. Introduction
- 3. Market Dynamics
- 3.1. Introduction
- 3.2. Market Drivers
- 3.3. Market Restrains
- 3.4. Market Trends
- 4. Market Factor Analysis
- 4.1. Porters Five Forces
- 4.2. Supply/Value Chain
- 4.3. PESTEL analysis
- 4.4. Market Entropy
- 4.5. Patent/Trademark Analysis
- 5. Global bioplastic rigid packaging Analysis, Insights and Forecast, 2019-2031
- 5.1. Market Analysis, Insights and Forecast - by Application
- 5.1.1. Food & Beverages
- 5.1.2. Kitchen Utensils
- 5.1.3. Electronics Industries
- 5.1.4. Other
- 5.2. Market Analysis, Insights and Forecast - by Types
- 5.2.1. Bio-PET
- 5.2.2. Bio-PP
- 5.3. Market Analysis, Insights and Forecast - by Region
- 5.3.1. North America
- 5.3.2. South America
- 5.3.3. Europe
- 5.3.4. Middle East & Africa
- 5.3.5. Asia Pacific
- 5.1. Market Analysis, Insights and Forecast - by Application
- 6. North America bioplastic rigid packaging Analysis, Insights and Forecast, 2019-2031
- 6.1. Market Analysis, Insights and Forecast - by Application
- 6.1.1. Food & Beverages
- 6.1.2. Kitchen Utensils
- 6.1.3. Electronics Industries
- 6.1.4. Other
- 6.2. Market Analysis, Insights and Forecast - by Types
- 6.2.1. Bio-PET
- 6.2.2. Bio-PP
- 6.1. Market Analysis, Insights and Forecast - by Application
- 7. South America bioplastic rigid packaging Analysis, Insights and Forecast, 2019-2031
- 7.1. Market Analysis, Insights and Forecast - by Application
- 7.1.1. Food & Beverages
- 7.1.2. Kitchen Utensils
- 7.1.3. Electronics Industries
- 7.1.4. Other
- 7.2. Market Analysis, Insights and Forecast - by Types
- 7.2.1. Bio-PET
- 7.2.2. Bio-PP
- 7.1. Market Analysis, Insights and Forecast - by Application
- 8. Europe bioplastic rigid packaging Analysis, Insights and Forecast, 2019-2031
- 8.1. Market Analysis, Insights and Forecast - by Application
- 8.1.1. Food & Beverages
- 8.1.2. Kitchen Utensils
- 8.1.3. Electronics Industries
- 8.1.4. Other
- 8.2. Market Analysis, Insights and Forecast - by Types
- 8.2.1. Bio-PET
- 8.2.2. Bio-PP
- 8.1. Market Analysis, Insights and Forecast - by Application
- 9. Middle East & Africa bioplastic rigid packaging Analysis, Insights and Forecast, 2019-2031
- 9.1. Market Analysis, Insights and Forecast - by Application
- 9.1.1. Food & Beverages
- 9.1.2. Kitchen Utensils
- 9.1.3. Electronics Industries
- 9.1.4. Other
- 9.2. Market Analysis, Insights and Forecast - by Types
- 9.2.1. Bio-PET
- 9.2.2. Bio-PP
- 9.1. Market Analysis, Insights and Forecast - by Application
- 10. Asia Pacific bioplastic rigid packaging Analysis, Insights and Forecast, 2019-2031
- 10.1. Market Analysis, Insights and Forecast - by Application
- 10.1.1. Food & Beverages
- 10.1.2. Kitchen Utensils
- 10.1.3. Electronics Industries
- 10.1.4. Other
- 10.2. Market Analysis, Insights and Forecast - by Types
- 10.2.1. Bio-PET
- 10.2.2. Bio-PP
- 10.1. Market Analysis, Insights and Forecast - by Application
- 11. Competitive Analysis
- 11.1. Global Market Share Analysis 2024
- 11.2. Company Profiles
- 11.2.1 Arkema
- 11.2.1.1. Overview
- 11.2.1.2. Products
- 11.2.1.3. SWOT Analysis
- 11.2.1.4. Recent Developments
- 11.2.1.5. Financials (Based on Availability)
- 11.2.2 Dow
- 11.2.2.1. Overview
- 11.2.2.2. Products
- 11.2.2.3. SWOT Analysis
- 11.2.2.4. Recent Developments
- 11.2.2.5. Financials (Based on Availability)
- 11.2.3 NatureWorks
- 11.2.3.1. Overview
- 11.2.3.2. Products
- 11.2.3.3. SWOT Analysis
- 11.2.3.4. Recent Developments
- 11.2.3.5. Financials (Based on Availability)
- 11.2.4 Heritage Pioneer Corporate Group
- 11.2.4.1. Overview
- 11.2.4.2. Products
- 11.2.4.3. SWOT Analysis
- 11.2.4.4. Recent Developments
- 11.2.4.5. Financials (Based on Availability)
- 11.2.5 Novamont
- 11.2.5.1. Overview
- 11.2.5.2. Products
- 11.2.5.3. SWOT Analysis
- 11.2.5.4. Recent Developments
- 11.2.5.5. Financials (Based on Availability)
- 11.2.6 Metabolix
- 11.2.6.1. Overview
- 11.2.6.2. Products
- 11.2.6.3. SWOT Analysis
- 11.2.6.4. Recent Developments
- 11.2.6.5. Financials (Based on Availability)
- 11.2.7 Reverdia
- 11.2.7.1. Overview
- 11.2.7.2. Products
- 11.2.7.3. SWOT Analysis
- 11.2.7.4. Recent Developments
- 11.2.7.5. Financials (Based on Availability)
- 11.2.8 Solvay
- 11.2.8.1. Overview
- 11.2.8.2. Products
- 11.2.8.3. SWOT Analysis
- 11.2.8.4. Recent Developments
- 11.2.8.5. Financials (Based on Availability)
- 11.2.9 Bioamber
- 11.2.9.1. Overview
- 11.2.9.2. Products
- 11.2.9.3. SWOT Analysis
- 11.2.9.4. Recent Developments
- 11.2.9.5. Financials (Based on Availability)
- 11.2.10 Corbion
- 11.2.10.1. Overview
- 11.2.10.2. Products
- 11.2.10.3. SWOT Analysis
- 11.2.10.4. Recent Developments
- 11.2.10.5. Financials (Based on Availability)
- 11.2.11 Amcor
- 11.2.11.1. Overview
- 11.2.11.2. Products
- 11.2.11.3. SWOT Analysis
- 11.2.11.4. Recent Developments
- 11.2.11.5. Financials (Based on Availability)
- 11.2.12 Berry Plastics
- 11.2.12.1. Overview
- 11.2.12.2. Products
- 11.2.12.3. SWOT Analysis
- 11.2.12.4. Recent Developments
- 11.2.12.5. Financials (Based on Availability)
- 11.2.1 Arkema
List of Figures
- Figure 1: Global bioplastic rigid packaging Revenue Breakdown (million, %) by Region 2024 & 2032
- Figure 2: Global bioplastic rigid packaging Volume Breakdown (K, %) by Region 2024 & 2032
- Figure 3: North America bioplastic rigid packaging Revenue (million), by Application 2024 & 2032
- Figure 4: North America bioplastic rigid packaging Volume (K), by Application 2024 & 2032
- Figure 5: North America bioplastic rigid packaging Revenue Share (%), by Application 2024 & 2032
- Figure 6: North America bioplastic rigid packaging Volume Share (%), by Application 2024 & 2032
- Figure 7: North America bioplastic rigid packaging Revenue (million), by Types 2024 & 2032
- Figure 8: North America bioplastic rigid packaging Volume (K), by Types 2024 & 2032
- Figure 9: North America bioplastic rigid packaging Revenue Share (%), by Types 2024 & 2032
- Figure 10: North America bioplastic rigid packaging Volume Share (%), by Types 2024 & 2032
- Figure 11: North America bioplastic rigid packaging Revenue (million), by Country 2024 & 2032
- Figure 12: North America bioplastic rigid packaging Volume (K), by Country 2024 & 2032
- Figure 13: North America bioplastic rigid packaging Revenue Share (%), by Country 2024 & 2032
- Figure 14: North America bioplastic rigid packaging Volume Share (%), by Country 2024 & 2032
- Figure 15: South America bioplastic rigid packaging Revenue (million), by Application 2024 & 2032
- Figure 16: South America bioplastic rigid packaging Volume (K), by Application 2024 & 2032
- Figure 17: South America bioplastic rigid packaging Revenue Share (%), by Application 2024 & 2032
- Figure 18: South America bioplastic rigid packaging Volume Share (%), by Application 2024 & 2032
- Figure 19: South America bioplastic rigid packaging Revenue (million), by Types 2024 & 2032
- Figure 20: South America bioplastic rigid packaging Volume (K), by Types 2024 & 2032
- Figure 21: South America bioplastic rigid packaging Revenue Share (%), by Types 2024 & 2032
- Figure 22: South America bioplastic rigid packaging Volume Share (%), by Types 2024 & 2032
- Figure 23: South America bioplastic rigid packaging Revenue (million), by Country 2024 & 2032
- Figure 24: South America bioplastic rigid packaging Volume (K), by Country 2024 & 2032
- Figure 25: South America bioplastic rigid packaging Revenue Share (%), by Country 2024 & 2032
- Figure 26: South America bioplastic rigid packaging Volume Share (%), by Country 2024 & 2032
- Figure 27: Europe bioplastic rigid packaging Revenue (million), by Application 2024 & 2032
- Figure 28: Europe bioplastic rigid packaging Volume (K), by Application 2024 & 2032
- Figure 29: Europe bioplastic rigid packaging Revenue Share (%), by Application 2024 & 2032
- Figure 30: Europe bioplastic rigid packaging Volume Share (%), by Application 2024 & 2032
- Figure 31: Europe bioplastic rigid packaging Revenue (million), by Types 2024 & 2032
- Figure 32: Europe bioplastic rigid packaging Volume (K), by Types 2024 & 2032
- Figure 33: Europe bioplastic rigid packaging Revenue Share (%), by Types 2024 & 2032
- Figure 34: Europe bioplastic rigid packaging Volume Share (%), by Types 2024 & 2032
- Figure 35: Europe bioplastic rigid packaging Revenue (million), by Country 2024 & 2032
- Figure 36: Europe bioplastic rigid packaging Volume (K), by Country 2024 & 2032
- Figure 37: Europe bioplastic rigid packaging Revenue Share (%), by Country 2024 & 2032
- Figure 38: Europe bioplastic rigid packaging Volume Share (%), by Country 2024 & 2032
- Figure 39: Middle East & Africa bioplastic rigid packaging Revenue (million), by Application 2024 & 2032
- Figure 40: Middle East & Africa bioplastic rigid packaging Volume (K), by Application 2024 & 2032
- Figure 41: Middle East & Africa bioplastic rigid packaging Revenue Share (%), by Application 2024 & 2032
- Figure 42: Middle East & Africa bioplastic rigid packaging Volume Share (%), by Application 2024 & 2032
- Figure 43: Middle East & Africa bioplastic rigid packaging Revenue (million), by Types 2024 & 2032
- Figure 44: Middle East & Africa bioplastic rigid packaging Volume (K), by Types 2024 & 2032
- Figure 45: Middle East & Africa bioplastic rigid packaging Revenue Share (%), by Types 2024 & 2032
- Figure 46: Middle East & Africa bioplastic rigid packaging Volume Share (%), by Types 2024 & 2032
- Figure 47: Middle East & Africa bioplastic rigid packaging Revenue (million), by Country 2024 & 2032
- Figure 48: Middle East & Africa bioplastic rigid packaging Volume (K), by Country 2024 & 2032
- Figure 49: Middle East & Africa bioplastic rigid packaging Revenue Share (%), by Country 2024 & 2032
- Figure 50: Middle East & Africa bioplastic rigid packaging Volume Share (%), by Country 2024 & 2032
- Figure 51: Asia Pacific bioplastic rigid packaging Revenue (million), by Application 2024 & 2032
- Figure 52: Asia Pacific bioplastic rigid packaging Volume (K), by Application 2024 & 2032
- Figure 53: Asia Pacific bioplastic rigid packaging Revenue Share (%), by Application 2024 & 2032
- Figure 54: Asia Pacific bioplastic rigid packaging Volume Share (%), by Application 2024 & 2032
- Figure 55: Asia Pacific bioplastic rigid packaging Revenue (million), by Types 2024 & 2032
- Figure 56: Asia Pacific bioplastic rigid packaging Volume (K), by Types 2024 & 2032
- Figure 57: Asia Pacific bioplastic rigid packaging Revenue Share (%), by Types 2024 & 2032
- Figure 58: Asia Pacific bioplastic rigid packaging Volume Share (%), by Types 2024 & 2032
- Figure 59: Asia Pacific bioplastic rigid packaging Revenue (million), by Country 2024 & 2032
- Figure 60: Asia Pacific bioplastic rigid packaging Volume (K), by Country 2024 & 2032
- Figure 61: Asia Pacific bioplastic rigid packaging Revenue Share (%), by Country 2024 & 2032
- Figure 62: Asia Pacific bioplastic rigid packaging Volume Share (%), by Country 2024 & 2032
List of Tables
- Table 1: Global bioplastic rigid packaging Revenue million Forecast, by Region 2019 & 2032
- Table 2: Global bioplastic rigid packaging Volume K Forecast, by Region 2019 & 2032
- Table 3: Global bioplastic rigid packaging Revenue million Forecast, by Application 2019 & 2032
- Table 4: Global bioplastic rigid packaging Volume K Forecast, by Application 2019 & 2032
- Table 5: Global bioplastic rigid packaging Revenue million Forecast, by Types 2019 & 2032
- Table 6: Global bioplastic rigid packaging Volume K Forecast, by Types 2019 & 2032
- Table 7: Global bioplastic rigid packaging Revenue million Forecast, by Region 2019 & 2032
- Table 8: Global bioplastic rigid packaging Volume K Forecast, by Region 2019 & 2032
- Table 9: Global bioplastic rigid packaging Revenue million Forecast, by Application 2019 & 2032
- Table 10: Global bioplastic rigid packaging Volume K Forecast, by Application 2019 & 2032
- Table 11: Global bioplastic rigid packaging Revenue million Forecast, by Types 2019 & 2032
- Table 12: Global bioplastic rigid packaging Volume K Forecast, by Types 2019 & 2032
- Table 13: Global bioplastic rigid packaging Revenue million Forecast, by Country 2019 & 2032
- Table 14: Global bioplastic rigid packaging Volume K Forecast, by Country 2019 & 2032
- Table 15: United States bioplastic rigid packaging Revenue (million) Forecast, by Application 2019 & 2032
- Table 16: United States bioplastic rigid packaging Volume (K) Forecast, by Application 2019 & 2032
- Table 17: Canada bioplastic rigid packaging Revenue (million) Forecast, by Application 2019 & 2032
- Table 18: Canada bioplastic rigid packaging Volume (K) Forecast, by Application 2019 & 2032
- Table 19: Mexico bioplastic rigid packaging Revenue (million) Forecast, by Application 2019 & 2032
- Table 20: Mexico bioplastic rigid packaging Volume (K) Forecast, by Application 2019 & 2032
- Table 21: Global bioplastic rigid packaging Revenue million Forecast, by Application 2019 & 2032
- Table 22: Global bioplastic rigid packaging Volume K Forecast, by Application 2019 & 2032
- Table 23: Global bioplastic rigid packaging Revenue million Forecast, by Types 2019 & 2032
- Table 24: Global bioplastic rigid packaging Volume K Forecast, by Types 2019 & 2032
- Table 25: Global bioplastic rigid packaging Revenue million Forecast, by Country 2019 & 2032
- Table 26: Global bioplastic rigid packaging Volume K Forecast, by Country 2019 & 2032
- Table 27: Brazil bioplastic rigid packaging Revenue (million) Forecast, by Application 2019 & 2032
- Table 28: Brazil bioplastic rigid packaging Volume (K) Forecast, by Application 2019 & 2032
- Table 29: Argentina bioplastic rigid packaging Revenue (million) Forecast, by Application 2019 & 2032
- Table 30: Argentina bioplastic rigid packaging Volume (K) Forecast, by Application 2019 & 2032
- Table 31: Rest of South America bioplastic rigid packaging Revenue (million) Forecast, by Application 2019 & 2032
- Table 32: Rest of South America bioplastic rigid packaging Volume (K) Forecast, by Application 2019 & 2032
- Table 33: Global bioplastic rigid packaging Revenue million Forecast, by Application 2019 & 2032
- Table 34: Global bioplastic rigid packaging Volume K Forecast, by Application 2019 & 2032
- Table 35: Global bioplastic rigid packaging Revenue million Forecast, by Types 2019 & 2032
- Table 36: Global bioplastic rigid packaging Volume K Forecast, by Types 2019 & 2032
- Table 37: Global bioplastic rigid packaging Revenue million Forecast, by Country 2019 & 2032
- Table 38: Global bioplastic rigid packaging Volume K Forecast, by Country 2019 & 2032
- Table 39: United Kingdom bioplastic rigid packaging Revenue (million) Forecast, by Application 2019 & 2032
- Table 40: United Kingdom bioplastic rigid packaging Volume (K) Forecast, by Application 2019 & 2032
- Table 41: Germany bioplastic rigid packaging Revenue (million) Forecast, by Application 2019 & 2032
- Table 42: Germany bioplastic rigid packaging Volume (K) Forecast, by Application 2019 & 2032
- Table 43: France bioplastic rigid packaging Revenue (million) Forecast, by Application 2019 & 2032
- Table 44: France bioplastic rigid packaging Volume (K) Forecast, by Application 2019 & 2032
- Table 45: Italy bioplastic rigid packaging Revenue (million) Forecast, by Application 2019 & 2032
- Table 46: Italy bioplastic rigid packaging Volume (K) Forecast, by Application 2019 & 2032
- Table 47: Spain bioplastic rigid packaging Revenue (million) Forecast, by Application 2019 & 2032
- Table 48: Spain bioplastic rigid packaging Volume (K) Forecast, by Application 2019 & 2032
- Table 49: Russia bioplastic rigid packaging Revenue (million) Forecast, by Application 2019 & 2032
- Table 50: Russia bioplastic rigid packaging Volume (K) Forecast, by Application 2019 & 2032
- Table 51: Benelux bioplastic rigid packaging Revenue (million) Forecast, by Application 2019 & 2032
- Table 52: Benelux bioplastic rigid packaging Volume (K) Forecast, by Application 2019 & 2032
- Table 53: Nordics bioplastic rigid packaging Revenue (million) Forecast, by Application 2019 & 2032
- Table 54: Nordics bioplastic rigid packaging Volume (K) Forecast, by Application 2019 & 2032
- Table 55: Rest of Europe bioplastic rigid packaging Revenue (million) Forecast, by Application 2019 & 2032
- Table 56: Rest of Europe bioplastic rigid packaging Volume (K) Forecast, by Application 2019 & 2032
- Table 57: Global bioplastic rigid packaging Revenue million Forecast, by Application 2019 & 2032
- Table 58: Global bioplastic rigid packaging Volume K Forecast, by Application 2019 & 2032
- Table 59: Global bioplastic rigid packaging Revenue million Forecast, by Types 2019 & 2032
- Table 60: Global bioplastic rigid packaging Volume K Forecast, by Types 2019 & 2032
- Table 61: Global bioplastic rigid packaging Revenue million Forecast, by Country 2019 & 2032
- Table 62: Global bioplastic rigid packaging Volume K Forecast, by Country 2019 & 2032
- Table 63: Turkey bioplastic rigid packaging Revenue (million) Forecast, by Application 2019 & 2032
- Table 64: Turkey bioplastic rigid packaging Volume (K) Forecast, by Application 2019 & 2032
- Table 65: Israel bioplastic rigid packaging Revenue (million) Forecast, by Application 2019 & 2032
- Table 66: Israel bioplastic rigid packaging Volume (K) Forecast, by Application 2019 & 2032
- Table 67: GCC bioplastic rigid packaging Revenue (million) Forecast, by Application 2019 & 2032
- Table 68: GCC bioplastic rigid packaging Volume (K) Forecast, by Application 2019 & 2032
- Table 69: North Africa bioplastic rigid packaging Revenue (million) Forecast, by Application 2019 & 2032
- Table 70: North Africa bioplastic rigid packaging Volume (K) Forecast, by Application 2019 & 2032
- Table 71: South Africa bioplastic rigid packaging Revenue (million) Forecast, by Application 2019 & 2032
- Table 72: South Africa bioplastic rigid packaging Volume (K) Forecast, by Application 2019 & 2032
- Table 73: Rest of Middle East & Africa bioplastic rigid packaging Revenue (million) Forecast, by Application 2019 & 2032
- Table 74: Rest of Middle East & Africa bioplastic rigid packaging Volume (K) Forecast, by Application 2019 & 2032
- Table 75: Global bioplastic rigid packaging Revenue million Forecast, by Application 2019 & 2032
- Table 76: Global bioplastic rigid packaging Volume K Forecast, by Application 2019 & 2032
- Table 77: Global bioplastic rigid packaging Revenue million Forecast, by Types 2019 & 2032
- Table 78: Global bioplastic rigid packaging Volume K Forecast, by Types 2019 & 2032
- Table 79: Global bioplastic rigid packaging Revenue million Forecast, by Country 2019 & 2032
- Table 80: Global bioplastic rigid packaging Volume K Forecast, by Country 2019 & 2032
- Table 81: China bioplastic rigid packaging Revenue (million) Forecast, by Application 2019 & 2032
- Table 82: China bioplastic rigid packaging Volume (K) Forecast, by Application 2019 & 2032
- Table 83: India bioplastic rigid packaging Revenue (million) Forecast, by Application 2019 & 2032
- Table 84: India bioplastic rigid packaging Volume (K) Forecast, by Application 2019 & 2032
- Table 85: Japan bioplastic rigid packaging Revenue (million) Forecast, by Application 2019 & 2032
- Table 86: Japan bioplastic rigid packaging Volume (K) Forecast, by Application 2019 & 2032
- Table 87: South Korea bioplastic rigid packaging Revenue (million) Forecast, by Application 2019 & 2032
- Table 88: South Korea bioplastic rigid packaging Volume (K) Forecast, by Application 2019 & 2032
- Table 89: ASEAN bioplastic rigid packaging Revenue (million) Forecast, by Application 2019 & 2032
- Table 90: ASEAN bioplastic rigid packaging Volume (K) Forecast, by Application 2019 & 2032
- Table 91: Oceania bioplastic rigid packaging Revenue (million) Forecast, by Application 2019 & 2032
- Table 92: Oceania bioplastic rigid packaging Volume (K) Forecast, by Application 2019 & 2032
- Table 93: Rest of Asia Pacific bioplastic rigid packaging Revenue (million) Forecast, by Application 2019 & 2032
- Table 94: Rest of Asia Pacific bioplastic rigid packaging Volume (K) Forecast, by Application 2019 & 2032
Frequently Asked Questions
1. What is the projected Compound Annual Growth Rate (CAGR) of the bioplastic rigid packaging?
The projected CAGR is approximately XX%.
2. Which companies are prominent players in the bioplastic rigid packaging?
Key companies in the market include Arkema, Dow, NatureWorks, Heritage Pioneer Corporate Group, Novamont, Metabolix, Reverdia, Solvay, Bioamber, Corbion, Amcor, Berry Plastics.
3. What are the main segments of the bioplastic rigid packaging?
The market segments include Application, Types.
4. Can you provide details about the market size?
The market size is estimated to be USD XXX million as of 2022.
5. What are some drivers contributing to market growth?
N/A
6. What are the notable trends driving market growth?
N/A
7. Are there any restraints impacting market growth?
N/A
8. Can you provide examples of recent developments in the market?
N/A
9. What pricing options are available for accessing the report?
Pricing options include single-user, multi-user, and enterprise licenses priced at USD 4350.00, USD 6525.00, and USD 8700.00 respectively.
10. Is the market size provided in terms of value or volume?
The market size is provided in terms of value, measured in million and volume, measured in K.
11. Are there any specific market keywords associated with the report?
Yes, the market keyword associated with the report is "bioplastic rigid packaging," which aids in identifying and referencing the specific market segment covered.
12. How do I determine which pricing option suits my needs best?
The pricing options vary based on user requirements and access needs. Individual users may opt for single-user licenses, while businesses requiring broader access may choose multi-user or enterprise licenses for cost-effective access to the report.
13. Are there any additional resources or data provided in the bioplastic rigid packaging report?
While the report offers comprehensive insights, it's advisable to review the specific contents or supplementary materials provided to ascertain if additional resources or data are available.
14. How can I stay updated on further developments or reports in the bioplastic rigid packaging?
To stay informed about further developments, trends, and reports in the bioplastic rigid packaging, consider subscribing to industry newsletters, following relevant companies and organizations, or regularly checking reputable industry news sources and publications.
Methodology
Step 1 - Identification of Relevant Samples Size from Population Database


Step 2 - Approaches for Defining Global Market Size (Value, Volume* & Price*)

Note*: In applicable scenarios
Step 3 - Data Sources
Primary Research
- Web Analytics
- Survey Reports
- Research Institute
- Latest Research Reports
- Opinion Leaders
Secondary Research
- Annual Reports
- White Paper
- Latest Press Release
- Industry Association
- Paid Database
- Investor Presentations

Step 4 - Data Triangulation
Involves using different sources of information in order to increase the validity of a study
These sources are likely to be stakeholders in a program - participants, other researchers, program staff, other community members, and so on.
Then we put all data in single framework & apply various statistical tools to find out the dynamic on the market.
During the analysis stage, feedback from the stakeholder groups would be compared to determine areas of agreement as well as areas of divergence


