

Key Insights
The Indian Buy Now, Pay Later (BNPL) market is poised for substantial expansion, fueled by increasing smartphone adoption, digital literacy, and the robust growth of e-commerce. Expected to achieve a Compound Annual Growth Rate (CAGR) of 13.4%, the market is projected to reach a significant valuation by 2025. BNPL services offer unparalleled convenience and accessibility, especially to younger demographics and individuals with limited access to traditional credit. The widespread adoption of cashless transactions and the integration of embedded finance solutions within e-commerce platforms are key growth catalysts. However, potential challenges include concerns over debt accumulation and financial inclusion disparities. Regulatory scrutiny and the risk of increased defaults are critical considerations for market stakeholders. The BNPL landscape in India is highly competitive, featuring established players such as Paytm Postpaid, Flipkart Pay Later, and Amazon Pay Later, alongside emerging innovators like ZestMoney and Slice. Differentiation strategies revolve around credit limits, interest rates, e-commerce platform integration, and user-centric mobile applications. The market's trajectory hinges on adapting to regulatory shifts, effective risk management, and continuous innovation to meet evolving consumer demands.
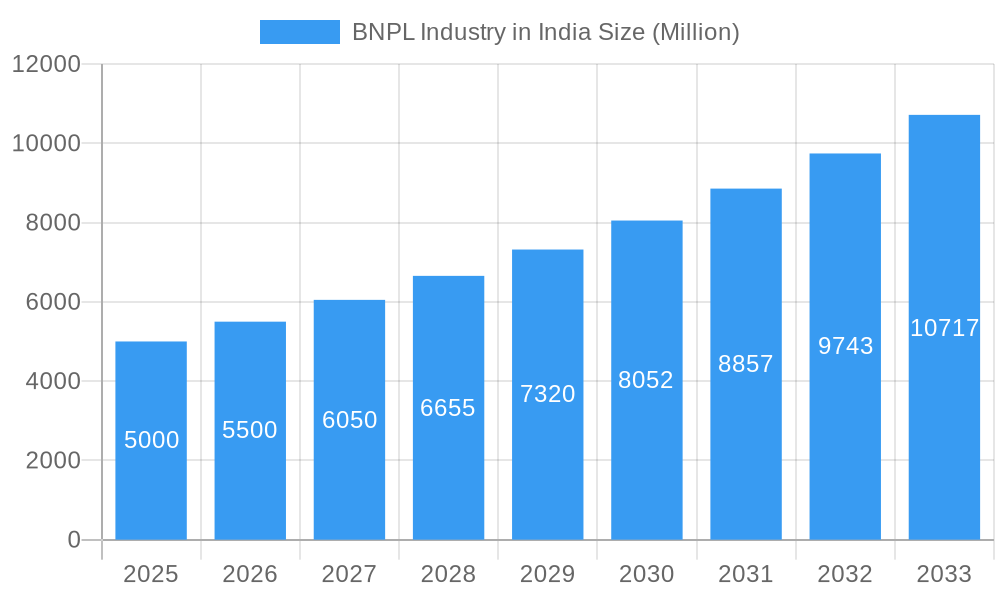
BNPL Industry in India Market Size (In Billion)
The Indian BNPL market is estimated to be valued at $21.95 billion in 2025. Projections leverage this base year valuation and the anticipated CAGR to forecast year-on-year growth, considering economic indicators and regulatory developments. Analyzing the market share and expansion strategies of key players is essential for understanding competitive dynamics. A granular regional analysis, encompassing data from diverse states, will illuminate market distribution and identify high-potential growth zones. Future research should delve into consumer behavior, including repayment and default rates, as well as customer satisfaction, to provide a holistic view of the market's opportunities and challenges.
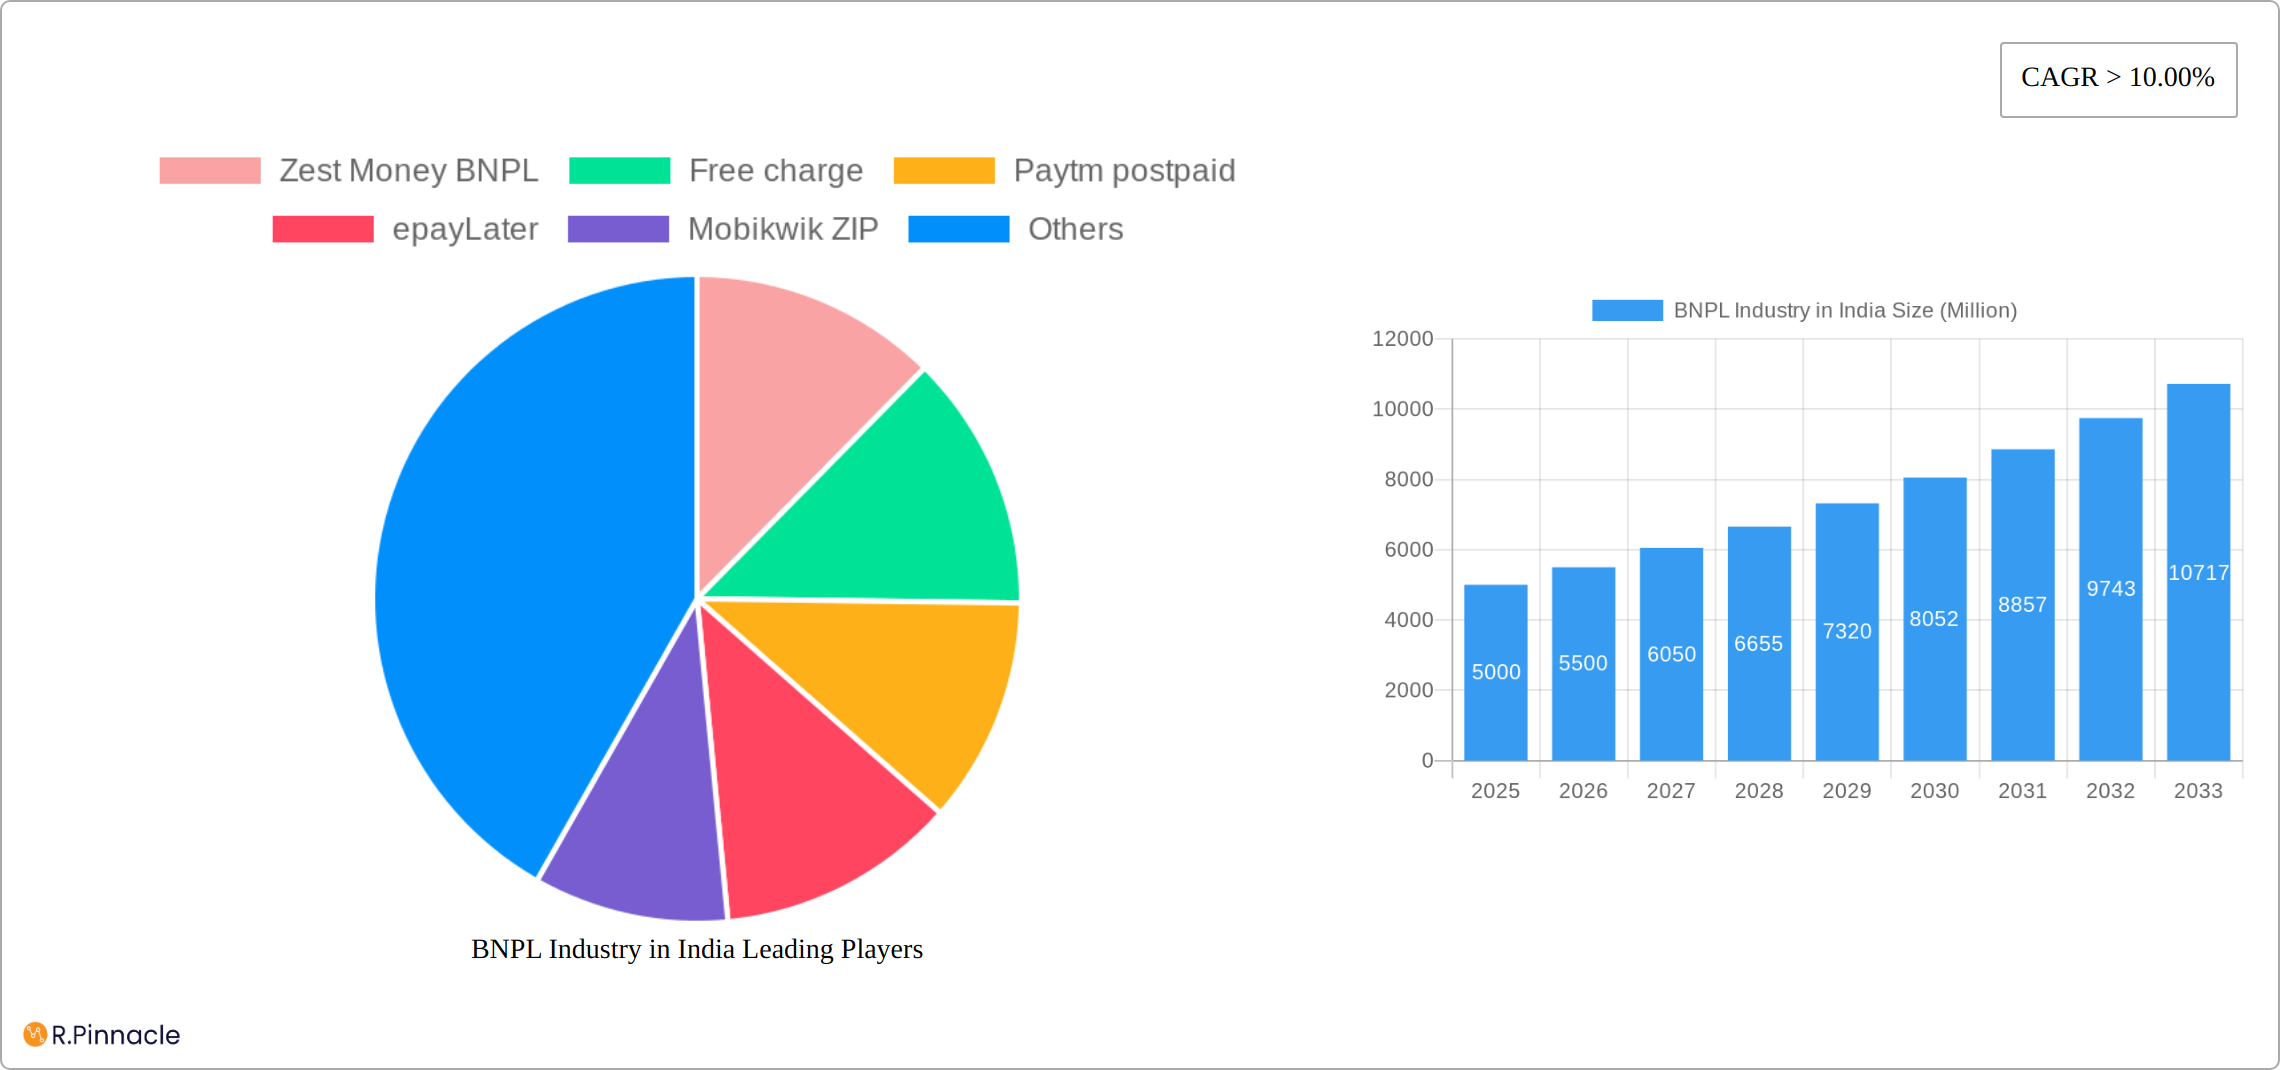
BNPL Industry in India Company Market Share
India's Buy Now Pay Later (BNPL) Industry: A Comprehensive Market Report (2019-2033)
This comprehensive report provides an in-depth analysis of the burgeoning Buy Now Pay Later (BNPL) industry in India, offering crucial insights for industry professionals, investors, and strategists. With a detailed study period spanning 2019-2033 (Base Year: 2025, Forecast Period: 2025-2033), this report unveils the market structure, dynamics, and future outlook, highlighting key players and emerging trends. The report leverages extensive market research, incorporating real-world examples and quantifiable data to offer actionable intelligence. Projected market values are in Millions.
BNPL Industry in India Market Structure & Innovation Trends
This section analyzes the competitive landscape of India's BNPL market, examining market concentration, innovative drivers, regulatory frameworks, product substitutes, end-user demographics, and merger & acquisition (M&A) activities. The market is characterized by a dynamic interplay of established players and emerging fintechs, resulting in a rapidly evolving competitive landscape.
Market Concentration: The Indian BNPL market exhibits a moderately concentrated structure with a few dominant players controlling a significant market share. The top 5 players are estimated to hold xx% of the market in 2025, while the remaining market share is distributed among numerous smaller players. Precise market share figures are provided within the full report.
Innovation Drivers: Key innovation drivers include advancements in financial technology, increasing smartphone penetration, and the growing preference for digital payment methods among Indian consumers. The focus on personalized credit scoring and risk assessment models is driving product diversification and improved user experience.
Regulatory Framework: The regulatory landscape is constantly evolving, influencing the operational strategies of BNPL providers. Recent regulatory changes have focused on consumer protection and risk management. The report details the current regulatory environment and its potential future impact.
Product Substitutes: Traditional credit cards and personal loans remain the primary substitutes for BNPL services. However, the convenience and accessibility of BNPL are driving its adoption amongst younger demographics.
End-User Demographics: The primary end-users are millennials and Gen Z, who are comfortable with digital technologies and seek flexible payment options. The report provides a detailed analysis of the demographic segmentation of BNPL users in India.
M&A Activities: The BNPL sector has witnessed significant M&A activity in recent years, with larger players acquiring smaller firms to expand their market reach and product offerings. The report includes an analysis of past M&A deals and estimates future activity, providing potential deal values.
BNPL Industry in India Market Dynamics & Trends
This section explores the market dynamics shaping the growth trajectory of the Indian BNPL sector. This includes a comprehensive analysis of market growth drivers, technological disruptions, evolving consumer preferences, and the competitive dynamics among key players.
The Indian BNPL market is characterized by rapid growth, driven by factors such as increasing smartphone and internet penetration, rising digital literacy, and the growing preference for cashless transactions. The market has witnessed significant growth in recent years, with a Compound Annual Growth Rate (CAGR) estimated at xx% during the historical period (2019-2024) and projected at xx% during the forecast period (2025-2033). The market penetration rate is currently estimated at xx% and is expected to increase to xx% by 2033, driven by factors such as increasing awareness of BNPL services, and expanding merchant acceptance. Technological disruptions, such as the adoption of advanced analytics and AI-powered credit scoring, are transforming the BNPL landscape, leading to improved risk management and personalized customer experiences. Consumer preferences are shifting towards seamless, user-friendly BNPL platforms that offer personalized rewards programs. The competitive landscape is highly dynamic, with companies vying for market share through strategic partnerships, product innovations, and aggressive marketing campaigns.
Dominant Regions & Segments in BNPL Industry in India
This section delves into the leading geographical areas and consumer segments within India's burgeoning Buy Now, Pay Later (BNPL) market. Our analysis provides a detailed examination of market leadership, identifying key contributors to its dominance. While urban centers currently spearhead BNPL adoption—driven by high digital literacy rates and widespread smartphone/internet access—we project substantial growth in rural areas as digital infrastructure improves and awareness of BNPL services increases. This expansion will be fueled by initiatives to bridge the digital divide and promote financial inclusion in underserved communities.
Key Drivers of Regional Dominance:
- High smartphone and internet penetration, particularly in urban areas, creating a large addressable market.
- Increasing digital literacy and financial inclusion initiatives extending access to financial services across demographics.
- A robust and rapidly expanding e-commerce infrastructure providing a fertile ground for BNPL integration.
- Supportive government policies promoting digital payments and financial technology adoption, fostering a conducive regulatory environment.
Segment-wise Dominance Analysis: This in-depth analysis examines the dominance across various BNPL segments, including factors such as age demographics, income levels, and spending habits. We explore segment-specific growth drivers and challenges, revealing opportunities for targeted marketing strategies and product development.
BNPL Industry in India Product Innovations
The Indian BNPL market is witnessing rapid product innovation, driven by the need to meet diverse consumer needs and preferences. This includes the development of specialized BNPL products for specific consumer segments, such as students and small business owners, and integration with existing e-commerce platforms and social media applications. Innovations are focused on improving the user experience, streamlining the application process, and enhancing security features to mitigate risks associated with BNPL transactions. The increasing use of AI and machine learning in credit scoring and risk assessment is a significant technological trend enabling more accurate and efficient lending decisions. These innovations are improving the market fit of BNPL services by making them more accessible, convenient, and secure for consumers.
Report Scope & Segmentation Analysis
This report meticulously segments the Indian BNPL market across several key dimensions, including product type (e.g., point-of-sale financing, online installment plans), user demographics (age, income, location), transaction value, and deployment mode (app-based, integrated with e-commerce platforms). For each segment, we provide projected growth rates, market size estimations, and a competitive landscape analysis, offering a comprehensive view of the market's dynamics. [Detailed segment-specific data and growth projections will be available in the full report.]
Key Drivers of BNPL Industry in India Growth
The remarkable growth trajectory of the Indian BNPL industry is propelled by a synergistic interplay of technological advancements, economic factors, and supportive regulatory frameworks. Sophisticated risk assessment models and streamlined mobile payment infrastructure are significantly enhancing the accessibility and efficiency of BNPL services. The booming e-commerce sector and rising consumer spending contribute to a large and expanding pool of potential BNPL users. Moreover, government policies actively promoting financial inclusion and digital payments are further accelerating the market's expansion. This confluence of factors ensures the continued rapid growth of the Indian BNPL market.
Challenges in the BNPL Industry in India Sector
The BNPL industry in India faces several challenges. Regulatory uncertainties and evolving compliance requirements pose significant hurdles. Supply-chain disruptions can impact the availability of credit to consumers. Intense competition from existing and emerging players necessitates continuous innovation and strategic adaptation to maintain market share. Furthermore, concerns about consumer debt levels and the potential for defaults represent a significant risk. These challenges can impact the long-term growth and profitability of the BNPL market. The report quantifies the impact of these challenges on the sector's performance.
Emerging Opportunities in BNPL Industry in India
The Indian BNPL market is ripe with opportunities. Expanding into underserved geographical areas and demographic segments presents significant growth potential. Integrating BNPL services with emerging technologies like blockchain and AI can enhance security and operational efficiency, leading to a more robust and trustworthy ecosystem. The increasing demand for personalized financial solutions opens avenues for tailoring BNPL offerings to individual consumer needs and preferences. These emerging opportunities will fundamentally shape the future landscape of the Indian BNPL market.
Leading Players in the BNPL Industry in India Market
- Zest Money BNPL
- Freecharge
- Paytm postpaid
- epayLater
- Mobikwik ZIP
- Flipkart pay later
- Olamoney Postpaid
- Money Tap
- Simpl
- Lazy Pay
- Flexmoney
- Amazon Pay later
- Capital float
- Slice
- Kreditbee
- Postpe
List Not Exhaustive
Key Developments in BNPL Industry in India Industry
May 2023: ZestMoney announces plans to achieve profitability within 6 months and is finalizing a new investment round from existing shareholders (Quona Capital, Zip, Omidyar Network India, Flourish VC, and Scarlet Digital). The company will transition to an LSP (Lending Service Provider) model.
February 2023: The Indian IT Ministry lifts the ban on several lending apps, including PayU's LazyPay, Kissht, KreditBee, and Indiabulls' Home Loans, easing regulatory pressures on the fintech industry.
Future Outlook for BNPL Industry in India Market
The future of India's BNPL industry remains exceptionally promising, driven by sustained growth in e-commerce, escalating smartphone penetration, and a young, digitally fluent population. Strategic alliances with banks and financial institutions will be critical in expanding access to credit while effectively mitigating risks. Continuous innovation and technological advancements—particularly AI-powered risk assessment and personalized BNPL offerings—will be instrumental in maintaining a competitive edge. The market is poised for considerable growth, presenting attractive opportunities for both established players and new entrants seeking to capitalize on this dynamic market.
BNPL Industry in India Segmentation
-
1. Channel
- 1.1. Online
- 1.2. POS
-
2. Enterprise
- 2.1. Large Enterprise
- 2.2. Small & medium enterprise
-
3. End-user
- 3.1. Consmer electronics
- 3.2. Fashion & garments
- 3.3. Healthcare
- 3.4. Leisure & entertainment
- 3.5. Retail
- 3.6. Other End-users
BNPL Industry in India Segmentation By Geography
-
1. North America
- 1.1. United States
- 1.2. Canada
- 1.3. Mexico
-
2. South America
- 2.1. Brazil
- 2.2. Argentina
- 2.3. Rest of South America
-
3. Europe
- 3.1. United Kingdom
- 3.2. Germany
- 3.3. France
- 3.4. Italy
- 3.5. Spain
- 3.6. Russia
- 3.7. Benelux
- 3.8. Nordics
- 3.9. Rest of Europe
-
4. Middle East & Africa
- 4.1. Turkey
- 4.2. Israel
- 4.3. GCC
- 4.4. North Africa
- 4.5. South Africa
- 4.6. Rest of Middle East & Africa
-
5. Asia Pacific
- 5.1. China
- 5.2. India
- 5.3. Japan
- 5.4. South Korea
- 5.5. ASEAN
- 5.6. Oceania
- 5.7. Rest of Asia Pacific
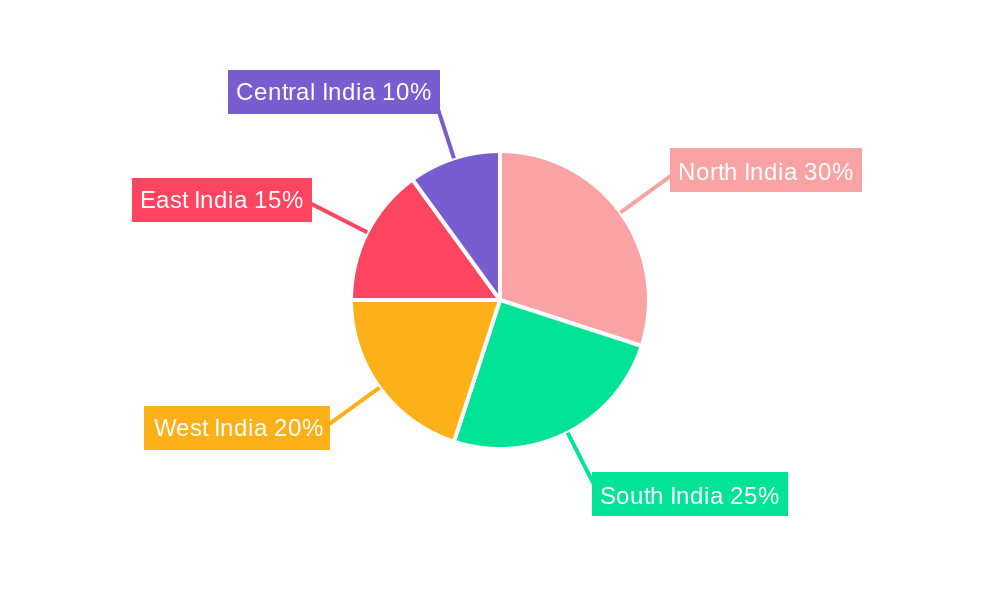
BNPL Industry in India Regional Market Share
Geographic Coverage of BNPL Industry in India
BNPL Industry in India REPORT HIGHLIGHTS
| Aspects | Details |
|---|---|
| Study Period | 2020-2034 |
| Base Year | 2025 |
| Estimated Year | 2026 |
| Forecast Period | 2026-2034 |
| Historical Period | 2020-2025 |
| Growth Rate | CAGR of 13.4% from 2020-2034 |
| Segmentation |
|
Table of Contents
- 1. Introduction
- 1.1. Research Scope
- 1.2. Market Segmentation
- 1.3. Research Objective
- 1.4. Definitions and Assumptions
- 2. Executive Summary
- 2.1. Market Snapshot
- 3. Market Dynamics
- 3.1. Market Drivers
- 3.2. Market Restrains
- 3.3. Market Trends
- 3.4. Market Opportunities
- 4. Market Factor Analysis
- 4.1. Porters Five Forces
- 4.1.1. Bargaining Power of Suppliers
- 4.1.2. Bargaining Power of Buyers
- 4.1.3. Threat of New Entrants
- 4.1.4. Threat of Substitutes
- 4.1.5. Competitive Rivalry
- 4.2. PESTEL analysis
- 4.3. BCG Analysis
- 4.3.1. Stars (High Growth, High Market Share)
- 4.3.2. Cash Cows (Low Growth, High Market Share)
- 4.3.3. Question Mark (High Growth, Low Market Share)
- 4.3.4. Dogs (Low Growth, Low Market Share)
- 4.4. Ansoff Matrix Analysis
- 4.5. Supply Chain Analysis
- 4.6. Regulatory Landscape
- 4.7. Current Market Potential and Opportunity Assessment (TAM–SAM–SOM Framework)
- 4.8. PRI Analyst Note
- 4.1. Porters Five Forces
- 5. Market Analysis, Insights and Forecast 2021-2033
- 5.1. Market Analysis, Insights and Forecast - by Channel
- 5.1.1. Online
- 5.1.2. POS
- 5.2. Market Analysis, Insights and Forecast - by Enterprise
- 5.2.1. Large Enterprise
- 5.2.2. Small & medium enterprise
- 5.3. Market Analysis, Insights and Forecast - by End-user
- 5.3.1. Consmer electronics
- 5.3.2. Fashion & garments
- 5.3.3. Healthcare
- 5.3.4. Leisure & entertainment
- 5.3.5. Retail
- 5.3.6. Other End-users
- 5.4. Market Analysis, Insights and Forecast - by Region
- 5.4.1. North America
- 5.4.2. South America
- 5.4.3. Europe
- 5.4.4. Middle East & Africa
- 5.4.5. Asia Pacific
- 5.1. Market Analysis, Insights and Forecast - by Channel
- 6. Global BNPL Industry in India Analysis, Insights and Forecast, 2021-2033
- 6.1. Market Analysis, Insights and Forecast - by Channel
- 6.1.1. Online
- 6.1.2. POS
- 6.2. Market Analysis, Insights and Forecast - by Enterprise
- 6.2.1. Large Enterprise
- 6.2.2. Small & medium enterprise
- 6.3. Market Analysis, Insights and Forecast - by End-user
- 6.3.1. Consmer electronics
- 6.3.2. Fashion & garments
- 6.3.3. Healthcare
- 6.3.4. Leisure & entertainment
- 6.3.5. Retail
- 6.3.6. Other End-users
- 6.1. Market Analysis, Insights and Forecast - by Channel
- 7. North America BNPL Industry in India Analysis, Insights and Forecast, 2020-2032
- 7.1. Market Analysis, Insights and Forecast - by Channel
- 7.1.1. Online
- 7.1.2. POS
- 7.2. Market Analysis, Insights and Forecast - by Enterprise
- 7.2.1. Large Enterprise
- 7.2.2. Small & medium enterprise
- 7.3. Market Analysis, Insights and Forecast - by End-user
- 7.3.1. Consmer electronics
- 7.3.2. Fashion & garments
- 7.3.3. Healthcare
- 7.3.4. Leisure & entertainment
- 7.3.5. Retail
- 7.3.6. Other End-users
- 7.1. Market Analysis, Insights and Forecast - by Channel
- 8. South America BNPL Industry in India Analysis, Insights and Forecast, 2020-2032
- 8.1. Market Analysis, Insights and Forecast - by Channel
- 8.1.1. Online
- 8.1.2. POS
- 8.2. Market Analysis, Insights and Forecast - by Enterprise
- 8.2.1. Large Enterprise
- 8.2.2. Small & medium enterprise
- 8.3. Market Analysis, Insights and Forecast - by End-user
- 8.3.1. Consmer electronics
- 8.3.2. Fashion & garments
- 8.3.3. Healthcare
- 8.3.4. Leisure & entertainment
- 8.3.5. Retail
- 8.3.6. Other End-users
- 8.1. Market Analysis, Insights and Forecast - by Channel
- 9. Europe BNPL Industry in India Analysis, Insights and Forecast, 2020-2032
- 9.1. Market Analysis, Insights and Forecast - by Channel
- 9.1.1. Online
- 9.1.2. POS
- 9.2. Market Analysis, Insights and Forecast - by Enterprise
- 9.2.1. Large Enterprise
- 9.2.2. Small & medium enterprise
- 9.3. Market Analysis, Insights and Forecast - by End-user
- 9.3.1. Consmer electronics
- 9.3.2. Fashion & garments
- 9.3.3. Healthcare
- 9.3.4. Leisure & entertainment
- 9.3.5. Retail
- 9.3.6. Other End-users
- 9.1. Market Analysis, Insights and Forecast - by Channel
- 10. Middle East & Africa BNPL Industry in India Analysis, Insights and Forecast, 2020-2032
- 10.1. Market Analysis, Insights and Forecast - by Channel
- 10.1.1. Online
- 10.1.2. POS
- 10.2. Market Analysis, Insights and Forecast - by Enterprise
- 10.2.1. Large Enterprise
- 10.2.2. Small & medium enterprise
- 10.3. Market Analysis, Insights and Forecast - by End-user
- 10.3.1. Consmer electronics
- 10.3.2. Fashion & garments
- 10.3.3. Healthcare
- 10.3.4. Leisure & entertainment
- 10.3.5. Retail
- 10.3.6. Other End-users
- 10.1. Market Analysis, Insights and Forecast - by Channel
- 11. Asia Pacific BNPL Industry in India Analysis, Insights and Forecast, 2020-2032
- 11.1. Market Analysis, Insights and Forecast - by Channel
- 11.1.1. Online
- 11.1.2. POS
- 11.2. Market Analysis, Insights and Forecast - by Enterprise
- 11.2.1. Large Enterprise
- 11.2.2. Small & medium enterprise
- 11.3. Market Analysis, Insights and Forecast - by End-user
- 11.3.1. Consmer electronics
- 11.3.2. Fashion & garments
- 11.3.3. Healthcare
- 11.3.4. Leisure & entertainment
- 11.3.5. Retail
- 11.3.6. Other End-users
- 11.1. Market Analysis, Insights and Forecast - by Channel
- 12. Competitive Analysis
- 12.1. Company Profiles
- 12.1.1 Zest Money BNPL
- 12.1.1.1. Company Overview
- 12.1.1.2. Products
- 12.1.1.3. Company Financials
- 12.1.1.4. SWOT Analysis
- 12.1.2 Free charge
- 12.1.2.1. Company Overview
- 12.1.2.2. Products
- 12.1.2.3. Company Financials
- 12.1.2.4. SWOT Analysis
- 12.1.3 Paytm postpaid
- 12.1.3.1. Company Overview
- 12.1.3.2. Products
- 12.1.3.3. Company Financials
- 12.1.3.4. SWOT Analysis
- 12.1.4 epayLater
- 12.1.4.1. Company Overview
- 12.1.4.2. Products
- 12.1.4.3. Company Financials
- 12.1.4.4. SWOT Analysis
- 12.1.5 Mobikwik ZIP
- 12.1.5.1. Company Overview
- 12.1.5.2. Products
- 12.1.5.3. Company Financials
- 12.1.5.4. SWOT Analysis
- 12.1.6 Flipkart pay later
- 12.1.6.1. Company Overview
- 12.1.6.2. Products
- 12.1.6.3. Company Financials
- 12.1.6.4. SWOT Analysis
- 12.1.7 Olamoney Postpaid
- 12.1.7.1. Company Overview
- 12.1.7.2. Products
- 12.1.7.3. Company Financials
- 12.1.7.4. SWOT Analysis
- 12.1.8 Money Tap
- 12.1.8.1. Company Overview
- 12.1.8.2. Products
- 12.1.8.3. Company Financials
- 12.1.8.4. SWOT Analysis
- 12.1.9 Simpl
- 12.1.9.1. Company Overview
- 12.1.9.2. Products
- 12.1.9.3. Company Financials
- 12.1.9.4. SWOT Analysis
- 12.1.10 Lazy Pay
- 12.1.10.1. Company Overview
- 12.1.10.2. Products
- 12.1.10.3. Company Financials
- 12.1.10.4. SWOT Analysis
- 12.1.11 Flexmoney
- 12.1.11.1. Company Overview
- 12.1.11.2. Products
- 12.1.11.3. Company Financials
- 12.1.11.4. SWOT Analysis
- 12.1.12 Amazon Pay later
- 12.1.12.1. Company Overview
- 12.1.12.2. Products
- 12.1.12.3. Company Financials
- 12.1.12.4. SWOT Analysis
- 12.1.13 Capital float
- 12.1.13.1. Company Overview
- 12.1.13.2. Products
- 12.1.13.3. Company Financials
- 12.1.13.4. SWOT Analysis
- 12.1.14 Slice
- 12.1.14.1. Company Overview
- 12.1.14.2. Products
- 12.1.14.3. Company Financials
- 12.1.14.4. SWOT Analysis
- 12.1.15 Kreditbee
- 12.1.15.1. Company Overview
- 12.1.15.2. Products
- 12.1.15.3. Company Financials
- 12.1.15.4. SWOT Analysis
- 12.1.16 Postpe**List Not Exhaustive
- 12.1.16.1. Company Overview
- 12.1.16.2. Products
- 12.1.16.3. Company Financials
- 12.1.16.4. SWOT Analysis
- 12.1.1 Zest Money BNPL
- 12.2. Market Entropy
- 12.2.1 Company's Key Areas Served
- 12.2.2 Recent Developments
- 12.3. Company Market Share Analysis 2025
- 12.3.1 Top 5 Companies Market Share Analysis
- 12.3.2 Top 3 Companies Market Share Analysis
- 12.4. List of Potential Customers
- 13. Research Methodology
List of Figures
- Figure 1: Global BNPL Industry in India Revenue Breakdown (billion, %) by Region 2025 & 2033
- Figure 2: North America BNPL Industry in India Revenue (billion), by Channel 2025 & 2033
- Figure 3: North America BNPL Industry in India Revenue Share (%), by Channel 2025 & 2033
- Figure 4: North America BNPL Industry in India Revenue (billion), by Enterprise 2025 & 2033
- Figure 5: North America BNPL Industry in India Revenue Share (%), by Enterprise 2025 & 2033
- Figure 6: North America BNPL Industry in India Revenue (billion), by End-user 2025 & 2033
- Figure 7: North America BNPL Industry in India Revenue Share (%), by End-user 2025 & 2033
- Figure 8: North America BNPL Industry in India Revenue (billion), by Country 2025 & 2033
- Figure 9: North America BNPL Industry in India Revenue Share (%), by Country 2025 & 2033
- Figure 10: South America BNPL Industry in India Revenue (billion), by Channel 2025 & 2033
- Figure 11: South America BNPL Industry in India Revenue Share (%), by Channel 2025 & 2033
- Figure 12: South America BNPL Industry in India Revenue (billion), by Enterprise 2025 & 2033
- Figure 13: South America BNPL Industry in India Revenue Share (%), by Enterprise 2025 & 2033
- Figure 14: South America BNPL Industry in India Revenue (billion), by End-user 2025 & 2033
- Figure 15: South America BNPL Industry in India Revenue Share (%), by End-user 2025 & 2033
- Figure 16: South America BNPL Industry in India Revenue (billion), by Country 2025 & 2033
- Figure 17: South America BNPL Industry in India Revenue Share (%), by Country 2025 & 2033
- Figure 18: Europe BNPL Industry in India Revenue (billion), by Channel 2025 & 2033
- Figure 19: Europe BNPL Industry in India Revenue Share (%), by Channel 2025 & 2033
- Figure 20: Europe BNPL Industry in India Revenue (billion), by Enterprise 2025 & 2033
- Figure 21: Europe BNPL Industry in India Revenue Share (%), by Enterprise 2025 & 2033
- Figure 22: Europe BNPL Industry in India Revenue (billion), by End-user 2025 & 2033
- Figure 23: Europe BNPL Industry in India Revenue Share (%), by End-user 2025 & 2033
- Figure 24: Europe BNPL Industry in India Revenue (billion), by Country 2025 & 2033
- Figure 25: Europe BNPL Industry in India Revenue Share (%), by Country 2025 & 2033
- Figure 26: Middle East & Africa BNPL Industry in India Revenue (billion), by Channel 2025 & 2033
- Figure 27: Middle East & Africa BNPL Industry in India Revenue Share (%), by Channel 2025 & 2033
- Figure 28: Middle East & Africa BNPL Industry in India Revenue (billion), by Enterprise 2025 & 2033
- Figure 29: Middle East & Africa BNPL Industry in India Revenue Share (%), by Enterprise 2025 & 2033
- Figure 30: Middle East & Africa BNPL Industry in India Revenue (billion), by End-user 2025 & 2033
- Figure 31: Middle East & Africa BNPL Industry in India Revenue Share (%), by End-user 2025 & 2033
- Figure 32: Middle East & Africa BNPL Industry in India Revenue (billion), by Country 2025 & 2033
- Figure 33: Middle East & Africa BNPL Industry in India Revenue Share (%), by Country 2025 & 2033
- Figure 34: Asia Pacific BNPL Industry in India Revenue (billion), by Channel 2025 & 2033
- Figure 35: Asia Pacific BNPL Industry in India Revenue Share (%), by Channel 2025 & 2033
- Figure 36: Asia Pacific BNPL Industry in India Revenue (billion), by Enterprise 2025 & 2033
- Figure 37: Asia Pacific BNPL Industry in India Revenue Share (%), by Enterprise 2025 & 2033
- Figure 38: Asia Pacific BNPL Industry in India Revenue (billion), by End-user 2025 & 2033
- Figure 39: Asia Pacific BNPL Industry in India Revenue Share (%), by End-user 2025 & 2033
- Figure 40: Asia Pacific BNPL Industry in India Revenue (billion), by Country 2025 & 2033
- Figure 41: Asia Pacific BNPL Industry in India Revenue Share (%), by Country 2025 & 2033
List of Tables
- Table 1: Global BNPL Industry in India Revenue billion Forecast, by Channel 2020 & 2033
- Table 2: Global BNPL Industry in India Revenue billion Forecast, by Enterprise 2020 & 2033
- Table 3: Global BNPL Industry in India Revenue billion Forecast, by End-user 2020 & 2033
- Table 4: Global BNPL Industry in India Revenue billion Forecast, by Region 2020 & 2033
- Table 5: Global BNPL Industry in India Revenue billion Forecast, by Channel 2020 & 2033
- Table 6: Global BNPL Industry in India Revenue billion Forecast, by Enterprise 2020 & 2033
- Table 7: Global BNPL Industry in India Revenue billion Forecast, by End-user 2020 & 2033
- Table 8: Global BNPL Industry in India Revenue billion Forecast, by Country 2020 & 2033
- Table 9: United States BNPL Industry in India Revenue (billion) Forecast, by Application 2020 & 2033
- Table 10: Canada BNPL Industry in India Revenue (billion) Forecast, by Application 2020 & 2033
- Table 11: Mexico BNPL Industry in India Revenue (billion) Forecast, by Application 2020 & 2033
- Table 12: Global BNPL Industry in India Revenue billion Forecast, by Channel 2020 & 2033
- Table 13: Global BNPL Industry in India Revenue billion Forecast, by Enterprise 2020 & 2033
- Table 14: Global BNPL Industry in India Revenue billion Forecast, by End-user 2020 & 2033
- Table 15: Global BNPL Industry in India Revenue billion Forecast, by Country 2020 & 2033
- Table 16: Brazil BNPL Industry in India Revenue (billion) Forecast, by Application 2020 & 2033
- Table 17: Argentina BNPL Industry in India Revenue (billion) Forecast, by Application 2020 & 2033
- Table 18: Rest of South America BNPL Industry in India Revenue (billion) Forecast, by Application 2020 & 2033
- Table 19: Global BNPL Industry in India Revenue billion Forecast, by Channel 2020 & 2033
- Table 20: Global BNPL Industry in India Revenue billion Forecast, by Enterprise 2020 & 2033
- Table 21: Global BNPL Industry in India Revenue billion Forecast, by End-user 2020 & 2033
- Table 22: Global BNPL Industry in India Revenue billion Forecast, by Country 2020 & 2033
- Table 23: United Kingdom BNPL Industry in India Revenue (billion) Forecast, by Application 2020 & 2033
- Table 24: Germany BNPL Industry in India Revenue (billion) Forecast, by Application 2020 & 2033
- Table 25: France BNPL Industry in India Revenue (billion) Forecast, by Application 2020 & 2033
- Table 26: Italy BNPL Industry in India Revenue (billion) Forecast, by Application 2020 & 2033
- Table 27: Spain BNPL Industry in India Revenue (billion) Forecast, by Application 2020 & 2033
- Table 28: Russia BNPL Industry in India Revenue (billion) Forecast, by Application 2020 & 2033
- Table 29: Benelux BNPL Industry in India Revenue (billion) Forecast, by Application 2020 & 2033
- Table 30: Nordics BNPL Industry in India Revenue (billion) Forecast, by Application 2020 & 2033
- Table 31: Rest of Europe BNPL Industry in India Revenue (billion) Forecast, by Application 2020 & 2033
- Table 32: Global BNPL Industry in India Revenue billion Forecast, by Channel 2020 & 2033
- Table 33: Global BNPL Industry in India Revenue billion Forecast, by Enterprise 2020 & 2033
- Table 34: Global BNPL Industry in India Revenue billion Forecast, by End-user 2020 & 2033
- Table 35: Global BNPL Industry in India Revenue billion Forecast, by Country 2020 & 2033
- Table 36: Turkey BNPL Industry in India Revenue (billion) Forecast, by Application 2020 & 2033
- Table 37: Israel BNPL Industry in India Revenue (billion) Forecast, by Application 2020 & 2033
- Table 38: GCC BNPL Industry in India Revenue (billion) Forecast, by Application 2020 & 2033
- Table 39: North Africa BNPL Industry in India Revenue (billion) Forecast, by Application 2020 & 2033
- Table 40: South Africa BNPL Industry in India Revenue (billion) Forecast, by Application 2020 & 2033
- Table 41: Rest of Middle East & Africa BNPL Industry in India Revenue (billion) Forecast, by Application 2020 & 2033
- Table 42: Global BNPL Industry in India Revenue billion Forecast, by Channel 2020 & 2033
- Table 43: Global BNPL Industry in India Revenue billion Forecast, by Enterprise 2020 & 2033
- Table 44: Global BNPL Industry in India Revenue billion Forecast, by End-user 2020 & 2033
- Table 45: Global BNPL Industry in India Revenue billion Forecast, by Country 2020 & 2033
- Table 46: China BNPL Industry in India Revenue (billion) Forecast, by Application 2020 & 2033
- Table 47: India BNPL Industry in India Revenue (billion) Forecast, by Application 2020 & 2033
- Table 48: Japan BNPL Industry in India Revenue (billion) Forecast, by Application 2020 & 2033
- Table 49: South Korea BNPL Industry in India Revenue (billion) Forecast, by Application 2020 & 2033
- Table 50: ASEAN BNPL Industry in India Revenue (billion) Forecast, by Application 2020 & 2033
- Table 51: Oceania BNPL Industry in India Revenue (billion) Forecast, by Application 2020 & 2033
- Table 52: Rest of Asia Pacific BNPL Industry in India Revenue (billion) Forecast, by Application 2020 & 2033
Frequently Asked Questions
1. What is the projected Compound Annual Growth Rate (CAGR) of the BNPL Industry in India?
The projected CAGR is approximately 13.4%.
2. Which companies are prominent players in the BNPL Industry in India?
Key companies in the market include Zest Money BNPL, Free charge, Paytm postpaid, epayLater, Mobikwik ZIP, Flipkart pay later, Olamoney Postpaid, Money Tap, Simpl, Lazy Pay, Flexmoney, Amazon Pay later, Capital float, Slice, Kreditbee, Postpe**List Not Exhaustive.
3. What are the main segments of the BNPL Industry in India?
The market segments include Channel, Enterprise, End-user.
4. Can you provide details about the market size?
The market size is estimated to be USD 21.95 billion as of 2022.
5. What are some drivers contributing to market growth?
Increasing e-commerce adoption; Rising middle class and disposable income; Access to credit and financial inclusion.
6. What are the notable trends driving market growth?
Surging E-commerce and Digital P2M Payments Boosting the Market.
7. Are there any restraints impacting market growth?
Increasing e-commerce adoption; Rising middle class and disposable income; Access to credit and financial inclusion.
8. Can you provide examples of recent developments in the market?
May 2023: ZestMoney plans to be profitable in 6 months. The fintech firm is said to be finalizing a new investment round from its existing shareholders, including Quona Capital, Zip, Omidyar Network India, Flourish VC, and Scarlet Digital. To ensure business continuity, ZestMoney plans to operate as a lending service provider (LSP), partnering with banks and NBFCs to write out loans rather than lending directly from its balance sheet.
9. What pricing options are available for accessing the report?
Pricing options include single-user, multi-user, and enterprise licenses priced at USD 3800, USD 4500, and USD 5800 respectively.
10. Is the market size provided in terms of value or volume?
The market size is provided in terms of value, measured in billion.
11. Are there any specific market keywords associated with the report?
Yes, the market keyword associated with the report is "BNPL Industry in India," which aids in identifying and referencing the specific market segment covered.
12. How do I determine which pricing option suits my needs best?
The pricing options vary based on user requirements and access needs. Individual users may opt for single-user licenses, while businesses requiring broader access may choose multi-user or enterprise licenses for cost-effective access to the report.
13. Are there any additional resources or data provided in the BNPL Industry in India report?
While the report offers comprehensive insights, it's advisable to review the specific contents or supplementary materials provided to ascertain if additional resources or data are available.
14. How can I stay updated on further developments or reports in the BNPL Industry in India?
To stay informed about further developments, trends, and reports in the BNPL Industry in India, consider subscribing to industry newsletters, following relevant companies and organizations, or regularly checking reputable industry news sources and publications.
Methodology
Step 1 - Identification of Relevant Samples Size from Population Database


Step 2 - Approaches for Defining Global Market Size (Value, Volume* & Price*)

Note*: In applicable scenarios
Step 3 - Data Sources
Primary Research
- Web Analytics
- Survey Reports
- Research Institute
- Latest Research Reports
- Opinion Leaders
Secondary Research
- Annual Reports
- White Paper
- Latest Press Release
- Industry Association
- Paid Database
- Investor Presentations

Step 4 - Data Triangulation
Involves using different sources of information in order to increase the validity of a study
These sources are likely to be stakeholders in a program - participants, other researchers, program staff, other community members, and so on.
Then we put all data in single framework & apply various statistical tools to find out the dynamic on the market.
During the analysis stage, feedback from the stakeholder groups would be compared to determine areas of agreement as well as areas of divergence