
Key Insights
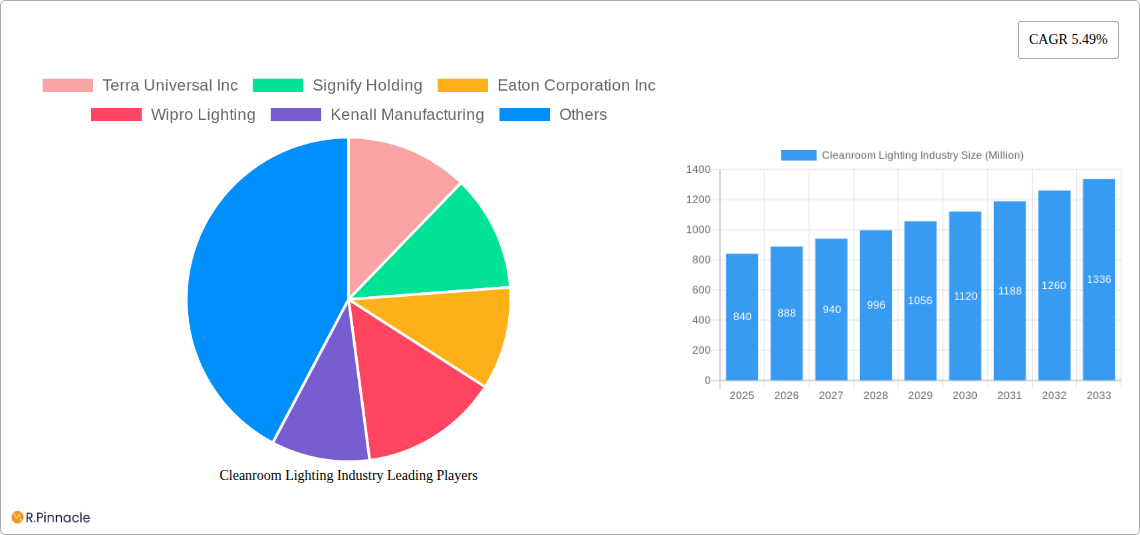
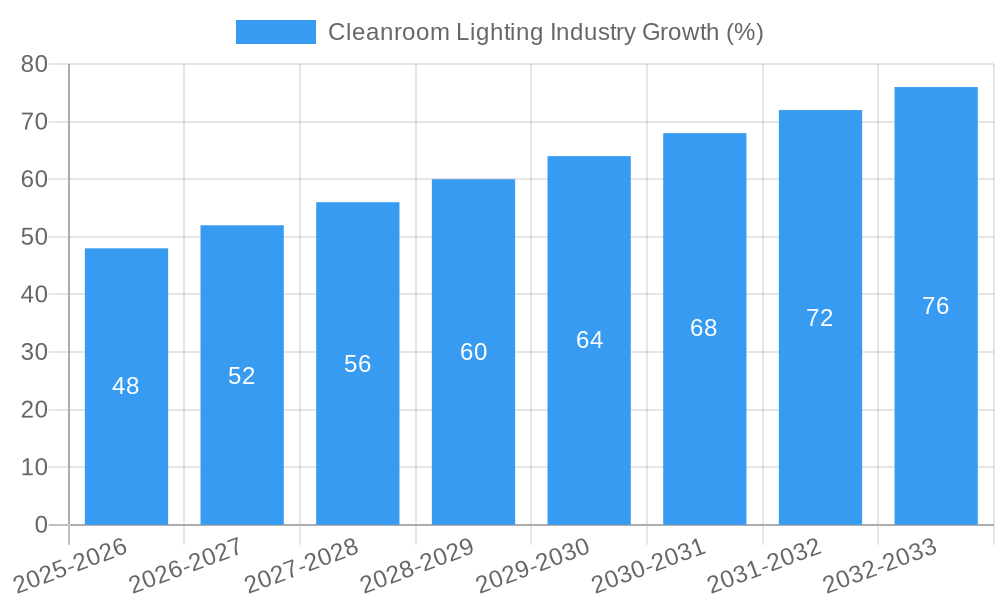
The cleanroom lighting market, valued at $840 million in 2025, is projected to experience robust growth, driven by increasing demand across various sectors. A compound annual growth rate (CAGR) of 5.49% from 2025 to 2033 indicates a significant expansion, reaching an estimated $1.3 billion by 2033. This growth is fueled by several key factors. The stringent hygiene and contamination control requirements within cleanrooms across healthcare (pharmaceuticals, medical device manufacturing), electronics (semiconductor fabrication), and food & beverage industries are driving the adoption of specialized lighting solutions. The shift towards energy-efficient LED lighting, offering longer lifespan, lower energy consumption, and improved light quality compared to traditional fluorescent options, is a major market driver. Furthermore, advancements in smart lighting technologies, enabling remote monitoring and control, enhance operational efficiency and contribute to the market's expansion. Specific growth segments include LED lighting, recessed mounting types, and continued demand in the rapidly growing healthcare and life sciences sector. While initial investment costs might represent a restraint for some businesses, the long-term cost savings and improved operational efficiency offered by advanced cleanroom lighting are overcoming this barrier.
The competitive landscape is marked by a mix of established players like Signify Holding and Eaton Corporation alongside specialized cleanroom lighting manufacturers such as Terra Universal. These companies are focusing on innovation, offering customized solutions to meet the unique requirements of different cleanroom applications. Geographic growth is expected to be distributed, with North America and Europe maintaining significant market shares due to established industries and stringent regulations. However, the Asia-Pacific region is projected to exhibit faster growth due to the expansion of manufacturing facilities and increasing adoption of advanced technologies in emerging economies. The market will continue to evolve, driven by advancements in lighting technology, regulatory changes, and the growing emphasis on creating controlled environments across various industries.
Cleanroom Lighting Industry Market Report: 2019-2033
This comprehensive report provides a detailed analysis of the Cleanroom Lighting industry, projecting a market value exceeding XX Million by 2033. It offers invaluable insights for industry professionals, investors, and strategists seeking to navigate this dynamic sector. The study period covers 2019-2033, with 2025 as the base and estimated year. The report leverages extensive data analysis and expert insights to forecast market trends and opportunities.
Cleanroom Lighting Industry Market Structure & Innovation Trends
The Cleanroom Lighting market is characterized by a moderately concentrated structure, with key players including Terra Universal Inc, Signify Holding, Eaton Corporation Inc, Wipro Lighting, Kenall Manufacturing, Solite Europe Ltd, LUG Light Factory Sp z o o, AB Fagerhult, Crompton Greaves Consumer Electricals Ltd, and Paramount Industries. However, the market also accommodates numerous smaller, specialized players. Market share data for 2024 indicates that the top 5 players collectively hold approximately 45% of the market.
Innovation is driven by increasing demand for energy-efficient and long-lasting lighting solutions, stringent regulatory compliance requirements related to hygiene and safety standards, and advancements in LED technology. The regulatory landscape varies across regions, influencing product design and adoption rates. Product substitution primarily involves the shift from traditional lighting technologies (fluorescent) to LEDs. M&A activity in the sector has seen moderate levels in recent years, with deal values averaging around XX Million per transaction (2019-2024). Key M&A drivers include expansion into new markets and acquisition of specialized technologies.
- Market Concentration: Moderately Concentrated
- Innovation Drivers: LED technology advancements, energy efficiency regulations, hygiene standards.
- Regulatory Framework: Varies by region, impacting product design and adoption.
- Product Substitutes: LED replacing fluorescent lighting.
- M&A Activity: Moderate, average deal value of XX Million.
Cleanroom Lighting Industry Market Dynamics & Trends
The Cleanroom Lighting market is experiencing robust growth, driven by the expansion of end-user industries such as healthcare & life sciences, electronics & semiconductors, and food & beverage. Technological advancements, particularly in LED technology, are fueling this growth, offering improved energy efficiency, longer lifespans, and superior light quality. Consumer preferences are shifting towards sustainable and intelligent lighting systems, driving demand for smart and connected solutions. Competitive dynamics are characterized by intense competition based on pricing, product innovation, and brand reputation. The Compound Annual Growth Rate (CAGR) from 2025 to 2033 is projected to be XX%, and market penetration in key segments is expected to reach XX% by 2033.
Dominant Regions & Segments in Cleanroom Lighting Industry
North America currently holds the leading position in the Cleanroom Lighting market, driven by strong demand from the healthcare and semiconductor sectors, coupled with robust infrastructure and favorable economic policies. However, the Asia-Pacific region is projected to witness the fastest growth rate during the forecast period, fueled by expanding manufacturing capabilities and increasing investment in infrastructure development.
- By Light Source: LED dominates the market due to its superior energy efficiency and longevity, surpassing fluorescent lighting significantly.
- By Mounting Type: Recessed lighting holds a larger market share compared to surface mount due to its aesthetic appeal and ease of integration into cleanroom designs.
- By End-user Industry: Healthcare & Life Sciences currently represent the largest segment, followed by Electronics and Semiconductor industries. The Food & Beverage sector is also a significant contributor.
Key Drivers:
- North America: Strong demand from healthcare and semiconductor sectors, robust infrastructure.
- Asia-Pacific: Expanding manufacturing, increasing infrastructure investment.
- Europe: Stringent regulatory standards, focus on sustainable solutions.
Cleanroom Lighting Industry Product Innovations
Recent innovations in Cleanroom Lighting focus on enhanced energy efficiency, improved light quality (color rendering index and uniformity), and the integration of smart features like dimming and remote control capabilities. The increasing adoption of IoT-enabled lighting systems allows for real-time monitoring and control of lighting parameters, further enhancing operational efficiency and reducing energy waste. These advancements provide significant competitive advantages, improving market fit and capturing a larger share.
Report Scope & Segmentation Analysis
This report segments the Cleanroom Lighting market based on light source (LED, Fluorescent), mounting type (Recessed, Surface Mount), and end-user industry (Healthcare & Life Sciences, Electronics and Semiconductor, Food & Beverage, Other End-user Industries). Each segment's growth projections, market size, and competitive dynamics are analyzed in detail.
Key Drivers of Cleanroom Lighting Industry Growth
The Cleanroom Lighting industry's growth is propelled by several factors: the increasing adoption of LED technology due to its energy efficiency and cost savings, stringent regulatory compliance mandates in various industries emphasizing hygiene and safety, and rising demand from expanding end-user sectors such as healthcare, pharmaceuticals, and electronics manufacturing. Further growth is driven by technological advancements, such as smart lighting systems and IoT integration, as well as supportive government initiatives promoting energy efficiency.
Challenges in the Cleanroom Lighting Industry Sector
The industry faces challenges such as stringent regulatory compliance requirements demanding rigorous testing and certification, potential supply chain disruptions impacting the availability of raw materials and components, and intense competition from both established players and new entrants. These challenges can lead to increased costs and price pressures. For example, a recent xx% increase in raw material prices resulted in a yy% increase in product costs for some manufacturers.
Emerging Opportunities in Cleanroom Lighting Industry
Emerging opportunities lie in the adoption of smart and connected lighting solutions, the expansion into new and developing markets with increasing industrialization, and the rising demand for customized and specialized lighting solutions tailored to specific cleanroom environments. Further, advancements in UV-C disinfection technologies integrated with lighting present a significant opportunity.
Leading Players in the Cleanroom Lighting Industry Market
- Terra Universal Inc
- Signify Holding
- Eaton Corporation Inc
- Wipro Lighting
- Kenall Manufacturing
- Solite Europe Ltd
- LUG Light Factory Sp z o o
- AB Fagerhult
- Crompton Greaves Consumer Electricals Ltd
- Paramount Industries
Key Developments in Cleanroom Lighting Industry
- December 2022: Nicomac Taikisha Cleanrooms invested USD 15.2 Million in a new manufacturing facility, expanding capacity for cleanroom solutions in various industries. This significantly impacts the demand for cleanroom lighting solutions.
- May 2022: LOG invested multi-millions of dollars in expanding its manufacturing floor, including a new ISO Class 8 cleanroom, boosting demand for specialized cleanroom lighting.
Future Outlook for Cleanroom Lighting Industry Market
The Cleanroom Lighting market exhibits significant growth potential, driven by ongoing technological advancements, expanding end-user industries, and supportive regulatory frameworks. Strategic opportunities exist for companies focusing on innovation, energy efficiency, and smart lighting solutions. The market is poised for continued expansion, driven by increasing demand for advanced lighting systems in various cleanroom applications.
Cleanroom Lighting Industry Segmentation
-
1. Light Source
- 1.1. LED
- 1.2. Fluorescent
-
2. Mounting Type
- 2.1. Recessed
- 2.2. Surface Mount
-
3. End-user Industry
- 3.1. Healthcare & Life Sciences
- 3.2. Electronics and Semiconductor
- 3.3. Food & Beverage
- 3.4. Other End-user Industries
Cleanroom Lighting Industry Segmentation By Geography
- 1. North America
- 2. Europe
- 3. Asia
- 4. Latin America
- 5. Middle East and Africa

Cleanroom Lighting Industry REPORT HIGHLIGHTS
| Aspects | Details |
|---|---|
| Study Period | 2019-2033 |
| Base Year | 2024 |
| Estimated Year | 2025 |
| Forecast Period | 2025-2033 |
| Historical Period | 2019-2024 |
| Growth Rate | CAGR of 5.49% from 2019-2033 |
| Segmentation |
|
Table of Contents
- 1. Introduction
- 1.1. Research Scope
- 1.2. Market Segmentation
- 1.3. Research Methodology
- 1.4. Definitions and Assumptions
- 2. Executive Summary
- 2.1. Introduction
- 3. Market Dynamics
- 3.1. Introduction
- 3.2. Market Drivers
- 3.2.1. Stringent Regulations in Healthcare and Food Processing Industries; Rising Demand for Sterile Manufacturing Areas in Pharmaceuticals Industry
- 3.3. Market Restrains
- 3.3.1. High Cost Associated With Cleanrooms and their Operations
- 3.4. Market Trends
- 3.4.1. Healthcare and Life Sciences Segment is Expected to Witness Significant Growth
- 4. Market Factor Analysis
- 4.1. Porters Five Forces
- 4.2. Supply/Value Chain
- 4.3. PESTEL analysis
- 4.4. Market Entropy
- 4.5. Patent/Trademark Analysis
- 5. Global Cleanroom Lighting Industry Analysis, Insights and Forecast, 2019-2031
- 5.1. Market Analysis, Insights and Forecast - by Light Source
- 5.1.1. LED
- 5.1.2. Fluorescent
- 5.2. Market Analysis, Insights and Forecast - by Mounting Type
- 5.2.1. Recessed
- 5.2.2. Surface Mount
- 5.3. Market Analysis, Insights and Forecast - by End-user Industry
- 5.3.1. Healthcare & Life Sciences
- 5.3.2. Electronics and Semiconductor
- 5.3.3. Food & Beverage
- 5.3.4. Other End-user Industries
- 5.4. Market Analysis, Insights and Forecast - by Region
- 5.4.1. North America
- 5.4.2. Europe
- 5.4.3. Asia
- 5.4.4. Latin America
- 5.4.5. Middle East and Africa
- 5.1. Market Analysis, Insights and Forecast - by Light Source
- 6. North America Cleanroom Lighting Industry Analysis, Insights and Forecast, 2019-2031
- 6.1. Market Analysis, Insights and Forecast - by Light Source
- 6.1.1. LED
- 6.1.2. Fluorescent
- 6.2. Market Analysis, Insights and Forecast - by Mounting Type
- 6.2.1. Recessed
- 6.2.2. Surface Mount
- 6.3. Market Analysis, Insights and Forecast - by End-user Industry
- 6.3.1. Healthcare & Life Sciences
- 6.3.2. Electronics and Semiconductor
- 6.3.3. Food & Beverage
- 6.3.4. Other End-user Industries
- 6.1. Market Analysis, Insights and Forecast - by Light Source
- 7. Europe Cleanroom Lighting Industry Analysis, Insights and Forecast, 2019-2031
- 7.1. Market Analysis, Insights and Forecast - by Light Source
- 7.1.1. LED
- 7.1.2. Fluorescent
- 7.2. Market Analysis, Insights and Forecast - by Mounting Type
- 7.2.1. Recessed
- 7.2.2. Surface Mount
- 7.3. Market Analysis, Insights and Forecast - by End-user Industry
- 7.3.1. Healthcare & Life Sciences
- 7.3.2. Electronics and Semiconductor
- 7.3.3. Food & Beverage
- 7.3.4. Other End-user Industries
- 7.1. Market Analysis, Insights and Forecast - by Light Source
- 8. Asia Cleanroom Lighting Industry Analysis, Insights and Forecast, 2019-2031
- 8.1. Market Analysis, Insights and Forecast - by Light Source
- 8.1.1. LED
- 8.1.2. Fluorescent
- 8.2. Market Analysis, Insights and Forecast - by Mounting Type
- 8.2.1. Recessed
- 8.2.2. Surface Mount
- 8.3. Market Analysis, Insights and Forecast - by End-user Industry
- 8.3.1. Healthcare & Life Sciences
- 8.3.2. Electronics and Semiconductor
- 8.3.3. Food & Beverage
- 8.3.4. Other End-user Industries
- 8.1. Market Analysis, Insights and Forecast - by Light Source
- 9. Latin America Cleanroom Lighting Industry Analysis, Insights and Forecast, 2019-2031
- 9.1. Market Analysis, Insights and Forecast - by Light Source
- 9.1.1. LED
- 9.1.2. Fluorescent
- 9.2. Market Analysis, Insights and Forecast - by Mounting Type
- 9.2.1. Recessed
- 9.2.2. Surface Mount
- 9.3. Market Analysis, Insights and Forecast - by End-user Industry
- 9.3.1. Healthcare & Life Sciences
- 9.3.2. Electronics and Semiconductor
- 9.3.3. Food & Beverage
- 9.3.4. Other End-user Industries
- 9.1. Market Analysis, Insights and Forecast - by Light Source
- 10. Middle East and Africa Cleanroom Lighting Industry Analysis, Insights and Forecast, 2019-2031
- 10.1. Market Analysis, Insights and Forecast - by Light Source
- 10.1.1. LED
- 10.1.2. Fluorescent
- 10.2. Market Analysis, Insights and Forecast - by Mounting Type
- 10.2.1. Recessed
- 10.2.2. Surface Mount
- 10.3. Market Analysis, Insights and Forecast - by End-user Industry
- 10.3.1. Healthcare & Life Sciences
- 10.3.2. Electronics and Semiconductor
- 10.3.3. Food & Beverage
- 10.3.4. Other End-user Industries
- 10.1. Market Analysis, Insights and Forecast - by Light Source
- 11. North America Cleanroom Lighting Industry Analysis, Insights and Forecast, 2019-2031
- 11.1. Market Analysis, Insights and Forecast - By Country/Sub-region
- 11.1.1.
- 12. Europe Cleanroom Lighting Industry Analysis, Insights and Forecast, 2019-2031
- 12.1. Market Analysis, Insights and Forecast - By Country/Sub-region
- 12.1.1.
- 13. Asia Pacific Cleanroom Lighting Industry Analysis, Insights and Forecast, 2019-2031
- 13.1. Market Analysis, Insights and Forecast - By Country/Sub-region
- 13.1.1.
- 14. Rest of the World Cleanroom Lighting Industry Analysis, Insights and Forecast, 2019-2031
- 14.1. Market Analysis, Insights and Forecast - By Country/Sub-region
- 14.1.1.
- 15. Competitive Analysis
- 15.1. Global Market Share Analysis 2024
- 15.2. Company Profiles
- 15.2.1 Terra Universal Inc
- 15.2.1.1. Overview
- 15.2.1.2. Products
- 15.2.1.3. SWOT Analysis
- 15.2.1.4. Recent Developments
- 15.2.1.5. Financials (Based on Availability)
- 15.2.2 Signify Holding
- 15.2.2.1. Overview
- 15.2.2.2. Products
- 15.2.2.3. SWOT Analysis
- 15.2.2.4. Recent Developments
- 15.2.2.5. Financials (Based on Availability)
- 15.2.3 Eaton Corporation Inc
- 15.2.3.1. Overview
- 15.2.3.2. Products
- 15.2.3.3. SWOT Analysis
- 15.2.3.4. Recent Developments
- 15.2.3.5. Financials (Based on Availability)
- 15.2.4 Wipro Lighting
- 15.2.4.1. Overview
- 15.2.4.2. Products
- 15.2.4.3. SWOT Analysis
- 15.2.4.4. Recent Developments
- 15.2.4.5. Financials (Based on Availability)
- 15.2.5 Kenall Manufacturing
- 15.2.5.1. Overview
- 15.2.5.2. Products
- 15.2.5.3. SWOT Analysis
- 15.2.5.4. Recent Developments
- 15.2.5.5. Financials (Based on Availability)
- 15.2.6 Solite Europe Ltd
- 15.2.6.1. Overview
- 15.2.6.2. Products
- 15.2.6.3. SWOT Analysis
- 15.2.6.4. Recent Developments
- 15.2.6.5. Financials (Based on Availability)
- 15.2.7 LUG Light Factory Sp z o o
- 15.2.7.1. Overview
- 15.2.7.2. Products
- 15.2.7.3. SWOT Analysis
- 15.2.7.4. Recent Developments
- 15.2.7.5. Financials (Based on Availability)
- 15.2.8 AB Fagerhult*List Not Exhaustive
- 15.2.8.1. Overview
- 15.2.8.2. Products
- 15.2.8.3. SWOT Analysis
- 15.2.8.4. Recent Developments
- 15.2.8.5. Financials (Based on Availability)
- 15.2.9 Crompton Greaves Consumer Electricals Ltd
- 15.2.9.1. Overview
- 15.2.9.2. Products
- 15.2.9.3. SWOT Analysis
- 15.2.9.4. Recent Developments
- 15.2.9.5. Financials (Based on Availability)
- 15.2.10 Paramount Industries
- 15.2.10.1. Overview
- 15.2.10.2. Products
- 15.2.10.3. SWOT Analysis
- 15.2.10.4. Recent Developments
- 15.2.10.5. Financials (Based on Availability)
- 15.2.1 Terra Universal Inc
List of Figures
- Figure 1: Global Cleanroom Lighting Industry Revenue Breakdown (Million, %) by Region 2024 & 2032
- Figure 2: North America Cleanroom Lighting Industry Revenue (Million), by Country 2024 & 2032
- Figure 3: North America Cleanroom Lighting Industry Revenue Share (%), by Country 2024 & 2032
- Figure 4: Europe Cleanroom Lighting Industry Revenue (Million), by Country 2024 & 2032
- Figure 5: Europe Cleanroom Lighting Industry Revenue Share (%), by Country 2024 & 2032
- Figure 6: Asia Pacific Cleanroom Lighting Industry Revenue (Million), by Country 2024 & 2032
- Figure 7: Asia Pacific Cleanroom Lighting Industry Revenue Share (%), by Country 2024 & 2032
- Figure 8: Rest of the World Cleanroom Lighting Industry Revenue (Million), by Country 2024 & 2032
- Figure 9: Rest of the World Cleanroom Lighting Industry Revenue Share (%), by Country 2024 & 2032
- Figure 10: North America Cleanroom Lighting Industry Revenue (Million), by Light Source 2024 & 2032
- Figure 11: North America Cleanroom Lighting Industry Revenue Share (%), by Light Source 2024 & 2032
- Figure 12: North America Cleanroom Lighting Industry Revenue (Million), by Mounting Type 2024 & 2032
- Figure 13: North America Cleanroom Lighting Industry Revenue Share (%), by Mounting Type 2024 & 2032
- Figure 14: North America Cleanroom Lighting Industry Revenue (Million), by End-user Industry 2024 & 2032
- Figure 15: North America Cleanroom Lighting Industry Revenue Share (%), by End-user Industry 2024 & 2032
- Figure 16: North America Cleanroom Lighting Industry Revenue (Million), by Country 2024 & 2032
- Figure 17: North America Cleanroom Lighting Industry Revenue Share (%), by Country 2024 & 2032
- Figure 18: Europe Cleanroom Lighting Industry Revenue (Million), by Light Source 2024 & 2032
- Figure 19: Europe Cleanroom Lighting Industry Revenue Share (%), by Light Source 2024 & 2032
- Figure 20: Europe Cleanroom Lighting Industry Revenue (Million), by Mounting Type 2024 & 2032
- Figure 21: Europe Cleanroom Lighting Industry Revenue Share (%), by Mounting Type 2024 & 2032
- Figure 22: Europe Cleanroom Lighting Industry Revenue (Million), by End-user Industry 2024 & 2032
- Figure 23: Europe Cleanroom Lighting Industry Revenue Share (%), by End-user Industry 2024 & 2032
- Figure 24: Europe Cleanroom Lighting Industry Revenue (Million), by Country 2024 & 2032
- Figure 25: Europe Cleanroom Lighting Industry Revenue Share (%), by Country 2024 & 2032
- Figure 26: Asia Cleanroom Lighting Industry Revenue (Million), by Light Source 2024 & 2032
- Figure 27: Asia Cleanroom Lighting Industry Revenue Share (%), by Light Source 2024 & 2032
- Figure 28: Asia Cleanroom Lighting Industry Revenue (Million), by Mounting Type 2024 & 2032
- Figure 29: Asia Cleanroom Lighting Industry Revenue Share (%), by Mounting Type 2024 & 2032
- Figure 30: Asia Cleanroom Lighting Industry Revenue (Million), by End-user Industry 2024 & 2032
- Figure 31: Asia Cleanroom Lighting Industry Revenue Share (%), by End-user Industry 2024 & 2032
- Figure 32: Asia Cleanroom Lighting Industry Revenue (Million), by Country 2024 & 2032
- Figure 33: Asia Cleanroom Lighting Industry Revenue Share (%), by Country 2024 & 2032
- Figure 34: Latin America Cleanroom Lighting Industry Revenue (Million), by Light Source 2024 & 2032
- Figure 35: Latin America Cleanroom Lighting Industry Revenue Share (%), by Light Source 2024 & 2032
- Figure 36: Latin America Cleanroom Lighting Industry Revenue (Million), by Mounting Type 2024 & 2032
- Figure 37: Latin America Cleanroom Lighting Industry Revenue Share (%), by Mounting Type 2024 & 2032
- Figure 38: Latin America Cleanroom Lighting Industry Revenue (Million), by End-user Industry 2024 & 2032
- Figure 39: Latin America Cleanroom Lighting Industry Revenue Share (%), by End-user Industry 2024 & 2032
- Figure 40: Latin America Cleanroom Lighting Industry Revenue (Million), by Country 2024 & 2032
- Figure 41: Latin America Cleanroom Lighting Industry Revenue Share (%), by Country 2024 & 2032
- Figure 42: Middle East and Africa Cleanroom Lighting Industry Revenue (Million), by Light Source 2024 & 2032
- Figure 43: Middle East and Africa Cleanroom Lighting Industry Revenue Share (%), by Light Source 2024 & 2032
- Figure 44: Middle East and Africa Cleanroom Lighting Industry Revenue (Million), by Mounting Type 2024 & 2032
- Figure 45: Middle East and Africa Cleanroom Lighting Industry Revenue Share (%), by Mounting Type 2024 & 2032
- Figure 46: Middle East and Africa Cleanroom Lighting Industry Revenue (Million), by End-user Industry 2024 & 2032
- Figure 47: Middle East and Africa Cleanroom Lighting Industry Revenue Share (%), by End-user Industry 2024 & 2032
- Figure 48: Middle East and Africa Cleanroom Lighting Industry Revenue (Million), by Country 2024 & 2032
- Figure 49: Middle East and Africa Cleanroom Lighting Industry Revenue Share (%), by Country 2024 & 2032
List of Tables
- Table 1: Global Cleanroom Lighting Industry Revenue Million Forecast, by Region 2019 & 2032
- Table 2: Global Cleanroom Lighting Industry Revenue Million Forecast, by Light Source 2019 & 2032
- Table 3: Global Cleanroom Lighting Industry Revenue Million Forecast, by Mounting Type 2019 & 2032
- Table 4: Global Cleanroom Lighting Industry Revenue Million Forecast, by End-user Industry 2019 & 2032
- Table 5: Global Cleanroom Lighting Industry Revenue Million Forecast, by Region 2019 & 2032
- Table 6: Global Cleanroom Lighting Industry Revenue Million Forecast, by Country 2019 & 2032
- Table 7: Cleanroom Lighting Industry Revenue (Million) Forecast, by Application 2019 & 2032
- Table 8: Global Cleanroom Lighting Industry Revenue Million Forecast, by Country 2019 & 2032
- Table 9: Cleanroom Lighting Industry Revenue (Million) Forecast, by Application 2019 & 2032
- Table 10: Global Cleanroom Lighting Industry Revenue Million Forecast, by Country 2019 & 2032
- Table 11: Cleanroom Lighting Industry Revenue (Million) Forecast, by Application 2019 & 2032
- Table 12: Global Cleanroom Lighting Industry Revenue Million Forecast, by Country 2019 & 2032
- Table 13: Cleanroom Lighting Industry Revenue (Million) Forecast, by Application 2019 & 2032
- Table 14: Global Cleanroom Lighting Industry Revenue Million Forecast, by Light Source 2019 & 2032
- Table 15: Global Cleanroom Lighting Industry Revenue Million Forecast, by Mounting Type 2019 & 2032
- Table 16: Global Cleanroom Lighting Industry Revenue Million Forecast, by End-user Industry 2019 & 2032
- Table 17: Global Cleanroom Lighting Industry Revenue Million Forecast, by Country 2019 & 2032
- Table 18: Global Cleanroom Lighting Industry Revenue Million Forecast, by Light Source 2019 & 2032
- Table 19: Global Cleanroom Lighting Industry Revenue Million Forecast, by Mounting Type 2019 & 2032
- Table 20: Global Cleanroom Lighting Industry Revenue Million Forecast, by End-user Industry 2019 & 2032
- Table 21: Global Cleanroom Lighting Industry Revenue Million Forecast, by Country 2019 & 2032
- Table 22: Global Cleanroom Lighting Industry Revenue Million Forecast, by Light Source 2019 & 2032
- Table 23: Global Cleanroom Lighting Industry Revenue Million Forecast, by Mounting Type 2019 & 2032
- Table 24: Global Cleanroom Lighting Industry Revenue Million Forecast, by End-user Industry 2019 & 2032
- Table 25: Global Cleanroom Lighting Industry Revenue Million Forecast, by Country 2019 & 2032
- Table 26: Global Cleanroom Lighting Industry Revenue Million Forecast, by Light Source 2019 & 2032
- Table 27: Global Cleanroom Lighting Industry Revenue Million Forecast, by Mounting Type 2019 & 2032
- Table 28: Global Cleanroom Lighting Industry Revenue Million Forecast, by End-user Industry 2019 & 2032
- Table 29: Global Cleanroom Lighting Industry Revenue Million Forecast, by Country 2019 & 2032
- Table 30: Global Cleanroom Lighting Industry Revenue Million Forecast, by Light Source 2019 & 2032
- Table 31: Global Cleanroom Lighting Industry Revenue Million Forecast, by Mounting Type 2019 & 2032
- Table 32: Global Cleanroom Lighting Industry Revenue Million Forecast, by End-user Industry 2019 & 2032
- Table 33: Global Cleanroom Lighting Industry Revenue Million Forecast, by Country 2019 & 2032
Frequently Asked Questions
1. What is the projected Compound Annual Growth Rate (CAGR) of the Cleanroom Lighting Industry?
The projected CAGR is approximately 5.49%.
2. Which companies are prominent players in the Cleanroom Lighting Industry?
Key companies in the market include Terra Universal Inc, Signify Holding, Eaton Corporation Inc, Wipro Lighting, Kenall Manufacturing, Solite Europe Ltd, LUG Light Factory Sp z o o, AB Fagerhult*List Not Exhaustive, Crompton Greaves Consumer Electricals Ltd, Paramount Industries.
3. What are the main segments of the Cleanroom Lighting Industry?
The market segments include Light Source, Mounting Type, End-user Industry.
4. Can you provide details about the market size?
The market size is estimated to be USD 0.84 Million as of 2022.
5. What are some drivers contributing to market growth?
Stringent Regulations in Healthcare and Food Processing Industries; Rising Demand for Sterile Manufacturing Areas in Pharmaceuticals Industry.
6. What are the notable trends driving market growth?
Healthcare and Life Sciences Segment is Expected to Witness Significant Growth.
7. Are there any restraints impacting market growth?
High Cost Associated With Cleanrooms and their Operations.
8. Can you provide examples of recent developments in the market?
December 2022: Nicomac Taikisha Cleanrooms announced an investment of INR 126.2 crore (USD 15.2 million) to set up its third manufacturing facility in Hyderabad, India. Taikisha is a significant provider of cleanrooms and HVAC systems for electronic devices, the food industry, lithium-ion battery manufacturing, and hydroponic farming. The company also manufactures and constructs cleanroom facilities for pharmaceuticals and vaccines in sterile industries.
9. What pricing options are available for accessing the report?
Pricing options include single-user, multi-user, and enterprise licenses priced at USD 4750, USD 5250, and USD 8750 respectively.
10. Is the market size provided in terms of value or volume?
The market size is provided in terms of value, measured in Million.
11. Are there any specific market keywords associated with the report?
Yes, the market keyword associated with the report is "Cleanroom Lighting Industry," which aids in identifying and referencing the specific market segment covered.
12. How do I determine which pricing option suits my needs best?
The pricing options vary based on user requirements and access needs. Individual users may opt for single-user licenses, while businesses requiring broader access may choose multi-user or enterprise licenses for cost-effective access to the report.
13. Are there any additional resources or data provided in the Cleanroom Lighting Industry report?
While the report offers comprehensive insights, it's advisable to review the specific contents or supplementary materials provided to ascertain if additional resources or data are available.
14. How can I stay updated on further developments or reports in the Cleanroom Lighting Industry?
To stay informed about further developments, trends, and reports in the Cleanroom Lighting Industry, consider subscribing to industry newsletters, following relevant companies and organizations, or regularly checking reputable industry news sources and publications.
Methodology
Step 1 - Identification of Relevant Samples Size from Population Database


Step 2 - Approaches for Defining Global Market Size (Value, Volume* & Price*)

Note*: In applicable scenarios
Step 3 - Data Sources
Primary Research
- Web Analytics
- Survey Reports
- Research Institute
- Latest Research Reports
- Opinion Leaders
Secondary Research
- Annual Reports
- White Paper
- Latest Press Release
- Industry Association
- Paid Database
- Investor Presentations

Step 4 - Data Triangulation
Involves using different sources of information in order to increase the validity of a study
These sources are likely to be stakeholders in a program - participants, other researchers, program staff, other community members, and so on.
Then we put all data in single framework & apply various statistical tools to find out the dynamic on the market.
During the analysis stage, feedback from the stakeholder groups would be compared to determine areas of agreement as well as areas of divergence


