
Key Insights
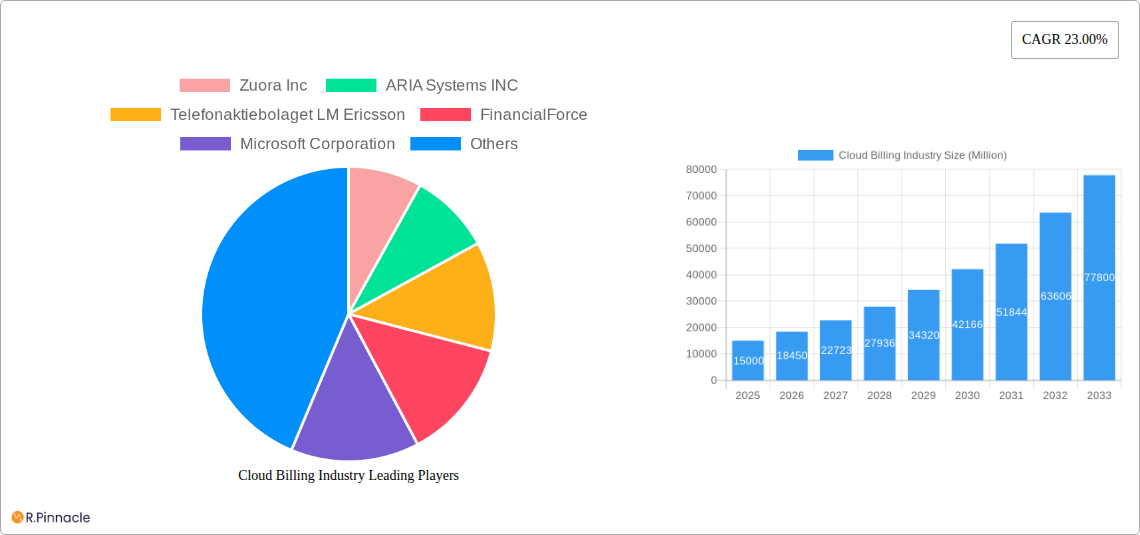
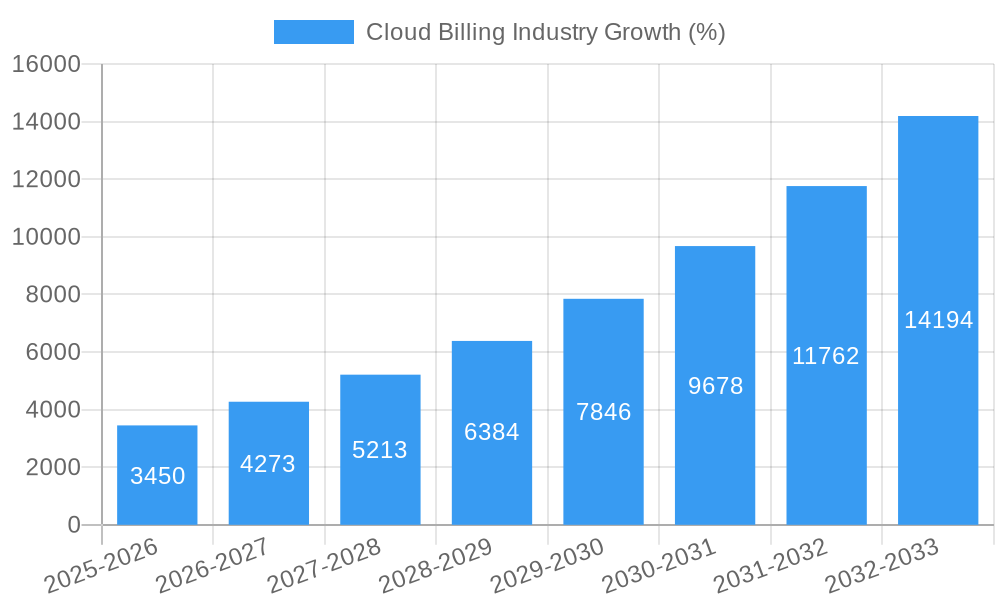
The cloud billing market is experiencing robust growth, driven by the increasing adoption of cloud computing services across diverse sectors. The market's Compound Annual Growth Rate (CAGR) of 23% from 2019 to 2024 suggests a significant expansion, projected to continue into the forecast period (2025-2033). Key drivers include the need for flexible and scalable billing solutions to manage complex cloud usage, the rise of subscription-based business models, and the increasing demand for real-time billing and analytics. The diverse range of end-user industries adopting cloud billing, including retail, power & energy, healthcare, telecommunications, and BFSI, fuels this expansion. Furthermore, the market is segmented by deployment (public, private, hybrid cloud) and component (platform, services), offering various solutions tailored to specific organizational needs. The competitive landscape is dynamic, with established players like Microsoft, Amazon, and Oracle alongside specialized cloud billing providers like Zuora and Aria Systems. Geographic growth is widespread, with North America currently holding a significant market share, but regions like Asia Pacific are expected to demonstrate rapid growth fueled by increasing cloud adoption and digital transformation initiatives. The shift towards hybrid and multi-cloud environments necessitates advanced billing capabilities, further driving market expansion.
The continued growth trajectory hinges on several factors. Successful navigation of the evolving regulatory landscape surrounding data privacy and security will be crucial. Furthermore, the market's success will depend on the ongoing development of innovative solutions that effectively address the complexities of billing for diverse cloud consumption models, including serverless computing and containerization. The ability to integrate seamlessly with existing enterprise resource planning (ERP) systems and provide insightful data analytics will also play a significant role in shaping market adoption. Competition among providers is likely to intensify, focusing on enhanced features, superior customer support, and competitive pricing strategies. This competitive pressure will benefit consumers, leading to further market growth and sophistication in cloud billing solutions.
Cloud Billing Industry Report: A Comprehensive Analysis (2019-2033)
This comprehensive report provides an in-depth analysis of the Cloud Billing Industry, projecting a market size of $XX Million by 2033. We examine market structure, dynamics, key players, and future growth opportunities, offering actionable insights for industry professionals. The report covers the period 2019-2033, with a base year of 2025 and a forecast period of 2025-2033.
Cloud Billing Industry Market Structure & Innovation Trends
The Cloud Billing industry is characterized by a moderately concentrated market structure, with a few major players holding significant market share. Zuora Inc, ARIA Systems INC, and others mentioned in this report dominate the space but face intense competition from cloud giants like Microsoft and Amazon. Market share is estimated to be distributed as follows: Zuora Inc (XX%), ARIA Systems INC (XX%), Microsoft Corporation (XX%), Amazon Web Services Inc (XX%), others (XX%). This distribution is subject to constant shifts with the pace of M&A activities, with deal values ranging from $XX Million to $XX Million in recent years. Innovation is driven by the need for greater automation, enhanced security, improved scalability, and real-time billing capabilities. Regulatory frameworks, particularly around data privacy and security, play a significant role. The industry is also impacted by the rise of alternative billing platforms and services.
- Key Market Drivers: Increasing adoption of cloud services, the need for flexible billing models, improving software solutions, better customer service.
- M&A Activity: A moderate level of mergers and acquisitions has shaped the market landscape, leading to consolidation and the emergence of more comprehensive solutions.
- Regulatory Landscape: Stringent data privacy regulations influence vendors’ strategies, influencing system architecture and data handling practices.
- Substitutes: While fully replacing cloud-billing systems is difficult, companies are exploring alternative approaches to streamline internal billing processes.
- End-User Demographics: The user base spans diverse industries, with a concentration in BFSI, Telecommunications, and other enterprise users.
Cloud Billing Industry Market Dynamics & Trends
The Cloud Billing Industry is experiencing robust growth, with a CAGR of XX% projected from 2025 to 2033. This growth is fueled by several key factors, including the ever-increasing adoption of cloud computing, the demand for flexible and scalable billing solutions, and the growing need for real-time billing capabilities across various industries. Technological disruptions, such as the emergence of AI-powered billing platforms, are further driving market expansion. Consumer preferences are shifting towards solutions offering greater transparency, automation, and integration with existing enterprise systems. Competitive dynamics are intense, with established players and new entrants vying for market share. Market penetration varies across different end-user industries, with BFSI and Telecommunications showing higher adoption rates.
Dominant Regions & Segments in Cloud Billing Industry
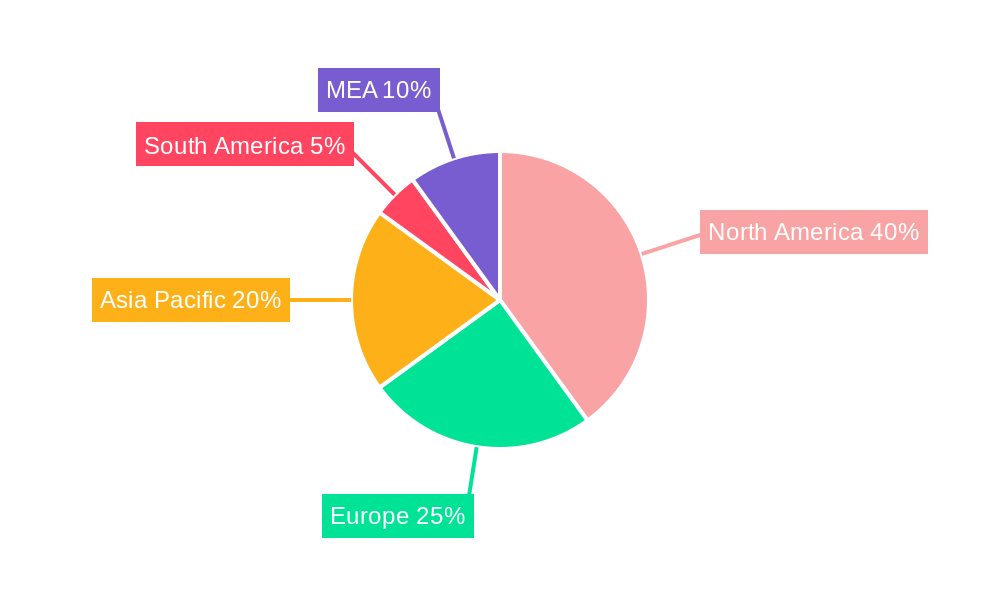
The North American region holds the largest market share in the Cloud Billing Industry, primarily due to high cloud adoption rates and a robust technology infrastructure. Within the industry segments:
- By End-user Industry: The BFSI and Telecommunications sectors dominate, driven by high transaction volumes and complex billing requirements. Retail and Healthcare are also growing rapidly.
- By Deployment: Public cloud deployment is the most prevalent model, benefiting from its scalability and cost-effectiveness. However, hybrid cloud solutions are gaining traction due to security and compliance needs.
- By Component: Services account for the largest revenue share, propelled by increased demand for managed services and specialized billing support.
Key Drivers by Region/Segment:
- North America: Strong technology ecosystem, high cloud adoption, well-established IT infrastructure.
- Europe: Increasing cloud adoption across various industries, driven by digital transformation initiatives.
- BFSI: High transaction volumes, complex pricing models, and regulatory compliance demands.
- Telecommunications: Complex billing structures, need for real-time billing, and customer churn management.
Cloud Billing Industry Product Innovations
Recent product innovations focus on AI-powered automation, enhanced security features, improved integration with existing ERP systems, and the ability to support dynamic pricing models. This allows for increased flexibility, reduced operational costs, and better customer experiences. The market is seeing a move towards more personalized billing experiences and advanced analytics capabilities to aid businesses in managing and analyzing their revenue streams.
Report Scope & Segmentation Analysis
This report provides a detailed analysis of the Cloud Billing Industry, segmented by end-user industry (Retail, Power & Energy, Healthcare, Telecommunications, BFSI, Other), deployment (Public Cloud, Private Cloud, Hybrid Cloud), and component (Platform, Services). Each segment is analyzed based on its market size, growth rate, and competitive landscape. The report presents detailed growth projections for each segment, highlighting areas of high growth potential and emerging opportunities.
Key Drivers of Cloud Billing Industry Growth
The Cloud Billing industry's growth is propelled by several factors:
- Increased cloud adoption: Enterprises are increasingly migrating to cloud environments, driving demand for efficient billing solutions.
- Demand for flexible billing models: Businesses need adaptable billing systems to accommodate various pricing structures and customer needs.
- Technological advancements: AI-powered billing platforms and advanced analytics capabilities are improving efficiency and decision-making.
- Growing need for real-time billing: Businesses need real-time billing visibility for better revenue management and customer experience.
Challenges in the Cloud Billing Industry Sector
The Cloud Billing industry faces several challenges:
- Data security and privacy concerns: Ensuring data security and compliance with various regulations is critical.
- Integration complexities: Integrating billing systems with existing enterprise systems can be challenging.
- Competitive pressures: The industry is highly competitive, with established players and new entrants vying for market share. This leads to pricing pressures and the need for constant innovation.
Emerging Opportunities in Cloud Billing Industry
Several opportunities exist for growth within the Cloud Billing Industry:
- Expansion into new markets: Untapped markets in developing economies offer significant potential for growth.
- Development of innovative billing models: Subscription-based models and usage-based pricing are gaining traction.
- Integration with other technologies: Integrating with AI, machine learning, and blockchain offers additional value.
Leading Players in the Cloud Billing Industry Market
- Zuora Inc
- ARIA Systems INC
- Telefonaktiebolaget LM Ericsson
- FinancialForce
- Microsoft Corporation
- Amazon Web Services Inc
- Oracle Corporation
- BillingPlatform
- Orbitera Inc
- SAP SE
Key Developments in Cloud Billing Industry
- January 2023: Input 1 enhances its premium financing and billing platform, expanding its reach within the insurance sector.
- March 2022: Amazon Web Services launches AWS Billing Conductor, offering personalized pricing and cost insights.
- March 2022: Rentokil North America adopts Aria Systems' cloud-based billing platform to streamline operations and support growth.
Future Outlook for Cloud Billing Industry Market
The Cloud Billing Industry is poised for continued strong growth, driven by ongoing cloud adoption, technological advancements, and evolving business needs. The market will see increasing demand for AI-powered solutions, improved integration capabilities, and more sophisticated analytics features. Strategic partnerships and acquisitions will likely play a significant role in shaping the competitive landscape and driving innovation. The global market is projected to reach $XX Million by 2033, reflecting a sustained growth trajectory.
Cloud Billing Industry Segmentation
-
1. Deployment
- 1.1. Public Cloud
- 1.2. Private Cloud
- 1.3. Hybrid Cloud
-
2. Component
- 2.1. Platform
- 2.2. Services
-
3. End-user Industry
- 3.1. Retail
- 3.2. Power & Energy
- 3.3. Healthcare
- 3.4. Telecommunications
- 3.5. BFSI
- 3.6. Other End-user Industries
Cloud Billing Industry Segmentation By Geography
-
1. North America
- 1.1. United States
- 1.2. Canada
-
2. Europe
- 2.1. United Kingdom
- 2.2. Germany
- 2.3. France
- 2.4. Rest of Europe
-
3. Asia Pacific
- 3.1. China
- 3.2. India
- 3.3. South Korea
- 3.4. Rest of Asia Pacific
-
4. Latin America
- 4.1. Brazil
- 4.2. Mexico
- 4.3. Rest of Latin America
- 5. Middle East
-
6. United Arab Emirates
- 6.1. South Africa
- 6.2. Saudi Arabia
- 6.3. Rest of Middle East
Cloud Billing Industry REPORT HIGHLIGHTS
| Aspects | Details |
|---|---|
| Study Period | 2019-2033 |
| Base Year | 2024 |
| Estimated Year | 2025 |
| Forecast Period | 2025-2033 |
| Historical Period | 2019-2024 |
| Growth Rate | CAGR of 23.00% from 2019-2033 |
| Segmentation |
|
Table of Contents
- 1. Introduction
- 1.1. Research Scope
- 1.2. Market Segmentation
- 1.3. Research Methodology
- 1.4. Definitions and Assumptions
- 2. Executive Summary
- 2.1. Introduction
- 3. Market Dynamics
- 3.1. Introduction
- 3.2. Market Drivers
- 3.2.1. Increasing Adoption of Cloud Computing; Growth in E-commerce Platforms
- 3.3. Market Restrains
- 3.3.1. Transition From On-Premise to Cloud-Based Solutions; High Costs Involved and Data Privacy Issues
- 3.4. Market Trends
- 3.4.1. Retail Sector Expected to Show Maximum Application
- 4. Market Factor Analysis
- 4.1. Porters Five Forces
- 4.2. Supply/Value Chain
- 4.3. PESTEL analysis
- 4.4. Market Entropy
- 4.5. Patent/Trademark Analysis
- 5. Global Cloud Billing Industry Analysis, Insights and Forecast, 2019-2031
- 5.1. Market Analysis, Insights and Forecast - by Deployment
- 5.1.1. Public Cloud
- 5.1.2. Private Cloud
- 5.1.3. Hybrid Cloud
- 5.2. Market Analysis, Insights and Forecast - by Component
- 5.2.1. Platform
- 5.2.2. Services
- 5.3. Market Analysis, Insights and Forecast - by End-user Industry
- 5.3.1. Retail
- 5.3.2. Power & Energy
- 5.3.3. Healthcare
- 5.3.4. Telecommunications
- 5.3.5. BFSI
- 5.3.6. Other End-user Industries
- 5.4. Market Analysis, Insights and Forecast - by Region
- 5.4.1. North America
- 5.4.2. Europe
- 5.4.3. Asia Pacific
- 5.4.4. Latin America
- 5.4.5. Middle East
- 5.4.6. United Arab Emirates
- 5.1. Market Analysis, Insights and Forecast - by Deployment
- 6. North America Cloud Billing Industry Analysis, Insights and Forecast, 2019-2031
- 6.1. Market Analysis, Insights and Forecast - by Deployment
- 6.1.1. Public Cloud
- 6.1.2. Private Cloud
- 6.1.3. Hybrid Cloud
- 6.2. Market Analysis, Insights and Forecast - by Component
- 6.2.1. Platform
- 6.2.2. Services
- 6.3. Market Analysis, Insights and Forecast - by End-user Industry
- 6.3.1. Retail
- 6.3.2. Power & Energy
- 6.3.3. Healthcare
- 6.3.4. Telecommunications
- 6.3.5. BFSI
- 6.3.6. Other End-user Industries
- 6.1. Market Analysis, Insights and Forecast - by Deployment
- 7. Europe Cloud Billing Industry Analysis, Insights and Forecast, 2019-2031
- 7.1. Market Analysis, Insights and Forecast - by Deployment
- 7.1.1. Public Cloud
- 7.1.2. Private Cloud
- 7.1.3. Hybrid Cloud
- 7.2. Market Analysis, Insights and Forecast - by Component
- 7.2.1. Platform
- 7.2.2. Services
- 7.3. Market Analysis, Insights and Forecast - by End-user Industry
- 7.3.1. Retail
- 7.3.2. Power & Energy
- 7.3.3. Healthcare
- 7.3.4. Telecommunications
- 7.3.5. BFSI
- 7.3.6. Other End-user Industries
- 7.1. Market Analysis, Insights and Forecast - by Deployment
- 8. Asia Pacific Cloud Billing Industry Analysis, Insights and Forecast, 2019-2031
- 8.1. Market Analysis, Insights and Forecast - by Deployment
- 8.1.1. Public Cloud
- 8.1.2. Private Cloud
- 8.1.3. Hybrid Cloud
- 8.2. Market Analysis, Insights and Forecast - by Component
- 8.2.1. Platform
- 8.2.2. Services
- 8.3. Market Analysis, Insights and Forecast - by End-user Industry
- 8.3.1. Retail
- 8.3.2. Power & Energy
- 8.3.3. Healthcare
- 8.3.4. Telecommunications
- 8.3.5. BFSI
- 8.3.6. Other End-user Industries
- 8.1. Market Analysis, Insights and Forecast - by Deployment
- 9. Latin America Cloud Billing Industry Analysis, Insights and Forecast, 2019-2031
- 9.1. Market Analysis, Insights and Forecast - by Deployment
- 9.1.1. Public Cloud
- 9.1.2. Private Cloud
- 9.1.3. Hybrid Cloud
- 9.2. Market Analysis, Insights and Forecast - by Component
- 9.2.1. Platform
- 9.2.2. Services
- 9.3. Market Analysis, Insights and Forecast - by End-user Industry
- 9.3.1. Retail
- 9.3.2. Power & Energy
- 9.3.3. Healthcare
- 9.3.4. Telecommunications
- 9.3.5. BFSI
- 9.3.6. Other End-user Industries
- 9.1. Market Analysis, Insights and Forecast - by Deployment
- 10. Middle East Cloud Billing Industry Analysis, Insights and Forecast, 2019-2031
- 10.1. Market Analysis, Insights and Forecast - by Deployment
- 10.1.1. Public Cloud
- 10.1.2. Private Cloud
- 10.1.3. Hybrid Cloud
- 10.2. Market Analysis, Insights and Forecast - by Component
- 10.2.1. Platform
- 10.2.2. Services
- 10.3. Market Analysis, Insights and Forecast - by End-user Industry
- 10.3.1. Retail
- 10.3.2. Power & Energy
- 10.3.3. Healthcare
- 10.3.4. Telecommunications
- 10.3.5. BFSI
- 10.3.6. Other End-user Industries
- 10.1. Market Analysis, Insights and Forecast - by Deployment
- 11. United Arab Emirates Cloud Billing Industry Analysis, Insights and Forecast, 2019-2031
- 11.1. Market Analysis, Insights and Forecast - by Deployment
- 11.1.1. Public Cloud
- 11.1.2. Private Cloud
- 11.1.3. Hybrid Cloud
- 11.2. Market Analysis, Insights and Forecast - by Component
- 11.2.1. Platform
- 11.2.2. Services
- 11.3. Market Analysis, Insights and Forecast - by End-user Industry
- 11.3.1. Retail
- 11.3.2. Power & Energy
- 11.3.3. Healthcare
- 11.3.4. Telecommunications
- 11.3.5. BFSI
- 11.3.6. Other End-user Industries
- 11.1. Market Analysis, Insights and Forecast - by Deployment
- 12. North America Cloud Billing Industry Analysis, Insights and Forecast, 2019-2031
- 12.1. Market Analysis, Insights and Forecast - By Country/Sub-region
- 12.1.1 United States
- 12.1.2 Canada
- 12.1.3 Mexico
- 13. Europe Cloud Billing Industry Analysis, Insights and Forecast, 2019-2031
- 13.1. Market Analysis, Insights and Forecast - By Country/Sub-region
- 13.1.1 Germany
- 13.1.2 United Kingdom
- 13.1.3 France
- 13.1.4 Spain
- 13.1.5 Italy
- 13.1.6 Spain
- 13.1.7 Belgium
- 13.1.8 Netherland
- 13.1.9 Nordics
- 13.1.10 Rest of Europe
- 14. Asia Pacific Cloud Billing Industry Analysis, Insights and Forecast, 2019-2031
- 14.1. Market Analysis, Insights and Forecast - By Country/Sub-region
- 14.1.1 China
- 14.1.2 Japan
- 14.1.3 India
- 14.1.4 South Korea
- 14.1.5 Southeast Asia
- 14.1.6 Australia
- 14.1.7 Indonesia
- 14.1.8 Phillipes
- 14.1.9 Singapore
- 14.1.10 Thailandc
- 14.1.11 Rest of Asia Pacific
- 15. South America Cloud Billing Industry Analysis, Insights and Forecast, 2019-2031
- 15.1. Market Analysis, Insights and Forecast - By Country/Sub-region
- 15.1.1 Brazil
- 15.1.2 Argentina
- 15.1.3 Peru
- 15.1.4 Chile
- 15.1.5 Colombia
- 15.1.6 Ecuador
- 15.1.7 Venezuela
- 15.1.8 Rest of South America
- 16. North America Cloud Billing Industry Analysis, Insights and Forecast, 2019-2031
- 16.1. Market Analysis, Insights and Forecast - By Country/Sub-region
- 16.1.1 United States
- 16.1.2 Canada
- 16.1.3 Mexico
- 17. MEA Cloud Billing Industry Analysis, Insights and Forecast, 2019-2031
- 17.1. Market Analysis, Insights and Forecast - By Country/Sub-region
- 17.1.1 United Arab Emirates
- 17.1.2 Saudi Arabia
- 17.1.3 South Africa
- 17.1.4 Rest of Middle East and Africa
- 18. Competitive Analysis
- 18.1. Global Market Share Analysis 2024
- 18.2. Company Profiles
- 18.2.1 Zuora Inc
- 18.2.1.1. Overview
- 18.2.1.2. Products
- 18.2.1.3. SWOT Analysis
- 18.2.1.4. Recent Developments
- 18.2.1.5. Financials (Based on Availability)
- 18.2.2 ARIA Systems INC
- 18.2.2.1. Overview
- 18.2.2.2. Products
- 18.2.2.3. SWOT Analysis
- 18.2.2.4. Recent Developments
- 18.2.2.5. Financials (Based on Availability)
- 18.2.3 Telefonaktiebolaget LM Ericsson
- 18.2.3.1. Overview
- 18.2.3.2. Products
- 18.2.3.3. SWOT Analysis
- 18.2.3.4. Recent Developments
- 18.2.3.5. Financials (Based on Availability)
- 18.2.4 FinancialForce
- 18.2.4.1. Overview
- 18.2.4.2. Products
- 18.2.4.3. SWOT Analysis
- 18.2.4.4. Recent Developments
- 18.2.4.5. Financials (Based on Availability)
- 18.2.5 Microsoft Corporation
- 18.2.5.1. Overview
- 18.2.5.2. Products
- 18.2.5.3. SWOT Analysis
- 18.2.5.4. Recent Developments
- 18.2.5.5. Financials (Based on Availability)
- 18.2.6 Amazon Web Services Inc
- 18.2.6.1. Overview
- 18.2.6.2. Products
- 18.2.6.3. SWOT Analysis
- 18.2.6.4. Recent Developments
- 18.2.6.5. Financials (Based on Availability)
- 18.2.7 Oracle Corporation
- 18.2.7.1. Overview
- 18.2.7.2. Products
- 18.2.7.3. SWOT Analysis
- 18.2.7.4. Recent Developments
- 18.2.7.5. Financials (Based on Availability)
- 18.2.8 BillingPlatform
- 18.2.8.1. Overview
- 18.2.8.2. Products
- 18.2.8.3. SWOT Analysis
- 18.2.8.4. Recent Developments
- 18.2.8.5. Financials (Based on Availability)
- 18.2.9 Orbitera Inc
- 18.2.9.1. Overview
- 18.2.9.2. Products
- 18.2.9.3. SWOT Analysis
- 18.2.9.4. Recent Developments
- 18.2.9.5. Financials (Based on Availability)
- 18.2.10 SAP SE
- 18.2.10.1. Overview
- 18.2.10.2. Products
- 18.2.10.3. SWOT Analysis
- 18.2.10.4. Recent Developments
- 18.2.10.5. Financials (Based on Availability)
- 18.2.1 Zuora Inc
List of Figures
- Figure 1: Global Cloud Billing Industry Revenue Breakdown (Million, %) by Region 2024 & 2032
- Figure 2: Global Cloud Billing Industry Volume Breakdown (K Unit, %) by Region 2024 & 2032
- Figure 3: North America Cloud Billing Industry Revenue (Million), by Country 2024 & 2032
- Figure 4: North America Cloud Billing Industry Volume (K Unit), by Country 2024 & 2032
- Figure 5: North America Cloud Billing Industry Revenue Share (%), by Country 2024 & 2032
- Figure 6: North America Cloud Billing Industry Volume Share (%), by Country 2024 & 2032
- Figure 7: Europe Cloud Billing Industry Revenue (Million), by Country 2024 & 2032
- Figure 8: Europe Cloud Billing Industry Volume (K Unit), by Country 2024 & 2032
- Figure 9: Europe Cloud Billing Industry Revenue Share (%), by Country 2024 & 2032
- Figure 10: Europe Cloud Billing Industry Volume Share (%), by Country 2024 & 2032
- Figure 11: Asia Pacific Cloud Billing Industry Revenue (Million), by Country 2024 & 2032
- Figure 12: Asia Pacific Cloud Billing Industry Volume (K Unit), by Country 2024 & 2032
- Figure 13: Asia Pacific Cloud Billing Industry Revenue Share (%), by Country 2024 & 2032
- Figure 14: Asia Pacific Cloud Billing Industry Volume Share (%), by Country 2024 & 2032
- Figure 15: South America Cloud Billing Industry Revenue (Million), by Country 2024 & 2032
- Figure 16: South America Cloud Billing Industry Volume (K Unit), by Country 2024 & 2032
- Figure 17: South America Cloud Billing Industry Revenue Share (%), by Country 2024 & 2032
- Figure 18: South America Cloud Billing Industry Volume Share (%), by Country 2024 & 2032
- Figure 19: North America Cloud Billing Industry Revenue (Million), by Country 2024 & 2032
- Figure 20: North America Cloud Billing Industry Volume (K Unit), by Country 2024 & 2032
- Figure 21: North America Cloud Billing Industry Revenue Share (%), by Country 2024 & 2032
- Figure 22: North America Cloud Billing Industry Volume Share (%), by Country 2024 & 2032
- Figure 23: MEA Cloud Billing Industry Revenue (Million), by Country 2024 & 2032
- Figure 24: MEA Cloud Billing Industry Volume (K Unit), by Country 2024 & 2032
- Figure 25: MEA Cloud Billing Industry Revenue Share (%), by Country 2024 & 2032
- Figure 26: MEA Cloud Billing Industry Volume Share (%), by Country 2024 & 2032
- Figure 27: North America Cloud Billing Industry Revenue (Million), by Deployment 2024 & 2032
- Figure 28: North America Cloud Billing Industry Volume (K Unit), by Deployment 2024 & 2032
- Figure 29: North America Cloud Billing Industry Revenue Share (%), by Deployment 2024 & 2032
- Figure 30: North America Cloud Billing Industry Volume Share (%), by Deployment 2024 & 2032
- Figure 31: North America Cloud Billing Industry Revenue (Million), by Component 2024 & 2032
- Figure 32: North America Cloud Billing Industry Volume (K Unit), by Component 2024 & 2032
- Figure 33: North America Cloud Billing Industry Revenue Share (%), by Component 2024 & 2032
- Figure 34: North America Cloud Billing Industry Volume Share (%), by Component 2024 & 2032
- Figure 35: North America Cloud Billing Industry Revenue (Million), by End-user Industry 2024 & 2032
- Figure 36: North America Cloud Billing Industry Volume (K Unit), by End-user Industry 2024 & 2032
- Figure 37: North America Cloud Billing Industry Revenue Share (%), by End-user Industry 2024 & 2032
- Figure 38: North America Cloud Billing Industry Volume Share (%), by End-user Industry 2024 & 2032
- Figure 39: North America Cloud Billing Industry Revenue (Million), by Country 2024 & 2032
- Figure 40: North America Cloud Billing Industry Volume (K Unit), by Country 2024 & 2032
- Figure 41: North America Cloud Billing Industry Revenue Share (%), by Country 2024 & 2032
- Figure 42: North America Cloud Billing Industry Volume Share (%), by Country 2024 & 2032
- Figure 43: Europe Cloud Billing Industry Revenue (Million), by Deployment 2024 & 2032
- Figure 44: Europe Cloud Billing Industry Volume (K Unit), by Deployment 2024 & 2032
- Figure 45: Europe Cloud Billing Industry Revenue Share (%), by Deployment 2024 & 2032
- Figure 46: Europe Cloud Billing Industry Volume Share (%), by Deployment 2024 & 2032
- Figure 47: Europe Cloud Billing Industry Revenue (Million), by Component 2024 & 2032
- Figure 48: Europe Cloud Billing Industry Volume (K Unit), by Component 2024 & 2032
- Figure 49: Europe Cloud Billing Industry Revenue Share (%), by Component 2024 & 2032
- Figure 50: Europe Cloud Billing Industry Volume Share (%), by Component 2024 & 2032
- Figure 51: Europe Cloud Billing Industry Revenue (Million), by End-user Industry 2024 & 2032
- Figure 52: Europe Cloud Billing Industry Volume (K Unit), by End-user Industry 2024 & 2032
- Figure 53: Europe Cloud Billing Industry Revenue Share (%), by End-user Industry 2024 & 2032
- Figure 54: Europe Cloud Billing Industry Volume Share (%), by End-user Industry 2024 & 2032
- Figure 55: Europe Cloud Billing Industry Revenue (Million), by Country 2024 & 2032
- Figure 56: Europe Cloud Billing Industry Volume (K Unit), by Country 2024 & 2032
- Figure 57: Europe Cloud Billing Industry Revenue Share (%), by Country 2024 & 2032
- Figure 58: Europe Cloud Billing Industry Volume Share (%), by Country 2024 & 2032
- Figure 59: Asia Pacific Cloud Billing Industry Revenue (Million), by Deployment 2024 & 2032
- Figure 60: Asia Pacific Cloud Billing Industry Volume (K Unit), by Deployment 2024 & 2032
- Figure 61: Asia Pacific Cloud Billing Industry Revenue Share (%), by Deployment 2024 & 2032
- Figure 62: Asia Pacific Cloud Billing Industry Volume Share (%), by Deployment 2024 & 2032
- Figure 63: Asia Pacific Cloud Billing Industry Revenue (Million), by Component 2024 & 2032
- Figure 64: Asia Pacific Cloud Billing Industry Volume (K Unit), by Component 2024 & 2032
- Figure 65: Asia Pacific Cloud Billing Industry Revenue Share (%), by Component 2024 & 2032
- Figure 66: Asia Pacific Cloud Billing Industry Volume Share (%), by Component 2024 & 2032
- Figure 67: Asia Pacific Cloud Billing Industry Revenue (Million), by End-user Industry 2024 & 2032
- Figure 68: Asia Pacific Cloud Billing Industry Volume (K Unit), by End-user Industry 2024 & 2032
- Figure 69: Asia Pacific Cloud Billing Industry Revenue Share (%), by End-user Industry 2024 & 2032
- Figure 70: Asia Pacific Cloud Billing Industry Volume Share (%), by End-user Industry 2024 & 2032
- Figure 71: Asia Pacific Cloud Billing Industry Revenue (Million), by Country 2024 & 2032
- Figure 72: Asia Pacific Cloud Billing Industry Volume (K Unit), by Country 2024 & 2032
- Figure 73: Asia Pacific Cloud Billing Industry Revenue Share (%), by Country 2024 & 2032
- Figure 74: Asia Pacific Cloud Billing Industry Volume Share (%), by Country 2024 & 2032
- Figure 75: Latin America Cloud Billing Industry Revenue (Million), by Deployment 2024 & 2032
- Figure 76: Latin America Cloud Billing Industry Volume (K Unit), by Deployment 2024 & 2032
- Figure 77: Latin America Cloud Billing Industry Revenue Share (%), by Deployment 2024 & 2032
- Figure 78: Latin America Cloud Billing Industry Volume Share (%), by Deployment 2024 & 2032
- Figure 79: Latin America Cloud Billing Industry Revenue (Million), by Component 2024 & 2032
- Figure 80: Latin America Cloud Billing Industry Volume (K Unit), by Component 2024 & 2032
- Figure 81: Latin America Cloud Billing Industry Revenue Share (%), by Component 2024 & 2032
- Figure 82: Latin America Cloud Billing Industry Volume Share (%), by Component 2024 & 2032
- Figure 83: Latin America Cloud Billing Industry Revenue (Million), by End-user Industry 2024 & 2032
- Figure 84: Latin America Cloud Billing Industry Volume (K Unit), by End-user Industry 2024 & 2032
- Figure 85: Latin America Cloud Billing Industry Revenue Share (%), by End-user Industry 2024 & 2032
- Figure 86: Latin America Cloud Billing Industry Volume Share (%), by End-user Industry 2024 & 2032
- Figure 87: Latin America Cloud Billing Industry Revenue (Million), by Country 2024 & 2032
- Figure 88: Latin America Cloud Billing Industry Volume (K Unit), by Country 2024 & 2032
- Figure 89: Latin America Cloud Billing Industry Revenue Share (%), by Country 2024 & 2032
- Figure 90: Latin America Cloud Billing Industry Volume Share (%), by Country 2024 & 2032
- Figure 91: Middle East Cloud Billing Industry Revenue (Million), by Deployment 2024 & 2032
- Figure 92: Middle East Cloud Billing Industry Volume (K Unit), by Deployment 2024 & 2032
- Figure 93: Middle East Cloud Billing Industry Revenue Share (%), by Deployment 2024 & 2032
- Figure 94: Middle East Cloud Billing Industry Volume Share (%), by Deployment 2024 & 2032
- Figure 95: Middle East Cloud Billing Industry Revenue (Million), by Component 2024 & 2032
- Figure 96: Middle East Cloud Billing Industry Volume (K Unit), by Component 2024 & 2032
- Figure 97: Middle East Cloud Billing Industry Revenue Share (%), by Component 2024 & 2032
- Figure 98: Middle East Cloud Billing Industry Volume Share (%), by Component 2024 & 2032
- Figure 99: Middle East Cloud Billing Industry Revenue (Million), by End-user Industry 2024 & 2032
- Figure 100: Middle East Cloud Billing Industry Volume (K Unit), by End-user Industry 2024 & 2032
- Figure 101: Middle East Cloud Billing Industry Revenue Share (%), by End-user Industry 2024 & 2032
- Figure 102: Middle East Cloud Billing Industry Volume Share (%), by End-user Industry 2024 & 2032
- Figure 103: Middle East Cloud Billing Industry Revenue (Million), by Country 2024 & 2032
- Figure 104: Middle East Cloud Billing Industry Volume (K Unit), by Country 2024 & 2032
- Figure 105: Middle East Cloud Billing Industry Revenue Share (%), by Country 2024 & 2032
- Figure 106: Middle East Cloud Billing Industry Volume Share (%), by Country 2024 & 2032
- Figure 107: United Arab Emirates Cloud Billing Industry Revenue (Million), by Deployment 2024 & 2032
- Figure 108: United Arab Emirates Cloud Billing Industry Volume (K Unit), by Deployment 2024 & 2032
- Figure 109: United Arab Emirates Cloud Billing Industry Revenue Share (%), by Deployment 2024 & 2032
- Figure 110: United Arab Emirates Cloud Billing Industry Volume Share (%), by Deployment 2024 & 2032
- Figure 111: United Arab Emirates Cloud Billing Industry Revenue (Million), by Component 2024 & 2032
- Figure 112: United Arab Emirates Cloud Billing Industry Volume (K Unit), by Component 2024 & 2032
- Figure 113: United Arab Emirates Cloud Billing Industry Revenue Share (%), by Component 2024 & 2032
- Figure 114: United Arab Emirates Cloud Billing Industry Volume Share (%), by Component 2024 & 2032
- Figure 115: United Arab Emirates Cloud Billing Industry Revenue (Million), by End-user Industry 2024 & 2032
- Figure 116: United Arab Emirates Cloud Billing Industry Volume (K Unit), by End-user Industry 2024 & 2032
- Figure 117: United Arab Emirates Cloud Billing Industry Revenue Share (%), by End-user Industry 2024 & 2032
- Figure 118: United Arab Emirates Cloud Billing Industry Volume Share (%), by End-user Industry 2024 & 2032
- Figure 119: United Arab Emirates Cloud Billing Industry Revenue (Million), by Country 2024 & 2032
- Figure 120: United Arab Emirates Cloud Billing Industry Volume (K Unit), by Country 2024 & 2032
- Figure 121: United Arab Emirates Cloud Billing Industry Revenue Share (%), by Country 2024 & 2032
- Figure 122: United Arab Emirates Cloud Billing Industry Volume Share (%), by Country 2024 & 2032
List of Tables
- Table 1: Global Cloud Billing Industry Revenue Million Forecast, by Region 2019 & 2032
- Table 2: Global Cloud Billing Industry Volume K Unit Forecast, by Region 2019 & 2032
- Table 3: Global Cloud Billing Industry Revenue Million Forecast, by Deployment 2019 & 2032
- Table 4: Global Cloud Billing Industry Volume K Unit Forecast, by Deployment 2019 & 2032
- Table 5: Global Cloud Billing Industry Revenue Million Forecast, by Component 2019 & 2032
- Table 6: Global Cloud Billing Industry Volume K Unit Forecast, by Component 2019 & 2032
- Table 7: Global Cloud Billing Industry Revenue Million Forecast, by End-user Industry 2019 & 2032
- Table 8: Global Cloud Billing Industry Volume K Unit Forecast, by End-user Industry 2019 & 2032
- Table 9: Global Cloud Billing Industry Revenue Million Forecast, by Region 2019 & 2032
- Table 10: Global Cloud Billing Industry Volume K Unit Forecast, by Region 2019 & 2032
- Table 11: Global Cloud Billing Industry Revenue Million Forecast, by Country 2019 & 2032
- Table 12: Global Cloud Billing Industry Volume K Unit Forecast, by Country 2019 & 2032
- Table 13: United States Cloud Billing Industry Revenue (Million) Forecast, by Application 2019 & 2032
- Table 14: United States Cloud Billing Industry Volume (K Unit) Forecast, by Application 2019 & 2032
- Table 15: Canada Cloud Billing Industry Revenue (Million) Forecast, by Application 2019 & 2032
- Table 16: Canada Cloud Billing Industry Volume (K Unit) Forecast, by Application 2019 & 2032
- Table 17: Mexico Cloud Billing Industry Revenue (Million) Forecast, by Application 2019 & 2032
- Table 18: Mexico Cloud Billing Industry Volume (K Unit) Forecast, by Application 2019 & 2032
- Table 19: Global Cloud Billing Industry Revenue Million Forecast, by Country 2019 & 2032
- Table 20: Global Cloud Billing Industry Volume K Unit Forecast, by Country 2019 & 2032
- Table 21: Germany Cloud Billing Industry Revenue (Million) Forecast, by Application 2019 & 2032
- Table 22: Germany Cloud Billing Industry Volume (K Unit) Forecast, by Application 2019 & 2032
- Table 23: United Kingdom Cloud Billing Industry Revenue (Million) Forecast, by Application 2019 & 2032
- Table 24: United Kingdom Cloud Billing Industry Volume (K Unit) Forecast, by Application 2019 & 2032
- Table 25: France Cloud Billing Industry Revenue (Million) Forecast, by Application 2019 & 2032
- Table 26: France Cloud Billing Industry Volume (K Unit) Forecast, by Application 2019 & 2032
- Table 27: Spain Cloud Billing Industry Revenue (Million) Forecast, by Application 2019 & 2032
- Table 28: Spain Cloud Billing Industry Volume (K Unit) Forecast, by Application 2019 & 2032
- Table 29: Italy Cloud Billing Industry Revenue (Million) Forecast, by Application 2019 & 2032
- Table 30: Italy Cloud Billing Industry Volume (K Unit) Forecast, by Application 2019 & 2032
- Table 31: Spain Cloud Billing Industry Revenue (Million) Forecast, by Application 2019 & 2032
- Table 32: Spain Cloud Billing Industry Volume (K Unit) Forecast, by Application 2019 & 2032
- Table 33: Belgium Cloud Billing Industry Revenue (Million) Forecast, by Application 2019 & 2032
- Table 34: Belgium Cloud Billing Industry Volume (K Unit) Forecast, by Application 2019 & 2032
- Table 35: Netherland Cloud Billing Industry Revenue (Million) Forecast, by Application 2019 & 2032
- Table 36: Netherland Cloud Billing Industry Volume (K Unit) Forecast, by Application 2019 & 2032
- Table 37: Nordics Cloud Billing Industry Revenue (Million) Forecast, by Application 2019 & 2032
- Table 38: Nordics Cloud Billing Industry Volume (K Unit) Forecast, by Application 2019 & 2032
- Table 39: Rest of Europe Cloud Billing Industry Revenue (Million) Forecast, by Application 2019 & 2032
- Table 40: Rest of Europe Cloud Billing Industry Volume (K Unit) Forecast, by Application 2019 & 2032
- Table 41: Global Cloud Billing Industry Revenue Million Forecast, by Country 2019 & 2032
- Table 42: Global Cloud Billing Industry Volume K Unit Forecast, by Country 2019 & 2032
- Table 43: China Cloud Billing Industry Revenue (Million) Forecast, by Application 2019 & 2032
- Table 44: China Cloud Billing Industry Volume (K Unit) Forecast, by Application 2019 & 2032
- Table 45: Japan Cloud Billing Industry Revenue (Million) Forecast, by Application 2019 & 2032
- Table 46: Japan Cloud Billing Industry Volume (K Unit) Forecast, by Application 2019 & 2032
- Table 47: India Cloud Billing Industry Revenue (Million) Forecast, by Application 2019 & 2032
- Table 48: India Cloud Billing Industry Volume (K Unit) Forecast, by Application 2019 & 2032
- Table 49: South Korea Cloud Billing Industry Revenue (Million) Forecast, by Application 2019 & 2032
- Table 50: South Korea Cloud Billing Industry Volume (K Unit) Forecast, by Application 2019 & 2032
- Table 51: Southeast Asia Cloud Billing Industry Revenue (Million) Forecast, by Application 2019 & 2032
- Table 52: Southeast Asia Cloud Billing Industry Volume (K Unit) Forecast, by Application 2019 & 2032
- Table 53: Australia Cloud Billing Industry Revenue (Million) Forecast, by Application 2019 & 2032
- Table 54: Australia Cloud Billing Industry Volume (K Unit) Forecast, by Application 2019 & 2032
- Table 55: Indonesia Cloud Billing Industry Revenue (Million) Forecast, by Application 2019 & 2032
- Table 56: Indonesia Cloud Billing Industry Volume (K Unit) Forecast, by Application 2019 & 2032
- Table 57: Phillipes Cloud Billing Industry Revenue (Million) Forecast, by Application 2019 & 2032
- Table 58: Phillipes Cloud Billing Industry Volume (K Unit) Forecast, by Application 2019 & 2032
- Table 59: Singapore Cloud Billing Industry Revenue (Million) Forecast, by Application 2019 & 2032
- Table 60: Singapore Cloud Billing Industry Volume (K Unit) Forecast, by Application 2019 & 2032
- Table 61: Thailandc Cloud Billing Industry Revenue (Million) Forecast, by Application 2019 & 2032
- Table 62: Thailandc Cloud Billing Industry Volume (K Unit) Forecast, by Application 2019 & 2032
- Table 63: Rest of Asia Pacific Cloud Billing Industry Revenue (Million) Forecast, by Application 2019 & 2032
- Table 64: Rest of Asia Pacific Cloud Billing Industry Volume (K Unit) Forecast, by Application 2019 & 2032
- Table 65: Global Cloud Billing Industry Revenue Million Forecast, by Country 2019 & 2032
- Table 66: Global Cloud Billing Industry Volume K Unit Forecast, by Country 2019 & 2032
- Table 67: Brazil Cloud Billing Industry Revenue (Million) Forecast, by Application 2019 & 2032
- Table 68: Brazil Cloud Billing Industry Volume (K Unit) Forecast, by Application 2019 & 2032
- Table 69: Argentina Cloud Billing Industry Revenue (Million) Forecast, by Application 2019 & 2032
- Table 70: Argentina Cloud Billing Industry Volume (K Unit) Forecast, by Application 2019 & 2032
- Table 71: Peru Cloud Billing Industry Revenue (Million) Forecast, by Application 2019 & 2032
- Table 72: Peru Cloud Billing Industry Volume (K Unit) Forecast, by Application 2019 & 2032
- Table 73: Chile Cloud Billing Industry Revenue (Million) Forecast, by Application 2019 & 2032
- Table 74: Chile Cloud Billing Industry Volume (K Unit) Forecast, by Application 2019 & 2032
- Table 75: Colombia Cloud Billing Industry Revenue (Million) Forecast, by Application 2019 & 2032
- Table 76: Colombia Cloud Billing Industry Volume (K Unit) Forecast, by Application 2019 & 2032
- Table 77: Ecuador Cloud Billing Industry Revenue (Million) Forecast, by Application 2019 & 2032
- Table 78: Ecuador Cloud Billing Industry Volume (K Unit) Forecast, by Application 2019 & 2032
- Table 79: Venezuela Cloud Billing Industry Revenue (Million) Forecast, by Application 2019 & 2032
- Table 80: Venezuela Cloud Billing Industry Volume (K Unit) Forecast, by Application 2019 & 2032
- Table 81: Rest of South America Cloud Billing Industry Revenue (Million) Forecast, by Application 2019 & 2032
- Table 82: Rest of South America Cloud Billing Industry Volume (K Unit) Forecast, by Application 2019 & 2032
- Table 83: Global Cloud Billing Industry Revenue Million Forecast, by Country 2019 & 2032
- Table 84: Global Cloud Billing Industry Volume K Unit Forecast, by Country 2019 & 2032
- Table 85: United States Cloud Billing Industry Revenue (Million) Forecast, by Application 2019 & 2032
- Table 86: United States Cloud Billing Industry Volume (K Unit) Forecast, by Application 2019 & 2032
- Table 87: Canada Cloud Billing Industry Revenue (Million) Forecast, by Application 2019 & 2032
- Table 88: Canada Cloud Billing Industry Volume (K Unit) Forecast, by Application 2019 & 2032
- Table 89: Mexico Cloud Billing Industry Revenue (Million) Forecast, by Application 2019 & 2032
- Table 90: Mexico Cloud Billing Industry Volume (K Unit) Forecast, by Application 2019 & 2032
- Table 91: Global Cloud Billing Industry Revenue Million Forecast, by Country 2019 & 2032
- Table 92: Global Cloud Billing Industry Volume K Unit Forecast, by Country 2019 & 2032
- Table 93: United Arab Emirates Cloud Billing Industry Revenue (Million) Forecast, by Application 2019 & 2032
- Table 94: United Arab Emirates Cloud Billing Industry Volume (K Unit) Forecast, by Application 2019 & 2032
- Table 95: Saudi Arabia Cloud Billing Industry Revenue (Million) Forecast, by Application 2019 & 2032
- Table 96: Saudi Arabia Cloud Billing Industry Volume (K Unit) Forecast, by Application 2019 & 2032
- Table 97: South Africa Cloud Billing Industry Revenue (Million) Forecast, by Application 2019 & 2032
- Table 98: South Africa Cloud Billing Industry Volume (K Unit) Forecast, by Application 2019 & 2032
- Table 99: Rest of Middle East and Africa Cloud Billing Industry Revenue (Million) Forecast, by Application 2019 & 2032
- Table 100: Rest of Middle East and Africa Cloud Billing Industry Volume (K Unit) Forecast, by Application 2019 & 2032
- Table 101: Global Cloud Billing Industry Revenue Million Forecast, by Deployment 2019 & 2032
- Table 102: Global Cloud Billing Industry Volume K Unit Forecast, by Deployment 2019 & 2032
- Table 103: Global Cloud Billing Industry Revenue Million Forecast, by Component 2019 & 2032
- Table 104: Global Cloud Billing Industry Volume K Unit Forecast, by Component 2019 & 2032
- Table 105: Global Cloud Billing Industry Revenue Million Forecast, by End-user Industry 2019 & 2032
- Table 106: Global Cloud Billing Industry Volume K Unit Forecast, by End-user Industry 2019 & 2032
- Table 107: Global Cloud Billing Industry Revenue Million Forecast, by Country 2019 & 2032
- Table 108: Global Cloud Billing Industry Volume K Unit Forecast, by Country 2019 & 2032
- Table 109: United States Cloud Billing Industry Revenue (Million) Forecast, by Application 2019 & 2032
- Table 110: United States Cloud Billing Industry Volume (K Unit) Forecast, by Application 2019 & 2032
- Table 111: Canada Cloud Billing Industry Revenue (Million) Forecast, by Application 2019 & 2032
- Table 112: Canada Cloud Billing Industry Volume (K Unit) Forecast, by Application 2019 & 2032
- Table 113: Global Cloud Billing Industry Revenue Million Forecast, by Deployment 2019 & 2032
- Table 114: Global Cloud Billing Industry Volume K Unit Forecast, by Deployment 2019 & 2032
- Table 115: Global Cloud Billing Industry Revenue Million Forecast, by Component 2019 & 2032
- Table 116: Global Cloud Billing Industry Volume K Unit Forecast, by Component 2019 & 2032
- Table 117: Global Cloud Billing Industry Revenue Million Forecast, by End-user Industry 2019 & 2032
- Table 118: Global Cloud Billing Industry Volume K Unit Forecast, by End-user Industry 2019 & 2032
- Table 119: Global Cloud Billing Industry Revenue Million Forecast, by Country 2019 & 2032
- Table 120: Global Cloud Billing Industry Volume K Unit Forecast, by Country 2019 & 2032
- Table 121: United Kingdom Cloud Billing Industry Revenue (Million) Forecast, by Application 2019 & 2032
- Table 122: United Kingdom Cloud Billing Industry Volume (K Unit) Forecast, by Application 2019 & 2032
- Table 123: Germany Cloud Billing Industry Revenue (Million) Forecast, by Application 2019 & 2032
- Table 124: Germany Cloud Billing Industry Volume (K Unit) Forecast, by Application 2019 & 2032
- Table 125: France Cloud Billing Industry Revenue (Million) Forecast, by Application 2019 & 2032
- Table 126: France Cloud Billing Industry Volume (K Unit) Forecast, by Application 2019 & 2032
- Table 127: Rest of Europe Cloud Billing Industry Revenue (Million) Forecast, by Application 2019 & 2032
- Table 128: Rest of Europe Cloud Billing Industry Volume (K Unit) Forecast, by Application 2019 & 2032
- Table 129: Global Cloud Billing Industry Revenue Million Forecast, by Deployment 2019 & 2032
- Table 130: Global Cloud Billing Industry Volume K Unit Forecast, by Deployment 2019 & 2032
- Table 131: Global Cloud Billing Industry Revenue Million Forecast, by Component 2019 & 2032
- Table 132: Global Cloud Billing Industry Volume K Unit Forecast, by Component 2019 & 2032
- Table 133: Global Cloud Billing Industry Revenue Million Forecast, by End-user Industry 2019 & 2032
- Table 134: Global Cloud Billing Industry Volume K Unit Forecast, by End-user Industry 2019 & 2032
- Table 135: Global Cloud Billing Industry Revenue Million Forecast, by Country 2019 & 2032
- Table 136: Global Cloud Billing Industry Volume K Unit Forecast, by Country 2019 & 2032
- Table 137: China Cloud Billing Industry Revenue (Million) Forecast, by Application 2019 & 2032
- Table 138: China Cloud Billing Industry Volume (K Unit) Forecast, by Application 2019 & 2032
- Table 139: India Cloud Billing Industry Revenue (Million) Forecast, by Application 2019 & 2032
- Table 140: India Cloud Billing Industry Volume (K Unit) Forecast, by Application 2019 & 2032
- Table 141: South Korea Cloud Billing Industry Revenue (Million) Forecast, by Application 2019 & 2032
- Table 142: South Korea Cloud Billing Industry Volume (K Unit) Forecast, by Application 2019 & 2032
- Table 143: Rest of Asia Pacific Cloud Billing Industry Revenue (Million) Forecast, by Application 2019 & 2032
- Table 144: Rest of Asia Pacific Cloud Billing Industry Volume (K Unit) Forecast, by Application 2019 & 2032
- Table 145: Global Cloud Billing Industry Revenue Million Forecast, by Deployment 2019 & 2032
- Table 146: Global Cloud Billing Industry Volume K Unit Forecast, by Deployment 2019 & 2032
- Table 147: Global Cloud Billing Industry Revenue Million Forecast, by Component 2019 & 2032
- Table 148: Global Cloud Billing Industry Volume K Unit Forecast, by Component 2019 & 2032
- Table 149: Global Cloud Billing Industry Revenue Million Forecast, by End-user Industry 2019 & 2032
- Table 150: Global Cloud Billing Industry Volume K Unit Forecast, by End-user Industry 2019 & 2032
- Table 151: Global Cloud Billing Industry Revenue Million Forecast, by Country 2019 & 2032
- Table 152: Global Cloud Billing Industry Volume K Unit Forecast, by Country 2019 & 2032
- Table 153: Brazil Cloud Billing Industry Revenue (Million) Forecast, by Application 2019 & 2032
- Table 154: Brazil Cloud Billing Industry Volume (K Unit) Forecast, by Application 2019 & 2032
- Table 155: Mexico Cloud Billing Industry Revenue (Million) Forecast, by Application 2019 & 2032
- Table 156: Mexico Cloud Billing Industry Volume (K Unit) Forecast, by Application 2019 & 2032
- Table 157: Rest of Latin America Cloud Billing Industry Revenue (Million) Forecast, by Application 2019 & 2032
- Table 158: Rest of Latin America Cloud Billing Industry Volume (K Unit) Forecast, by Application 2019 & 2032
- Table 159: Global Cloud Billing Industry Revenue Million Forecast, by Deployment 2019 & 2032
- Table 160: Global Cloud Billing Industry Volume K Unit Forecast, by Deployment 2019 & 2032
- Table 161: Global Cloud Billing Industry Revenue Million Forecast, by Component 2019 & 2032
- Table 162: Global Cloud Billing Industry Volume K Unit Forecast, by Component 2019 & 2032
- Table 163: Global Cloud Billing Industry Revenue Million Forecast, by End-user Industry 2019 & 2032
- Table 164: Global Cloud Billing Industry Volume K Unit Forecast, by End-user Industry 2019 & 2032
- Table 165: Global Cloud Billing Industry Revenue Million Forecast, by Country 2019 & 2032
- Table 166: Global Cloud Billing Industry Volume K Unit Forecast, by Country 2019 & 2032
- Table 167: Global Cloud Billing Industry Revenue Million Forecast, by Deployment 2019 & 2032
- Table 168: Global Cloud Billing Industry Volume K Unit Forecast, by Deployment 2019 & 2032
- Table 169: Global Cloud Billing Industry Revenue Million Forecast, by Component 2019 & 2032
- Table 170: Global Cloud Billing Industry Volume K Unit Forecast, by Component 2019 & 2032
- Table 171: Global Cloud Billing Industry Revenue Million Forecast, by End-user Industry 2019 & 2032
- Table 172: Global Cloud Billing Industry Volume K Unit Forecast, by End-user Industry 2019 & 2032
- Table 173: Global Cloud Billing Industry Revenue Million Forecast, by Country 2019 & 2032
- Table 174: Global Cloud Billing Industry Volume K Unit Forecast, by Country 2019 & 2032
- Table 175: South Africa Cloud Billing Industry Revenue (Million) Forecast, by Application 2019 & 2032
- Table 176: South Africa Cloud Billing Industry Volume (K Unit) Forecast, by Application 2019 & 2032
- Table 177: Saudi Arabia Cloud Billing Industry Revenue (Million) Forecast, by Application 2019 & 2032
- Table 178: Saudi Arabia Cloud Billing Industry Volume (K Unit) Forecast, by Application 2019 & 2032
- Table 179: Rest of Middle East Cloud Billing Industry Revenue (Million) Forecast, by Application 2019 & 2032
- Table 180: Rest of Middle East Cloud Billing Industry Volume (K Unit) Forecast, by Application 2019 & 2032
Frequently Asked Questions
1. What is the projected Compound Annual Growth Rate (CAGR) of the Cloud Billing Industry?
The projected CAGR is approximately 23.00%.
2. Which companies are prominent players in the Cloud Billing Industry?
Key companies in the market include Zuora Inc , ARIA Systems INC, Telefonaktiebolaget LM Ericsson, FinancialForce, Microsoft Corporation, Amazon Web Services Inc, Oracle Corporation, BillingPlatform, Orbitera Inc, SAP SE.
3. What are the main segments of the Cloud Billing Industry?
The market segments include Deployment, Component, End-user Industry.
4. Can you provide details about the market size?
The market size is estimated to be USD XX Million as of 2022.
5. What are some drivers contributing to market growth?
Increasing Adoption of Cloud Computing; Growth in E-commerce Platforms.
6. What are the notable trends driving market growth?
Retail Sector Expected to Show Maximum Application.
7. Are there any restraints impacting market growth?
Transition From On-Premise to Cloud-Based Solutions; High Costs Involved and Data Privacy Issues.
8. Can you provide examples of recent developments in the market?
January 2023: Input 1 is a pioneer in payments, digital billing, and premium financing solutions. HawkSoft, a supplier of insurance technologies for agency management systems, announced a strategic agreement to allow premium collecting capability for HawkSoft agencies. For more than 30 years, Input 1 has improved its comprehensive payments and billing platform, which reduces the complexity of the full lifecycle of premium collecting. Input 1 services are used by more than 125 carriers, financial organizations, managing general agents, and thousands of insurance agents to collect and bill premiums from their clients.
9. What pricing options are available for accessing the report?
Pricing options include single-user, multi-user, and enterprise licenses priced at USD 4750, USD 5250, and USD 8750 respectively.
10. Is the market size provided in terms of value or volume?
The market size is provided in terms of value, measured in Million and volume, measured in K Unit.
11. Are there any specific market keywords associated with the report?
Yes, the market keyword associated with the report is "Cloud Billing Industry," which aids in identifying and referencing the specific market segment covered.
12. How do I determine which pricing option suits my needs best?
The pricing options vary based on user requirements and access needs. Individual users may opt for single-user licenses, while businesses requiring broader access may choose multi-user or enterprise licenses for cost-effective access to the report.
13. Are there any additional resources or data provided in the Cloud Billing Industry report?
While the report offers comprehensive insights, it's advisable to review the specific contents or supplementary materials provided to ascertain if additional resources or data are available.
14. How can I stay updated on further developments or reports in the Cloud Billing Industry?
To stay informed about further developments, trends, and reports in the Cloud Billing Industry, consider subscribing to industry newsletters, following relevant companies and organizations, or regularly checking reputable industry news sources and publications.
Methodology
Step 1 - Identification of Relevant Samples Size from Population Database


Step 2 - Approaches for Defining Global Market Size (Value, Volume* & Price*)

Note*: In applicable scenarios
Step 3 - Data Sources
Primary Research
- Web Analytics
- Survey Reports
- Research Institute
- Latest Research Reports
- Opinion Leaders
Secondary Research
- Annual Reports
- White Paper
- Latest Press Release
- Industry Association
- Paid Database
- Investor Presentations

Step 4 - Data Triangulation
Involves using different sources of information in order to increase the validity of a study
These sources are likely to be stakeholders in a program - participants, other researchers, program staff, other community members, and so on.
Then we put all data in single framework & apply various statistical tools to find out the dynamic on the market.
During the analysis stage, feedback from the stakeholder groups would be compared to determine areas of agreement as well as areas of divergence


