
Key Insights
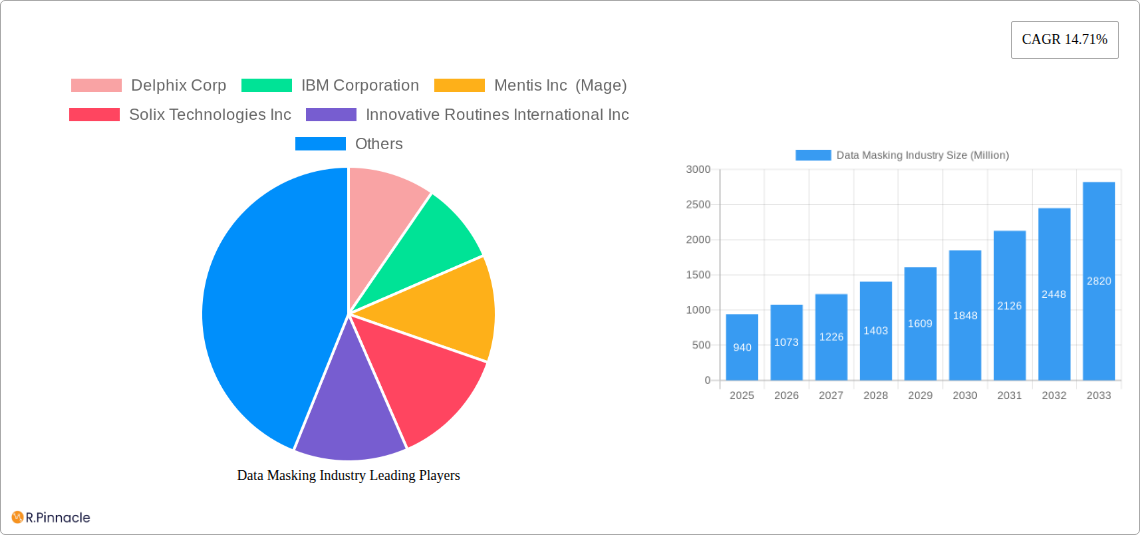
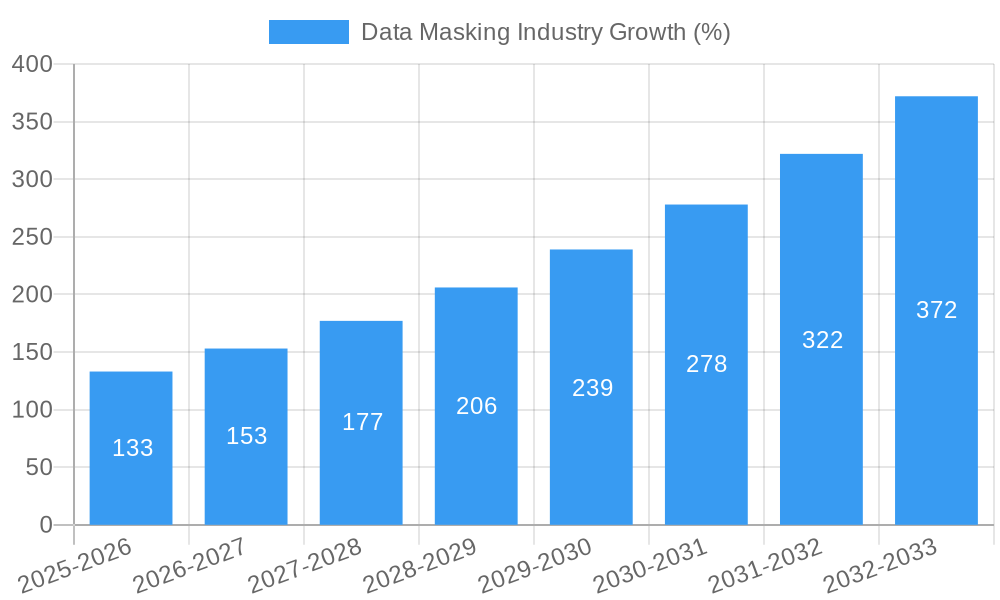
The data masking market, valued at $0.94 billion in 2025, is projected to experience robust growth, driven by increasing concerns around data privacy regulations (like GDPR and CCPA) and the rising adoption of cloud-based solutions. The Compound Annual Growth Rate (CAGR) of 14.71% from 2025 to 2033 indicates a significant expansion, reaching an estimated market size exceeding $3 billion by 2033. This growth is fueled by several key factors. The increasing volume and sensitivity of data necessitate robust data masking solutions across various sectors, particularly in BFSI (Banking, Financial Services, and Insurance), healthcare, and government. The shift towards cloud computing offers scalable and cost-effective data masking solutions, further accelerating market adoption. However, challenges remain, such as the complexity of implementing and managing data masking solutions, particularly in large and heterogeneous environments, and the potential for performance bottlenecks. The market is segmented by type (static and dynamic masking), deployment (cloud and on-premise), and end-user industry, reflecting the diverse needs and applications of data masking technology. Competition is strong, with established players like IBM, Oracle, and Informatica alongside specialized vendors like Delphix and Solix Technologies vying for market share. The North American market is currently dominant, but regions like Asia-Pacific are anticipated to witness rapid growth due to increasing digitalization and data privacy awareness.
The dynamic masking segment is expected to exhibit faster growth compared to static masking due to its ability to mask data in real-time, catering to evolving data needs. Cloud deployment is gaining traction due to its inherent scalability and cost-effectiveness, surpassing on-premise solutions in growth rate over the forecast period. Among end-user industries, BFSI and healthcare sectors are expected to contribute significantly to the market growth due to their strict regulatory requirements and high sensitivity of the data they handle. The continued evolution of data privacy regulations globally and the rise of advanced data masking techniques incorporating AI and machine learning will shape the future trajectory of the market. Successful vendors will be those who can offer flexible, scalable, and secure solutions that adapt to the evolving regulatory landscape and technological advancements.
Data Masking Industry Report: A Comprehensive Market Analysis (2019-2033)
This comprehensive report provides a detailed analysis of the Data Masking industry, projecting a market value exceeding $xx Million by 2033. It offers actionable insights for industry professionals, investors, and strategists seeking to navigate this rapidly evolving landscape. The report covers the period 2019-2033, with 2025 as the base and estimated year. Key players analyzed include Delphix Corp, IBM Corporation, Mentis Inc (Mage), Solix Technologies Inc, Innovative Routines International Inc, Oracle Corporation, Informatica LLC, K2view Ltd, Broadcom Inc, Red Gate Software Ltd (list not exhaustive).
Data Masking Industry Market Structure & Innovation Trends
The Data Masking market exhibits a moderately consolidated structure, with a few major players holding significant market share. The exact figures are subject to proprietary data analysis. For example, in 2025, IBM is estimated to hold approximately xx% market share, while Delphix Corp holds roughly xx%, and other players divide the remaining percentage. Innovation is driven by increasing data privacy regulations (e.g., GDPR, CCPA), rising cybersecurity threats, and the growing adoption of cloud computing.
- Market Concentration: Moderately consolidated with key players holding significant shares.
- Innovation Drivers: Data privacy regulations, cybersecurity threats, cloud adoption.
- Regulatory Frameworks: GDPR, CCPA, and other regional regulations significantly impact market growth.
- Product Substitutes: Limited direct substitutes; however, alternative data anonymization techniques exist.
- End-User Demographics: Primarily enterprises across various sectors, with a focus on BFSI, Healthcare, and Government.
- M&A Activities: Several M&A deals have shaped market dynamics, with deal values in the range of $xx Million to $xx Million. The report details specific deals and their impact.
Data Masking Industry Market Dynamics & Trends
The Data Masking market is experiencing robust growth, with a projected Compound Annual Growth Rate (CAGR) of xx% during the forecast period (2025-2033). This growth is fueled by increasing concerns about data breaches, stricter compliance requirements, and the expanding adoption of cloud-based data masking solutions. Market penetration is expected to reach xx% by 2033 across key segments. Technological disruptions, such as advancements in AI and machine learning for improved data masking techniques, are further driving market expansion. Consumer preferences are shifting towards dynamic data masking solutions and cloud deployments, impacting vendor strategies and product development. The competitive landscape is marked by intense rivalry, with companies focusing on innovation, strategic partnerships, and expansion into new markets.
Dominant Regions & Segments in Data Masking Industry
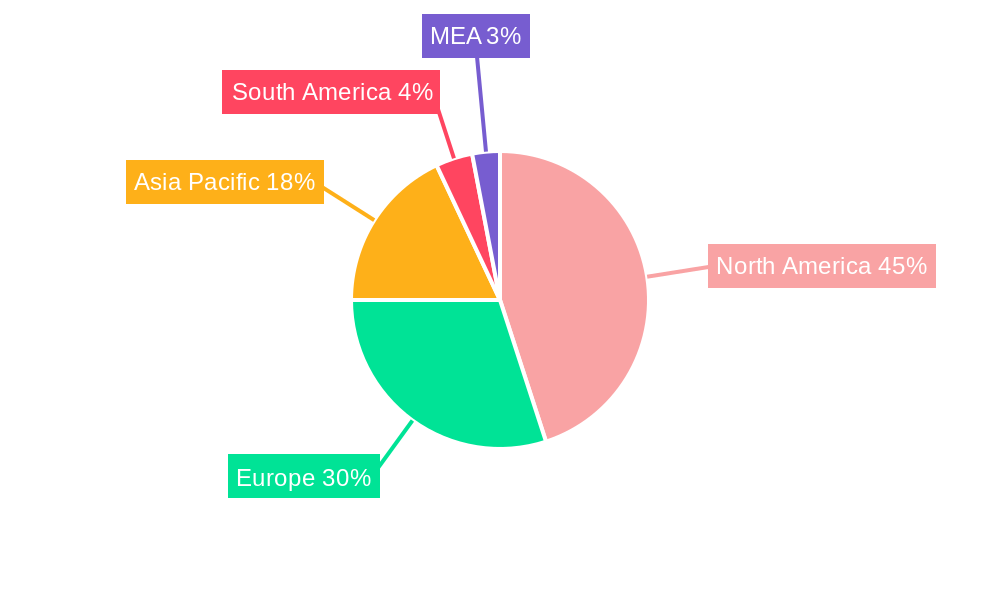
North America is projected to maintain its dominance in the Data Masking market throughout the forecast period, fueled by robust technological advancements and stringent data privacy regulations. Within segments:
- By Type: Dynamic data masking is witnessing faster adoption due to its flexibility and cost-effectiveness compared to static masking.
- By Deployment: Cloud-based deployments are experiencing significant growth due to scalability, accessibility, and reduced infrastructure costs.
- By End-user Industry: BFSI and Healthcare sectors are leading adopters, driven by high volumes of sensitive data and strict regulatory requirements. Other sectors like Government and Defense also exhibit strong growth.
Key drivers for these regions and segments include robust economic growth, well-developed IT infrastructure, and supportive government policies. Europe is anticipated to show robust growth, driven by the presence of stringent data protection regulations.
Data Masking Industry Product Innovations
Recent innovations focus on AI-powered dynamic data masking, improving the accuracy and efficiency of masking processes. This enables organizations to protect sensitive data while preserving data utility for analytics and development. The market is witnessing increased adoption of solutions integrating data discovery and classification functionalities. This holistic approach strengthens data protection and streamlines compliance efforts. New advancements are focused on reducing the impact on performance and data usability.
Report Scope & Segmentation Analysis
This report comprehensively segments the Data Masking market by:
- Type: Static and Dynamic data masking, each with detailed market size projections and growth analyses.
- Deployment: Cloud and On-premise deployments, highlighting the factors influencing their respective adoption rates.
- End-user Industry: BFSI, Healthcare, IT & Telecom, Retail, Government & Defense, Manufacturing, Media & Entertainment, and Other End-user Industries, each with specific growth forecasts and competitive landscapes.
Key Drivers of Data Masking Industry Growth
The Data Masking industry's growth is driven by several factors:
- Stringent Data Privacy Regulations: GDPR, CCPA, and similar regulations mandate robust data protection measures, fueling demand for data masking solutions.
- Rising Cybersecurity Threats: The increasing frequency and sophistication of cyberattacks are compelling organizations to adopt proactive data protection strategies.
- Growing Cloud Adoption: The migration of sensitive data to cloud environments necessitates the implementation of effective data masking techniques.
Challenges in the Data Masking Industry Sector
The industry faces challenges such as:
- High Implementation Costs: Deploying and maintaining data masking solutions can be expensive, especially for smaller organizations.
- Complexity of Integration: Integrating data masking solutions into existing IT infrastructure can be complex and time-consuming.
- Maintaining Data Utility: Balancing the need for robust data protection with preserving data usability for analytics and development remains a challenge.
Emerging Opportunities in Data Masking Industry
Emerging opportunities include:
- Expansion into New Markets: Untapped markets in developing economies present significant growth potential.
- Advancements in AI and Machine Learning: Leveraging AI and ML for improved masking algorithms and automation.
- Integration with other Cybersecurity Solutions: Creating integrated data security platforms to enhance overall data protection.
Leading Players in the Data Masking Industry Market
- Delphix Corp
- IBM Corporation
- Mentis Inc (Mage)
- Solix Technologies Inc
- Innovative Routines International Inc
- Oracle Corporation
- Informatica LLC
- K2view Ltd
- Broadcom Inc
- Red Gate Software Ltd
Key Developments in Data Masking Industry
- August 2022: IBM released IBM Cloud Pak Data V4.5.x, enhancing data protection capabilities with advanced de-identification techniques. This significantly improved data utility for various data users.
- April 2022: Mage partnered with Imperva, offering a data masking alternative to Imperva's Data Security Fabric, strengthening its market position and offering a more competitive solution.
Future Outlook for Data Masking Industry Market
The Data Masking market is poised for continued growth, driven by increasing data volumes, stringent regulations, and evolving cyber threats. Strategic partnerships, product innovation, and expansion into new markets will be crucial for success. The focus on AI-powered solutions and integration with broader data security platforms will shape the future landscape.
Data Masking Industry Segmentation
-
1. Type
- 1.1. Static
- 1.2. Dynamic
-
2. Deployment
- 2.1. Cloud
- 2.2. On-premise
-
3. End-user Industry
- 3.1. BFSI
- 3.2. Healthcare
- 3.3. IT and Telecom
- 3.4. Retail
- 3.5. Government and Defense
- 3.6. Manufacturing
- 3.7. Media and Entertainment
- 3.8. Other End-user Industries
Data Masking Industry Segmentation By Geography
-
1. North America
- 1.1. United States
- 1.2. Canada
-
2. Europe
- 2.1. United Kingdom
- 2.2. Germany
- 2.3. Rest of Europe
-
3. Asia Pacific
- 3.1. China
- 3.2. India
- 3.3. Rest of Asia Pacific
- 4. Latin America
- 5. Middle East and Africa
Data Masking Industry REPORT HIGHLIGHTS
| Aspects | Details |
|---|---|
| Study Period | 2019-2033 |
| Base Year | 2024 |
| Estimated Year | 2025 |
| Forecast Period | 2025-2033 |
| Historical Period | 2019-2024 |
| Growth Rate | CAGR of 14.71% from 2019-2033 |
| Segmentation |
|
Table of Contents
- 1. Introduction
- 1.1. Research Scope
- 1.2. Market Segmentation
- 1.3. Research Methodology
- 1.4. Definitions and Assumptions
- 2. Executive Summary
- 2.1. Introduction
- 3. Market Dynamics
- 3.1. Introduction
- 3.2. Market Drivers
- 3.2.1. Increase of Organizational Data Volumes
- 3.3. Market Restrains
- 3.3.1. Technological Complexities Associated with Data Masking Challenge the Market Growth
- 3.4. Market Trends
- 3.4.1. The BFSI Industry to Witness a Significant Growth
- 4. Market Factor Analysis
- 4.1. Porters Five Forces
- 4.2. Supply/Value Chain
- 4.3. PESTEL analysis
- 4.4. Market Entropy
- 4.5. Patent/Trademark Analysis
- 5. Global Data Masking Industry Analysis, Insights and Forecast, 2019-2031
- 5.1. Market Analysis, Insights and Forecast - by Type
- 5.1.1. Static
- 5.1.2. Dynamic
- 5.2. Market Analysis, Insights and Forecast - by Deployment
- 5.2.1. Cloud
- 5.2.2. On-premise
- 5.3. Market Analysis, Insights and Forecast - by End-user Industry
- 5.3.1. BFSI
- 5.3.2. Healthcare
- 5.3.3. IT and Telecom
- 5.3.4. Retail
- 5.3.5. Government and Defense
- 5.3.6. Manufacturing
- 5.3.7. Media and Entertainment
- 5.3.8. Other End-user Industries
- 5.4. Market Analysis, Insights and Forecast - by Region
- 5.4.1. North America
- 5.4.2. Europe
- 5.4.3. Asia Pacific
- 5.4.4. Latin America
- 5.4.5. Middle East and Africa
- 5.1. Market Analysis, Insights and Forecast - by Type
- 6. North America Data Masking Industry Analysis, Insights and Forecast, 2019-2031
- 6.1. Market Analysis, Insights and Forecast - by Type
- 6.1.1. Static
- 6.1.2. Dynamic
- 6.2. Market Analysis, Insights and Forecast - by Deployment
- 6.2.1. Cloud
- 6.2.2. On-premise
- 6.3. Market Analysis, Insights and Forecast - by End-user Industry
- 6.3.1. BFSI
- 6.3.2. Healthcare
- 6.3.3. IT and Telecom
- 6.3.4. Retail
- 6.3.5. Government and Defense
- 6.3.6. Manufacturing
- 6.3.7. Media and Entertainment
- 6.3.8. Other End-user Industries
- 6.1. Market Analysis, Insights and Forecast - by Type
- 7. Europe Data Masking Industry Analysis, Insights and Forecast, 2019-2031
- 7.1. Market Analysis, Insights and Forecast - by Type
- 7.1.1. Static
- 7.1.2. Dynamic
- 7.2. Market Analysis, Insights and Forecast - by Deployment
- 7.2.1. Cloud
- 7.2.2. On-premise
- 7.3. Market Analysis, Insights and Forecast - by End-user Industry
- 7.3.1. BFSI
- 7.3.2. Healthcare
- 7.3.3. IT and Telecom
- 7.3.4. Retail
- 7.3.5. Government and Defense
- 7.3.6. Manufacturing
- 7.3.7. Media and Entertainment
- 7.3.8. Other End-user Industries
- 7.1. Market Analysis, Insights and Forecast - by Type
- 8. Asia Pacific Data Masking Industry Analysis, Insights and Forecast, 2019-2031
- 8.1. Market Analysis, Insights and Forecast - by Type
- 8.1.1. Static
- 8.1.2. Dynamic
- 8.2. Market Analysis, Insights and Forecast - by Deployment
- 8.2.1. Cloud
- 8.2.2. On-premise
- 8.3. Market Analysis, Insights and Forecast - by End-user Industry
- 8.3.1. BFSI
- 8.3.2. Healthcare
- 8.3.3. IT and Telecom
- 8.3.4. Retail
- 8.3.5. Government and Defense
- 8.3.6. Manufacturing
- 8.3.7. Media and Entertainment
- 8.3.8. Other End-user Industries
- 8.1. Market Analysis, Insights and Forecast - by Type
- 9. Latin America Data Masking Industry Analysis, Insights and Forecast, 2019-2031
- 9.1. Market Analysis, Insights and Forecast - by Type
- 9.1.1. Static
- 9.1.2. Dynamic
- 9.2. Market Analysis, Insights and Forecast - by Deployment
- 9.2.1. Cloud
- 9.2.2. On-premise
- 9.3. Market Analysis, Insights and Forecast - by End-user Industry
- 9.3.1. BFSI
- 9.3.2. Healthcare
- 9.3.3. IT and Telecom
- 9.3.4. Retail
- 9.3.5. Government and Defense
- 9.3.6. Manufacturing
- 9.3.7. Media and Entertainment
- 9.3.8. Other End-user Industries
- 9.1. Market Analysis, Insights and Forecast - by Type
- 10. Middle East and Africa Data Masking Industry Analysis, Insights and Forecast, 2019-2031
- 10.1. Market Analysis, Insights and Forecast - by Type
- 10.1.1. Static
- 10.1.2. Dynamic
- 10.2. Market Analysis, Insights and Forecast - by Deployment
- 10.2.1. Cloud
- 10.2.2. On-premise
- 10.3. Market Analysis, Insights and Forecast - by End-user Industry
- 10.3.1. BFSI
- 10.3.2. Healthcare
- 10.3.3. IT and Telecom
- 10.3.4. Retail
- 10.3.5. Government and Defense
- 10.3.6. Manufacturing
- 10.3.7. Media and Entertainment
- 10.3.8. Other End-user Industries
- 10.1. Market Analysis, Insights and Forecast - by Type
- 11. North America Data Masking Industry Analysis, Insights and Forecast, 2019-2031
- 11.1. Market Analysis, Insights and Forecast - By Country/Sub-region
- 11.1.1 United States
- 11.1.2 Canada
- 11.1.3 Mexico
- 12. Europe Data Masking Industry Analysis, Insights and Forecast, 2019-2031
- 12.1. Market Analysis, Insights and Forecast - By Country/Sub-region
- 12.1.1 Germany
- 12.1.2 United Kingdom
- 12.1.3 France
- 12.1.4 Spain
- 12.1.5 Italy
- 12.1.6 Spain
- 12.1.7 Belgium
- 12.1.8 Netherland
- 12.1.9 Nordics
- 12.1.10 Rest of Europe
- 13. Asia Pacific Data Masking Industry Analysis, Insights and Forecast, 2019-2031
- 13.1. Market Analysis, Insights and Forecast - By Country/Sub-region
- 13.1.1 China
- 13.1.2 Japan
- 13.1.3 India
- 13.1.4 South Korea
- 13.1.5 Southeast Asia
- 13.1.6 Australia
- 13.1.7 Indonesia
- 13.1.8 Phillipes
- 13.1.9 Singapore
- 13.1.10 Thailandc
- 13.1.11 Rest of Asia Pacific
- 14. South America Data Masking Industry Analysis, Insights and Forecast, 2019-2031
- 14.1. Market Analysis, Insights and Forecast - By Country/Sub-region
- 14.1.1 Brazil
- 14.1.2 Argentina
- 14.1.3 Peru
- 14.1.4 Chile
- 14.1.5 Colombia
- 14.1.6 Ecuador
- 14.1.7 Venezuela
- 14.1.8 Rest of South America
- 15. North America Data Masking Industry Analysis, Insights and Forecast, 2019-2031
- 15.1. Market Analysis, Insights and Forecast - By Country/Sub-region
- 15.1.1 United States
- 15.1.2 Canada
- 15.1.3 Mexico
- 16. MEA Data Masking Industry Analysis, Insights and Forecast, 2019-2031
- 16.1. Market Analysis, Insights and Forecast - By Country/Sub-region
- 16.1.1 United Arab Emirates
- 16.1.2 Saudi Arabia
- 16.1.3 South Africa
- 16.1.4 Rest of Middle East and Africa
- 17. Competitive Analysis
- 17.1. Global Market Share Analysis 2024
- 17.2. Company Profiles
- 17.2.1 Delphix Corp
- 17.2.1.1. Overview
- 17.2.1.2. Products
- 17.2.1.3. SWOT Analysis
- 17.2.1.4. Recent Developments
- 17.2.1.5. Financials (Based on Availability)
- 17.2.2 IBM Corporation
- 17.2.2.1. Overview
- 17.2.2.2. Products
- 17.2.2.3. SWOT Analysis
- 17.2.2.4. Recent Developments
- 17.2.2.5. Financials (Based on Availability)
- 17.2.3 Mentis Inc (Mage)
- 17.2.3.1. Overview
- 17.2.3.2. Products
- 17.2.3.3. SWOT Analysis
- 17.2.3.4. Recent Developments
- 17.2.3.5. Financials (Based on Availability)
- 17.2.4 Solix Technologies Inc
- 17.2.4.1. Overview
- 17.2.4.2. Products
- 17.2.4.3. SWOT Analysis
- 17.2.4.4. Recent Developments
- 17.2.4.5. Financials (Based on Availability)
- 17.2.5 Innovative Routines International Inc
- 17.2.5.1. Overview
- 17.2.5.2. Products
- 17.2.5.3. SWOT Analysis
- 17.2.5.4. Recent Developments
- 17.2.5.5. Financials (Based on Availability)
- 17.2.6 Oracle Corporation
- 17.2.6.1. Overview
- 17.2.6.2. Products
- 17.2.6.3. SWOT Analysis
- 17.2.6.4. Recent Developments
- 17.2.6.5. Financials (Based on Availability)
- 17.2.7 Informatica LLC
- 17.2.7.1. Overview
- 17.2.7.2. Products
- 17.2.7.3. SWOT Analysis
- 17.2.7.4. Recent Developments
- 17.2.7.5. Financials (Based on Availability)
- 17.2.8 K2view Ltd
- 17.2.8.1. Overview
- 17.2.8.2. Products
- 17.2.8.3. SWOT Analysis
- 17.2.8.4. Recent Developments
- 17.2.8.5. Financials (Based on Availability)
- 17.2.9 Broadcom Inc *List Not Exhaustive
- 17.2.9.1. Overview
- 17.2.9.2. Products
- 17.2.9.3. SWOT Analysis
- 17.2.9.4. Recent Developments
- 17.2.9.5. Financials (Based on Availability)
- 17.2.10 Red Gate Software Ltd
- 17.2.10.1. Overview
- 17.2.10.2. Products
- 17.2.10.3. SWOT Analysis
- 17.2.10.4. Recent Developments
- 17.2.10.5. Financials (Based on Availability)
- 17.2.1 Delphix Corp
List of Figures
- Figure 1: Global Data Masking Industry Revenue Breakdown (Million, %) by Region 2024 & 2032
- Figure 2: North America Data Masking Industry Revenue (Million), by Country 2024 & 2032
- Figure 3: North America Data Masking Industry Revenue Share (%), by Country 2024 & 2032
- Figure 4: Europe Data Masking Industry Revenue (Million), by Country 2024 & 2032
- Figure 5: Europe Data Masking Industry Revenue Share (%), by Country 2024 & 2032
- Figure 6: Asia Pacific Data Masking Industry Revenue (Million), by Country 2024 & 2032
- Figure 7: Asia Pacific Data Masking Industry Revenue Share (%), by Country 2024 & 2032
- Figure 8: South America Data Masking Industry Revenue (Million), by Country 2024 & 2032
- Figure 9: South America Data Masking Industry Revenue Share (%), by Country 2024 & 2032
- Figure 10: North America Data Masking Industry Revenue (Million), by Country 2024 & 2032
- Figure 11: North America Data Masking Industry Revenue Share (%), by Country 2024 & 2032
- Figure 12: MEA Data Masking Industry Revenue (Million), by Country 2024 & 2032
- Figure 13: MEA Data Masking Industry Revenue Share (%), by Country 2024 & 2032
- Figure 14: North America Data Masking Industry Revenue (Million), by Type 2024 & 2032
- Figure 15: North America Data Masking Industry Revenue Share (%), by Type 2024 & 2032
- Figure 16: North America Data Masking Industry Revenue (Million), by Deployment 2024 & 2032
- Figure 17: North America Data Masking Industry Revenue Share (%), by Deployment 2024 & 2032
- Figure 18: North America Data Masking Industry Revenue (Million), by End-user Industry 2024 & 2032
- Figure 19: North America Data Masking Industry Revenue Share (%), by End-user Industry 2024 & 2032
- Figure 20: North America Data Masking Industry Revenue (Million), by Country 2024 & 2032
- Figure 21: North America Data Masking Industry Revenue Share (%), by Country 2024 & 2032
- Figure 22: Europe Data Masking Industry Revenue (Million), by Type 2024 & 2032
- Figure 23: Europe Data Masking Industry Revenue Share (%), by Type 2024 & 2032
- Figure 24: Europe Data Masking Industry Revenue (Million), by Deployment 2024 & 2032
- Figure 25: Europe Data Masking Industry Revenue Share (%), by Deployment 2024 & 2032
- Figure 26: Europe Data Masking Industry Revenue (Million), by End-user Industry 2024 & 2032
- Figure 27: Europe Data Masking Industry Revenue Share (%), by End-user Industry 2024 & 2032
- Figure 28: Europe Data Masking Industry Revenue (Million), by Country 2024 & 2032
- Figure 29: Europe Data Masking Industry Revenue Share (%), by Country 2024 & 2032
- Figure 30: Asia Pacific Data Masking Industry Revenue (Million), by Type 2024 & 2032
- Figure 31: Asia Pacific Data Masking Industry Revenue Share (%), by Type 2024 & 2032
- Figure 32: Asia Pacific Data Masking Industry Revenue (Million), by Deployment 2024 & 2032
- Figure 33: Asia Pacific Data Masking Industry Revenue Share (%), by Deployment 2024 & 2032
- Figure 34: Asia Pacific Data Masking Industry Revenue (Million), by End-user Industry 2024 & 2032
- Figure 35: Asia Pacific Data Masking Industry Revenue Share (%), by End-user Industry 2024 & 2032
- Figure 36: Asia Pacific Data Masking Industry Revenue (Million), by Country 2024 & 2032
- Figure 37: Asia Pacific Data Masking Industry Revenue Share (%), by Country 2024 & 2032
- Figure 38: Latin America Data Masking Industry Revenue (Million), by Type 2024 & 2032
- Figure 39: Latin America Data Masking Industry Revenue Share (%), by Type 2024 & 2032
- Figure 40: Latin America Data Masking Industry Revenue (Million), by Deployment 2024 & 2032
- Figure 41: Latin America Data Masking Industry Revenue Share (%), by Deployment 2024 & 2032
- Figure 42: Latin America Data Masking Industry Revenue (Million), by End-user Industry 2024 & 2032
- Figure 43: Latin America Data Masking Industry Revenue Share (%), by End-user Industry 2024 & 2032
- Figure 44: Latin America Data Masking Industry Revenue (Million), by Country 2024 & 2032
- Figure 45: Latin America Data Masking Industry Revenue Share (%), by Country 2024 & 2032
- Figure 46: Middle East and Africa Data Masking Industry Revenue (Million), by Type 2024 & 2032
- Figure 47: Middle East and Africa Data Masking Industry Revenue Share (%), by Type 2024 & 2032
- Figure 48: Middle East and Africa Data Masking Industry Revenue (Million), by Deployment 2024 & 2032
- Figure 49: Middle East and Africa Data Masking Industry Revenue Share (%), by Deployment 2024 & 2032
- Figure 50: Middle East and Africa Data Masking Industry Revenue (Million), by End-user Industry 2024 & 2032
- Figure 51: Middle East and Africa Data Masking Industry Revenue Share (%), by End-user Industry 2024 & 2032
- Figure 52: Middle East and Africa Data Masking Industry Revenue (Million), by Country 2024 & 2032
- Figure 53: Middle East and Africa Data Masking Industry Revenue Share (%), by Country 2024 & 2032
List of Tables
- Table 1: Global Data Masking Industry Revenue Million Forecast, by Region 2019 & 2032
- Table 2: Global Data Masking Industry Revenue Million Forecast, by Type 2019 & 2032
- Table 3: Global Data Masking Industry Revenue Million Forecast, by Deployment 2019 & 2032
- Table 4: Global Data Masking Industry Revenue Million Forecast, by End-user Industry 2019 & 2032
- Table 5: Global Data Masking Industry Revenue Million Forecast, by Region 2019 & 2032
- Table 6: Global Data Masking Industry Revenue Million Forecast, by Country 2019 & 2032
- Table 7: United States Data Masking Industry Revenue (Million) Forecast, by Application 2019 & 2032
- Table 8: Canada Data Masking Industry Revenue (Million) Forecast, by Application 2019 & 2032
- Table 9: Mexico Data Masking Industry Revenue (Million) Forecast, by Application 2019 & 2032
- Table 10: Global Data Masking Industry Revenue Million Forecast, by Country 2019 & 2032
- Table 11: Germany Data Masking Industry Revenue (Million) Forecast, by Application 2019 & 2032
- Table 12: United Kingdom Data Masking Industry Revenue (Million) Forecast, by Application 2019 & 2032
- Table 13: France Data Masking Industry Revenue (Million) Forecast, by Application 2019 & 2032
- Table 14: Spain Data Masking Industry Revenue (Million) Forecast, by Application 2019 & 2032
- Table 15: Italy Data Masking Industry Revenue (Million) Forecast, by Application 2019 & 2032
- Table 16: Spain Data Masking Industry Revenue (Million) Forecast, by Application 2019 & 2032
- Table 17: Belgium Data Masking Industry Revenue (Million) Forecast, by Application 2019 & 2032
- Table 18: Netherland Data Masking Industry Revenue (Million) Forecast, by Application 2019 & 2032
- Table 19: Nordics Data Masking Industry Revenue (Million) Forecast, by Application 2019 & 2032
- Table 20: Rest of Europe Data Masking Industry Revenue (Million) Forecast, by Application 2019 & 2032
- Table 21: Global Data Masking Industry Revenue Million Forecast, by Country 2019 & 2032
- Table 22: China Data Masking Industry Revenue (Million) Forecast, by Application 2019 & 2032
- Table 23: Japan Data Masking Industry Revenue (Million) Forecast, by Application 2019 & 2032
- Table 24: India Data Masking Industry Revenue (Million) Forecast, by Application 2019 & 2032
- Table 25: South Korea Data Masking Industry Revenue (Million) Forecast, by Application 2019 & 2032
- Table 26: Southeast Asia Data Masking Industry Revenue (Million) Forecast, by Application 2019 & 2032
- Table 27: Australia Data Masking Industry Revenue (Million) Forecast, by Application 2019 & 2032
- Table 28: Indonesia Data Masking Industry Revenue (Million) Forecast, by Application 2019 & 2032
- Table 29: Phillipes Data Masking Industry Revenue (Million) Forecast, by Application 2019 & 2032
- Table 30: Singapore Data Masking Industry Revenue (Million) Forecast, by Application 2019 & 2032
- Table 31: Thailandc Data Masking Industry Revenue (Million) Forecast, by Application 2019 & 2032
- Table 32: Rest of Asia Pacific Data Masking Industry Revenue (Million) Forecast, by Application 2019 & 2032
- Table 33: Global Data Masking Industry Revenue Million Forecast, by Country 2019 & 2032
- Table 34: Brazil Data Masking Industry Revenue (Million) Forecast, by Application 2019 & 2032
- Table 35: Argentina Data Masking Industry Revenue (Million) Forecast, by Application 2019 & 2032
- Table 36: Peru Data Masking Industry Revenue (Million) Forecast, by Application 2019 & 2032
- Table 37: Chile Data Masking Industry Revenue (Million) Forecast, by Application 2019 & 2032
- Table 38: Colombia Data Masking Industry Revenue (Million) Forecast, by Application 2019 & 2032
- Table 39: Ecuador Data Masking Industry Revenue (Million) Forecast, by Application 2019 & 2032
- Table 40: Venezuela Data Masking Industry Revenue (Million) Forecast, by Application 2019 & 2032
- Table 41: Rest of South America Data Masking Industry Revenue (Million) Forecast, by Application 2019 & 2032
- Table 42: Global Data Masking Industry Revenue Million Forecast, by Country 2019 & 2032
- Table 43: United States Data Masking Industry Revenue (Million) Forecast, by Application 2019 & 2032
- Table 44: Canada Data Masking Industry Revenue (Million) Forecast, by Application 2019 & 2032
- Table 45: Mexico Data Masking Industry Revenue (Million) Forecast, by Application 2019 & 2032
- Table 46: Global Data Masking Industry Revenue Million Forecast, by Country 2019 & 2032
- Table 47: United Arab Emirates Data Masking Industry Revenue (Million) Forecast, by Application 2019 & 2032
- Table 48: Saudi Arabia Data Masking Industry Revenue (Million) Forecast, by Application 2019 & 2032
- Table 49: South Africa Data Masking Industry Revenue (Million) Forecast, by Application 2019 & 2032
- Table 50: Rest of Middle East and Africa Data Masking Industry Revenue (Million) Forecast, by Application 2019 & 2032
- Table 51: Global Data Masking Industry Revenue Million Forecast, by Type 2019 & 2032
- Table 52: Global Data Masking Industry Revenue Million Forecast, by Deployment 2019 & 2032
- Table 53: Global Data Masking Industry Revenue Million Forecast, by End-user Industry 2019 & 2032
- Table 54: Global Data Masking Industry Revenue Million Forecast, by Country 2019 & 2032
- Table 55: United States Data Masking Industry Revenue (Million) Forecast, by Application 2019 & 2032
- Table 56: Canada Data Masking Industry Revenue (Million) Forecast, by Application 2019 & 2032
- Table 57: Global Data Masking Industry Revenue Million Forecast, by Type 2019 & 2032
- Table 58: Global Data Masking Industry Revenue Million Forecast, by Deployment 2019 & 2032
- Table 59: Global Data Masking Industry Revenue Million Forecast, by End-user Industry 2019 & 2032
- Table 60: Global Data Masking Industry Revenue Million Forecast, by Country 2019 & 2032
- Table 61: United Kingdom Data Masking Industry Revenue (Million) Forecast, by Application 2019 & 2032
- Table 62: Germany Data Masking Industry Revenue (Million) Forecast, by Application 2019 & 2032
- Table 63: Rest of Europe Data Masking Industry Revenue (Million) Forecast, by Application 2019 & 2032
- Table 64: Global Data Masking Industry Revenue Million Forecast, by Type 2019 & 2032
- Table 65: Global Data Masking Industry Revenue Million Forecast, by Deployment 2019 & 2032
- Table 66: Global Data Masking Industry Revenue Million Forecast, by End-user Industry 2019 & 2032
- Table 67: Global Data Masking Industry Revenue Million Forecast, by Country 2019 & 2032
- Table 68: China Data Masking Industry Revenue (Million) Forecast, by Application 2019 & 2032
- Table 69: India Data Masking Industry Revenue (Million) Forecast, by Application 2019 & 2032
- Table 70: Rest of Asia Pacific Data Masking Industry Revenue (Million) Forecast, by Application 2019 & 2032
- Table 71: Global Data Masking Industry Revenue Million Forecast, by Type 2019 & 2032
- Table 72: Global Data Masking Industry Revenue Million Forecast, by Deployment 2019 & 2032
- Table 73: Global Data Masking Industry Revenue Million Forecast, by End-user Industry 2019 & 2032
- Table 74: Global Data Masking Industry Revenue Million Forecast, by Country 2019 & 2032
- Table 75: Global Data Masking Industry Revenue Million Forecast, by Type 2019 & 2032
- Table 76: Global Data Masking Industry Revenue Million Forecast, by Deployment 2019 & 2032
- Table 77: Global Data Masking Industry Revenue Million Forecast, by End-user Industry 2019 & 2032
- Table 78: Global Data Masking Industry Revenue Million Forecast, by Country 2019 & 2032
Frequently Asked Questions
1. What is the projected Compound Annual Growth Rate (CAGR) of the Data Masking Industry?
The projected CAGR is approximately 14.71%.
2. Which companies are prominent players in the Data Masking Industry?
Key companies in the market include Delphix Corp, IBM Corporation, Mentis Inc (Mage), Solix Technologies Inc, Innovative Routines International Inc, Oracle Corporation, Informatica LLC, K2view Ltd, Broadcom Inc *List Not Exhaustive, Red Gate Software Ltd.
3. What are the main segments of the Data Masking Industry?
The market segments include Type, Deployment, End-user Industry.
4. Can you provide details about the market size?
The market size is estimated to be USD 0.94 Million as of 2022.
5. What are some drivers contributing to market growth?
Increase of Organizational Data Volumes.
6. What are the notable trends driving market growth?
The BFSI Industry to Witness a Significant Growth.
7. Are there any restraints impacting market growth?
Technological Complexities Associated with Data Masking Challenge the Market Growth.
8. Can you provide examples of recent developments in the market?
August 2022 - IBM released a new update, IBM Cloud Pak Data V4.5.x, of Advanced data masking, extended the capability of data protection and location rules by protecting the data with advanced de-identification techniques. The techniques preserve the data's format and integrity. Because of the high data utility, data users such as data scientists, business analysts, and application developers may generate high-quality insights from protected data.
9. What pricing options are available for accessing the report?
Pricing options include single-user, multi-user, and enterprise licenses priced at USD 4750, USD 5250, and USD 8750 respectively.
10. Is the market size provided in terms of value or volume?
The market size is provided in terms of value, measured in Million.
11. Are there any specific market keywords associated with the report?
Yes, the market keyword associated with the report is "Data Masking Industry," which aids in identifying and referencing the specific market segment covered.
12. How do I determine which pricing option suits my needs best?
The pricing options vary based on user requirements and access needs. Individual users may opt for single-user licenses, while businesses requiring broader access may choose multi-user or enterprise licenses for cost-effective access to the report.
13. Are there any additional resources or data provided in the Data Masking Industry report?
While the report offers comprehensive insights, it's advisable to review the specific contents or supplementary materials provided to ascertain if additional resources or data are available.
14. How can I stay updated on further developments or reports in the Data Masking Industry?
To stay informed about further developments, trends, and reports in the Data Masking Industry, consider subscribing to industry newsletters, following relevant companies and organizations, or regularly checking reputable industry news sources and publications.
Methodology
Step 1 - Identification of Relevant Samples Size from Population Database


Step 2 - Approaches for Defining Global Market Size (Value, Volume* & Price*)

Note*: In applicable scenarios
Step 3 - Data Sources
Primary Research
- Web Analytics
- Survey Reports
- Research Institute
- Latest Research Reports
- Opinion Leaders
Secondary Research
- Annual Reports
- White Paper
- Latest Press Release
- Industry Association
- Paid Database
- Investor Presentations

Step 4 - Data Triangulation
Involves using different sources of information in order to increase the validity of a study
These sources are likely to be stakeholders in a program - participants, other researchers, program staff, other community members, and so on.
Then we put all data in single framework & apply various statistical tools to find out the dynamic on the market.
During the analysis stage, feedback from the stakeholder groups would be compared to determine areas of agreement as well as areas of divergence


