
Key Insights
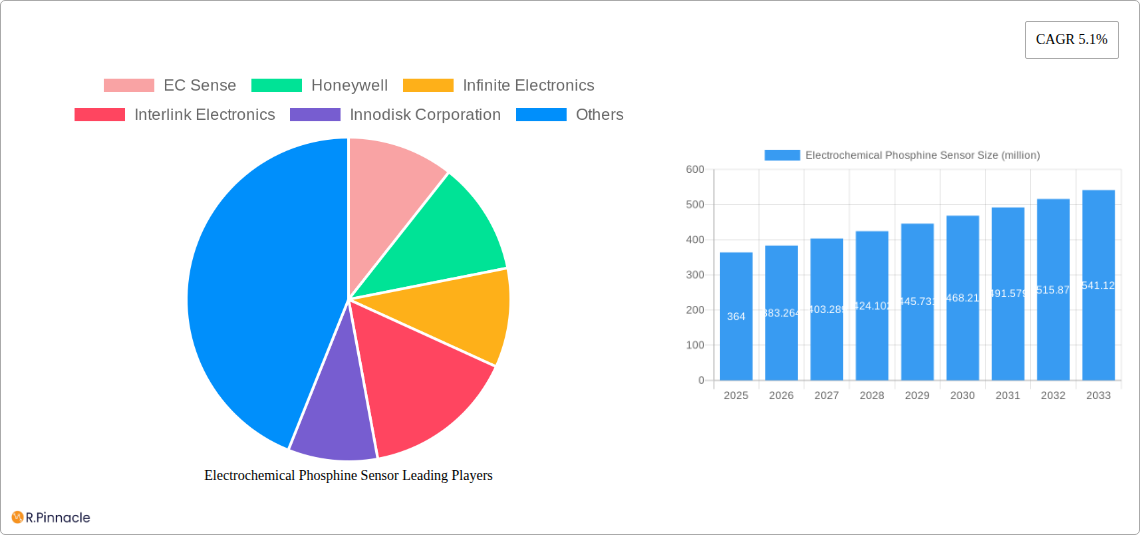
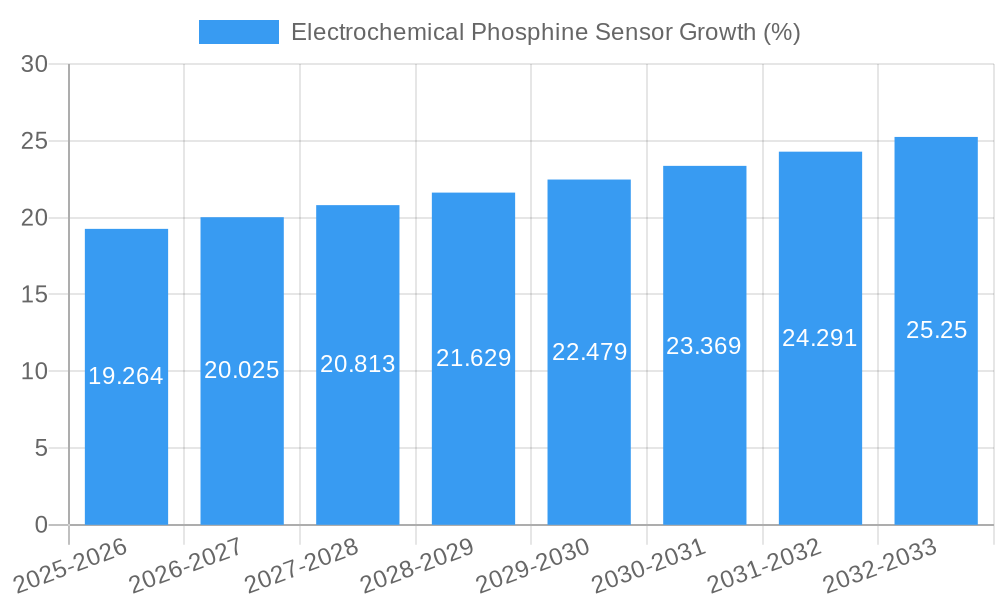
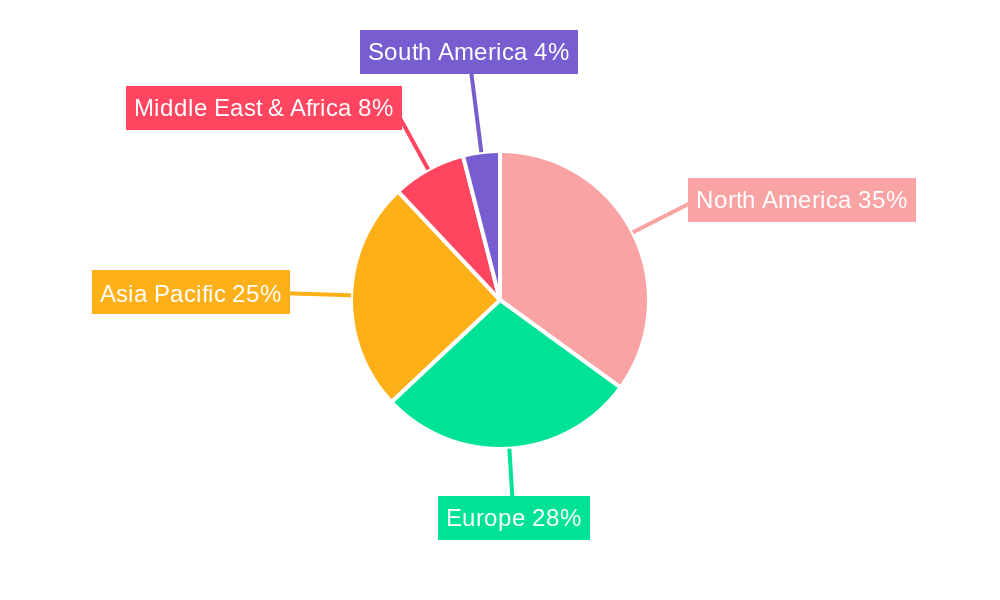
The electrochemical phosphine sensor market, valued at $364 million in 2025, is projected to experience robust growth, driven by increasing demand across various sectors. The Compound Annual Growth Rate (CAGR) of 5.1% from 2025 to 2033 indicates a steady expansion, fueled primarily by stringent safety regulations in industries like petrochemicals and semiconductor manufacturing, where phosphine leaks pose significant hazards. Growth is further propelled by the rising adoption of advanced sensor technologies in agricultural production for monitoring grain storage and preventing pest infestations. The market is segmented by application (petrochemical, semiconductor, agriculture, others) and type (wall-mounted, pipe-mounted), offering diverse solutions tailored to specific needs. While the market faces restraints such as high initial investment costs and the need for specialized maintenance, technological advancements leading to more reliable, compact, and cost-effective sensors are expected to mitigate these challenges. The competitive landscape comprises both established players and emerging companies, fostering innovation and driving market penetration. Regional growth is anticipated to be strong across North America and Asia Pacific, driven by substantial industrial activity and government initiatives promoting environmental safety.
The market's steady growth trajectory reflects a broader trend toward enhanced safety and environmental monitoring. The increasing awareness of phosphine's toxicity, coupled with stricter regulatory compliance, necessitates the widespread adoption of accurate and reliable detection systems. The continued technological improvements in sensor technology, including advancements in miniaturization, improved sensitivity, and wireless connectivity, will facilitate wider integration into existing infrastructure and create new applications. The diverse range of applications, from large-scale industrial settings to smaller agricultural operations, ensures a broad and resilient market base. Furthermore, the ongoing research and development in electrochemical sensor technology, including exploring new materials and fabrication techniques, will further contribute to market expansion and competitiveness in the coming years.
Electrochemical Phosphine Sensor Market Report: 2019-2033
This comprehensive report provides an in-depth analysis of the global electrochemical phosphine sensor market, offering invaluable insights for industry professionals, investors, and strategic decision-makers. The study covers the period from 2019 to 2033, with a focus on the forecast period of 2025-2033 and a base year of 2025. The market's size is projected to reach several million USD by 2033, exhibiting substantial growth potential. This report meticulously analyzes market structure, dynamics, leading players, and future trends, providing actionable intelligence for informed strategies.
Electrochemical Phosphine Sensor Market Structure & Innovation Trends
The global electrochemical phosphine sensor market is moderately fragmented, with several key players vying for market share. EC Sense, Honeywell, Infinite Electronics, Interlink Electronics, Innodisk Corporation, Crowcon, RC Systems, Zhengzhou Winsen Electronics Technology, Guangzhou Luftmy Intelligent Technology, Shenzhen Singoan Electronic Technology, Skesen, Prsens, Advanced Sensors Application, and Sangbay are some of the prominent companies shaping the market landscape. Market share data reveals that the top five players hold approximately xx% of the global market in 2025, while the remaining xx% is distributed among numerous smaller participants. Innovation is driven by the need for higher sensitivity, improved accuracy, and longer lifespan sensors. Stringent regulatory frameworks regarding phosphine emissions in various industries, particularly in petrochemical and semiconductor manufacturing, act as a significant catalyst for market growth. Furthermore, M&A activities within the sector have been modest, with a total deal value of approximately $xx million observed during the historical period (2019-2024). Substitutes like optical sensors are emerging but currently hold a small market share due to their higher cost and complexity. End-user demographics are heavily skewed towards large industrial players in the aforementioned industries, with a growing demand from smaller businesses as regulations become more stringent.
Electrochemical Phosphine Sensor Market Dynamics & Trends
The electrochemical phosphine sensor market is experiencing robust growth, with a projected CAGR of xx% during the forecast period (2025-2033). Several factors contribute to this growth. Firstly, increasing awareness of the dangers of phosphine exposure and stricter regulations across various sectors are driving demand for reliable and accurate detection systems. Secondly, technological advancements, such as the development of miniaturized sensors and improved signal processing techniques, enhance sensor performance and reduce costs. Consumer preferences are shifting towards wireless and remotely monitored sensor solutions, facilitating data analysis and predictive maintenance. The competitive landscape is characterized by intense rivalry, with companies focusing on product differentiation, technological innovation, and strategic partnerships to gain a competitive edge. Market penetration remains relatively high in developed regions, yet untapped potential in developing economies offers significant opportunities for expansion, particularly in agricultural production where phosphine fumigation remains prevalent.
Dominant Regions & Segments in Electrochemical Phosphine Sensor
The Petrochemical Industry segment dominates the electrochemical phosphine sensor market, driven by stringent safety regulations and the inherent risks associated with phosphine handling. The Semiconductor Manufacturing segment follows closely, with the high sensitivity and accuracy demands driving adoption of advanced sensor technologies.
- Key Drivers in Petrochemical Industry: Stringent safety regulations, high concentration of phosphine use, large-scale industrial operations, and increasing automation.
- Key Drivers in Semiconductor Manufacturing: Ultra-high purity requirements, stringent process control, and sophisticated safety protocols.
- Key Drivers in Agricultural Production: Growing awareness of phosphine's toxicity, need for effective pest control, and increased government regulations.
- Wall-Mounted Sensors: Preferred for ease of installation and monitoring in larger areas.
- Pipe-Mounted Sensors: Ideal for direct line monitoring within process pipelines, providing real-time data.
The Asia-Pacific region is anticipated to be the leading region owing to rapid industrialization, a burgeoning petrochemical sector, and increasing investments in semiconductor manufacturing. North America and Europe also hold substantial market shares, driven by stringent regulatory compliance and established technological advancements.
Electrochemical Phosphine Sensor Product Innovations
Recent innovations in electrochemical phosphine sensors have focused on improving sensitivity, selectivity, and longevity. Miniaturization techniques are enabling the development of compact and portable sensors, expanding their applications to diverse settings. Wireless connectivity and advanced data analytics features are enhancing monitoring capabilities and enabling remote management. The incorporation of integrated microprocessors allows for self-calibration and enhanced data processing, increasing sensor reliability and reducing the need for manual intervention. These innovations cater to the evolving market needs for cost-effective, reliable, and user-friendly sensor solutions.
Report Scope & Segmentation Analysis
This report provides a comprehensive analysis of the electrochemical phosphine sensor market, segmented by application (Petrochemical Industry, Semiconductor Manufacturing, Agricultural Production, Others) and type (Wall-Mounted, Pipe-Mounted). Each segment's market size, growth projections, and competitive dynamics are thoroughly examined. The Petrochemical Industry segment displays a significant market share, followed by Semiconductor Manufacturing, with agricultural production showing considerable growth potential. Wall-mounted sensors dominate due to widespread applicability, while pipe-mounted sensors exhibit a steady growth trajectory driven by increased demand for real-time monitoring within process pipelines.
Key Drivers of Electrochemical Phosphine Sensor Growth
The growth of the electrochemical phosphine sensor market is primarily propelled by increasingly stringent environmental regulations, rising safety concerns, and the continuous need for precise phosphine detection in various industrial processes. Technological advancements, such as enhanced sensor sensitivity and improved data analytics, also contribute significantly. Furthermore, the growing adoption of automation and remote monitoring solutions drives market expansion. Cost-effective sensor designs also play a crucial role in expanding market access across diverse industries.
Challenges in the Electrochemical Phosphine Sensor Sector
The electrochemical phosphine sensor market faces challenges such as the high initial investment cost associated with implementing advanced sensor technologies. Supply chain disruptions and fluctuations in raw material prices can impact production costs and profitability. Furthermore, the need for continuous calibration and maintenance can pose operational challenges. The competitive landscape, with several established and emerging players, creates pressure for continuous innovation and cost optimization.
Emerging Opportunities in Electrochemical Phosphine Sensor
Emerging opportunities reside in the development of more sensitive and selective sensors, enabling detection of trace levels of phosphine. The integration of IoT technologies and cloud-based data analytics platforms offers further opportunities to enhance remote monitoring capabilities. Expanding into niche markets, such as food safety and environmental monitoring, presents potential for growth. The adoption of AI-powered algorithms can enhance data interpretation and predictive maintenance strategies.
Leading Players in the Electrochemical Phosphine Sensor Market
- EC Sense
- Honeywell
- Infinite Electronics
- Interlink Electronics
- Innodisk Corporation
- Crowcon
- RC Systems
- Zhengzhou Winsen Electronics Technology
- Guangzhou Luftmy Intelligent Technology
- Shenzhen Singoan Electronic Technology
- Skesen
- Prsens
- Advanced Sensors Application
- Sangbay
Key Developments in Electrochemical Phosphine Sensor Industry
- Jan 2023: EC Sense launched a new generation of electrochemical phosphine sensors with improved sensitivity and longer lifespan.
- Aug 2022: Honeywell acquired a smaller sensor technology company, expanding its product portfolio.
- Mar 2021: Zhengzhou Winsen Electronics Technology secured a major contract for phosphine sensors in the petrochemical sector.
- Oct 2020: A new regulatory standard for phosphine emissions was implemented in several European countries.
Future Outlook for Electrochemical Phosphine Sensor Market
The future outlook for the electrochemical phosphine sensor market is positive, driven by ongoing technological advancements, increasing regulatory scrutiny, and the growing awareness of phosphine's health and environmental risks. The integration of smart sensor technologies, advanced data analytics, and improved wireless connectivity will enhance monitoring capabilities and drive market expansion. New applications in diverse sectors, coupled with cost reduction strategies, promise significant growth potential in the coming years.
Electrochemical Phosphine Sensor Segmentation
-
1. Application
- 1.1. Petrochemical Industry
- 1.2. Semiconductor Manufacturing
- 1.3. Agricultural Production
- 1.4. Others
-
2. Type
- 2.1. Wall-Mounted
- 2.2. Pipe-Mounted
Electrochemical Phosphine Sensor Segmentation By Geography
-
1. North America
- 1.1. United States
- 1.2. Canada
- 1.3. Mexico
-
2. South America
- 2.1. Brazil
- 2.2. Argentina
- 2.3. Rest of South America
-
3. Europe
- 3.1. United Kingdom
- 3.2. Germany
- 3.3. France
- 3.4. Italy
- 3.5. Spain
- 3.6. Russia
- 3.7. Benelux
- 3.8. Nordics
- 3.9. Rest of Europe
-
4. Middle East & Africa
- 4.1. Turkey
- 4.2. Israel
- 4.3. GCC
- 4.4. North Africa
- 4.5. South Africa
- 4.6. Rest of Middle East & Africa
-
5. Asia Pacific
- 5.1. China
- 5.2. India
- 5.3. Japan
- 5.4. South Korea
- 5.5. ASEAN
- 5.6. Oceania
- 5.7. Rest of Asia Pacific
Electrochemical Phosphine Sensor REPORT HIGHLIGHTS
| Aspects | Details |
|---|---|
| Study Period | 2019-2033 |
| Base Year | 2024 |
| Estimated Year | 2025 |
| Forecast Period | 2025-2033 |
| Historical Period | 2019-2024 |
| Growth Rate | CAGR of 5.1% from 2019-2033 |
| Segmentation |
|
Table of Contents
- 1. Introduction
- 1.1. Research Scope
- 1.2. Market Segmentation
- 1.3. Research Methodology
- 1.4. Definitions and Assumptions
- 2. Executive Summary
- 2.1. Introduction
- 3. Market Dynamics
- 3.1. Introduction
- 3.2. Market Drivers
- 3.3. Market Restrains
- 3.4. Market Trends
- 4. Market Factor Analysis
- 4.1. Porters Five Forces
- 4.2. Supply/Value Chain
- 4.3. PESTEL analysis
- 4.4. Market Entropy
- 4.5. Patent/Trademark Analysis
- 5. Global Electrochemical Phosphine Sensor Analysis, Insights and Forecast, 2019-2031
- 5.1. Market Analysis, Insights and Forecast - by Application
- 5.1.1. Petrochemical Industry
- 5.1.2. Semiconductor Manufacturing
- 5.1.3. Agricultural Production
- 5.1.4. Others
- 5.2. Market Analysis, Insights and Forecast - by Type
- 5.2.1. Wall-Mounted
- 5.2.2. Pipe-Mounted
- 5.3. Market Analysis, Insights and Forecast - by Region
- 5.3.1. North America
- 5.3.2. South America
- 5.3.3. Europe
- 5.3.4. Middle East & Africa
- 5.3.5. Asia Pacific
- 5.1. Market Analysis, Insights and Forecast - by Application
- 6. North America Electrochemical Phosphine Sensor Analysis, Insights and Forecast, 2019-2031
- 6.1. Market Analysis, Insights and Forecast - by Application
- 6.1.1. Petrochemical Industry
- 6.1.2. Semiconductor Manufacturing
- 6.1.3. Agricultural Production
- 6.1.4. Others
- 6.2. Market Analysis, Insights and Forecast - by Type
- 6.2.1. Wall-Mounted
- 6.2.2. Pipe-Mounted
- 6.1. Market Analysis, Insights and Forecast - by Application
- 7. South America Electrochemical Phosphine Sensor Analysis, Insights and Forecast, 2019-2031
- 7.1. Market Analysis, Insights and Forecast - by Application
- 7.1.1. Petrochemical Industry
- 7.1.2. Semiconductor Manufacturing
- 7.1.3. Agricultural Production
- 7.1.4. Others
- 7.2. Market Analysis, Insights and Forecast - by Type
- 7.2.1. Wall-Mounted
- 7.2.2. Pipe-Mounted
- 7.1. Market Analysis, Insights and Forecast - by Application
- 8. Europe Electrochemical Phosphine Sensor Analysis, Insights and Forecast, 2019-2031
- 8.1. Market Analysis, Insights and Forecast - by Application
- 8.1.1. Petrochemical Industry
- 8.1.2. Semiconductor Manufacturing
- 8.1.3. Agricultural Production
- 8.1.4. Others
- 8.2. Market Analysis, Insights and Forecast - by Type
- 8.2.1. Wall-Mounted
- 8.2.2. Pipe-Mounted
- 8.1. Market Analysis, Insights and Forecast - by Application
- 9. Middle East & Africa Electrochemical Phosphine Sensor Analysis, Insights and Forecast, 2019-2031
- 9.1. Market Analysis, Insights and Forecast - by Application
- 9.1.1. Petrochemical Industry
- 9.1.2. Semiconductor Manufacturing
- 9.1.3. Agricultural Production
- 9.1.4. Others
- 9.2. Market Analysis, Insights and Forecast - by Type
- 9.2.1. Wall-Mounted
- 9.2.2. Pipe-Mounted
- 9.1. Market Analysis, Insights and Forecast - by Application
- 10. Asia Pacific Electrochemical Phosphine Sensor Analysis, Insights and Forecast, 2019-2031
- 10.1. Market Analysis, Insights and Forecast - by Application
- 10.1.1. Petrochemical Industry
- 10.1.2. Semiconductor Manufacturing
- 10.1.3. Agricultural Production
- 10.1.4. Others
- 10.2. Market Analysis, Insights and Forecast - by Type
- 10.2.1. Wall-Mounted
- 10.2.2. Pipe-Mounted
- 10.1. Market Analysis, Insights and Forecast - by Application
- 11. Competitive Analysis
- 11.1. Global Market Share Analysis 2024
- 11.2. Company Profiles
- 11.2.1 EC Sense
- 11.2.1.1. Overview
- 11.2.1.2. Products
- 11.2.1.3. SWOT Analysis
- 11.2.1.4. Recent Developments
- 11.2.1.5. Financials (Based on Availability)
- 11.2.2 Honeywell
- 11.2.2.1. Overview
- 11.2.2.2. Products
- 11.2.2.3. SWOT Analysis
- 11.2.2.4. Recent Developments
- 11.2.2.5. Financials (Based on Availability)
- 11.2.3 Infinite Electronics
- 11.2.3.1. Overview
- 11.2.3.2. Products
- 11.2.3.3. SWOT Analysis
- 11.2.3.4. Recent Developments
- 11.2.3.5. Financials (Based on Availability)
- 11.2.4 Interlink Electronics
- 11.2.4.1. Overview
- 11.2.4.2. Products
- 11.2.4.3. SWOT Analysis
- 11.2.4.4. Recent Developments
- 11.2.4.5. Financials (Based on Availability)
- 11.2.5 Innodisk Corporation
- 11.2.5.1. Overview
- 11.2.5.2. Products
- 11.2.5.3. SWOT Analysis
- 11.2.5.4. Recent Developments
- 11.2.5.5. Financials (Based on Availability)
- 11.2.6 Crowcon
- 11.2.6.1. Overview
- 11.2.6.2. Products
- 11.2.6.3. SWOT Analysis
- 11.2.6.4. Recent Developments
- 11.2.6.5. Financials (Based on Availability)
- 11.2.7 RC Systems
- 11.2.7.1. Overview
- 11.2.7.2. Products
- 11.2.7.3. SWOT Analysis
- 11.2.7.4. Recent Developments
- 11.2.7.5. Financials (Based on Availability)
- 11.2.8 Zhengzhou Winsen Electronics Technology
- 11.2.8.1. Overview
- 11.2.8.2. Products
- 11.2.8.3. SWOT Analysis
- 11.2.8.4. Recent Developments
- 11.2.8.5. Financials (Based on Availability)
- 11.2.9 Guangzhou Luftmy Intelligent Technology
- 11.2.9.1. Overview
- 11.2.9.2. Products
- 11.2.9.3. SWOT Analysis
- 11.2.9.4. Recent Developments
- 11.2.9.5. Financials (Based on Availability)
- 11.2.10 Shenzhen Singoan Electronic Technology
- 11.2.10.1. Overview
- 11.2.10.2. Products
- 11.2.10.3. SWOT Analysis
- 11.2.10.4. Recent Developments
- 11.2.10.5. Financials (Based on Availability)
- 11.2.11 Skesen
- 11.2.11.1. Overview
- 11.2.11.2. Products
- 11.2.11.3. SWOT Analysis
- 11.2.11.4. Recent Developments
- 11.2.11.5. Financials (Based on Availability)
- 11.2.12 Prsens
- 11.2.12.1. Overview
- 11.2.12.2. Products
- 11.2.12.3. SWOT Analysis
- 11.2.12.4. Recent Developments
- 11.2.12.5. Financials (Based on Availability)
- 11.2.13 Advanced Sensors Application
- 11.2.13.1. Overview
- 11.2.13.2. Products
- 11.2.13.3. SWOT Analysis
- 11.2.13.4. Recent Developments
- 11.2.13.5. Financials (Based on Availability)
- 11.2.14 Sangbay
- 11.2.14.1. Overview
- 11.2.14.2. Products
- 11.2.14.3. SWOT Analysis
- 11.2.14.4. Recent Developments
- 11.2.14.5. Financials (Based on Availability)
- 11.2.1 EC Sense
List of Figures
- Figure 1: Global Electrochemical Phosphine Sensor Revenue Breakdown (million, %) by Region 2024 & 2032
- Figure 2: Global Electrochemical Phosphine Sensor Volume Breakdown (K, %) by Region 2024 & 2032
- Figure 3: North America Electrochemical Phosphine Sensor Revenue (million), by Application 2024 & 2032
- Figure 4: North America Electrochemical Phosphine Sensor Volume (K), by Application 2024 & 2032
- Figure 5: North America Electrochemical Phosphine Sensor Revenue Share (%), by Application 2024 & 2032
- Figure 6: North America Electrochemical Phosphine Sensor Volume Share (%), by Application 2024 & 2032
- Figure 7: North America Electrochemical Phosphine Sensor Revenue (million), by Type 2024 & 2032
- Figure 8: North America Electrochemical Phosphine Sensor Volume (K), by Type 2024 & 2032
- Figure 9: North America Electrochemical Phosphine Sensor Revenue Share (%), by Type 2024 & 2032
- Figure 10: North America Electrochemical Phosphine Sensor Volume Share (%), by Type 2024 & 2032
- Figure 11: North America Electrochemical Phosphine Sensor Revenue (million), by Country 2024 & 2032
- Figure 12: North America Electrochemical Phosphine Sensor Volume (K), by Country 2024 & 2032
- Figure 13: North America Electrochemical Phosphine Sensor Revenue Share (%), by Country 2024 & 2032
- Figure 14: North America Electrochemical Phosphine Sensor Volume Share (%), by Country 2024 & 2032
- Figure 15: South America Electrochemical Phosphine Sensor Revenue (million), by Application 2024 & 2032
- Figure 16: South America Electrochemical Phosphine Sensor Volume (K), by Application 2024 & 2032
- Figure 17: South America Electrochemical Phosphine Sensor Revenue Share (%), by Application 2024 & 2032
- Figure 18: South America Electrochemical Phosphine Sensor Volume Share (%), by Application 2024 & 2032
- Figure 19: South America Electrochemical Phosphine Sensor Revenue (million), by Type 2024 & 2032
- Figure 20: South America Electrochemical Phosphine Sensor Volume (K), by Type 2024 & 2032
- Figure 21: South America Electrochemical Phosphine Sensor Revenue Share (%), by Type 2024 & 2032
- Figure 22: South America Electrochemical Phosphine Sensor Volume Share (%), by Type 2024 & 2032
- Figure 23: South America Electrochemical Phosphine Sensor Revenue (million), by Country 2024 & 2032
- Figure 24: South America Electrochemical Phosphine Sensor Volume (K), by Country 2024 & 2032
- Figure 25: South America Electrochemical Phosphine Sensor Revenue Share (%), by Country 2024 & 2032
- Figure 26: South America Electrochemical Phosphine Sensor Volume Share (%), by Country 2024 & 2032
- Figure 27: Europe Electrochemical Phosphine Sensor Revenue (million), by Application 2024 & 2032
- Figure 28: Europe Electrochemical Phosphine Sensor Volume (K), by Application 2024 & 2032
- Figure 29: Europe Electrochemical Phosphine Sensor Revenue Share (%), by Application 2024 & 2032
- Figure 30: Europe Electrochemical Phosphine Sensor Volume Share (%), by Application 2024 & 2032
- Figure 31: Europe Electrochemical Phosphine Sensor Revenue (million), by Type 2024 & 2032
- Figure 32: Europe Electrochemical Phosphine Sensor Volume (K), by Type 2024 & 2032
- Figure 33: Europe Electrochemical Phosphine Sensor Revenue Share (%), by Type 2024 & 2032
- Figure 34: Europe Electrochemical Phosphine Sensor Volume Share (%), by Type 2024 & 2032
- Figure 35: Europe Electrochemical Phosphine Sensor Revenue (million), by Country 2024 & 2032
- Figure 36: Europe Electrochemical Phosphine Sensor Volume (K), by Country 2024 & 2032
- Figure 37: Europe Electrochemical Phosphine Sensor Revenue Share (%), by Country 2024 & 2032
- Figure 38: Europe Electrochemical Phosphine Sensor Volume Share (%), by Country 2024 & 2032
- Figure 39: Middle East & Africa Electrochemical Phosphine Sensor Revenue (million), by Application 2024 & 2032
- Figure 40: Middle East & Africa Electrochemical Phosphine Sensor Volume (K), by Application 2024 & 2032
- Figure 41: Middle East & Africa Electrochemical Phosphine Sensor Revenue Share (%), by Application 2024 & 2032
- Figure 42: Middle East & Africa Electrochemical Phosphine Sensor Volume Share (%), by Application 2024 & 2032
- Figure 43: Middle East & Africa Electrochemical Phosphine Sensor Revenue (million), by Type 2024 & 2032
- Figure 44: Middle East & Africa Electrochemical Phosphine Sensor Volume (K), by Type 2024 & 2032
- Figure 45: Middle East & Africa Electrochemical Phosphine Sensor Revenue Share (%), by Type 2024 & 2032
- Figure 46: Middle East & Africa Electrochemical Phosphine Sensor Volume Share (%), by Type 2024 & 2032
- Figure 47: Middle East & Africa Electrochemical Phosphine Sensor Revenue (million), by Country 2024 & 2032
- Figure 48: Middle East & Africa Electrochemical Phosphine Sensor Volume (K), by Country 2024 & 2032
- Figure 49: Middle East & Africa Electrochemical Phosphine Sensor Revenue Share (%), by Country 2024 & 2032
- Figure 50: Middle East & Africa Electrochemical Phosphine Sensor Volume Share (%), by Country 2024 & 2032
- Figure 51: Asia Pacific Electrochemical Phosphine Sensor Revenue (million), by Application 2024 & 2032
- Figure 52: Asia Pacific Electrochemical Phosphine Sensor Volume (K), by Application 2024 & 2032
- Figure 53: Asia Pacific Electrochemical Phosphine Sensor Revenue Share (%), by Application 2024 & 2032
- Figure 54: Asia Pacific Electrochemical Phosphine Sensor Volume Share (%), by Application 2024 & 2032
- Figure 55: Asia Pacific Electrochemical Phosphine Sensor Revenue (million), by Type 2024 & 2032
- Figure 56: Asia Pacific Electrochemical Phosphine Sensor Volume (K), by Type 2024 & 2032
- Figure 57: Asia Pacific Electrochemical Phosphine Sensor Revenue Share (%), by Type 2024 & 2032
- Figure 58: Asia Pacific Electrochemical Phosphine Sensor Volume Share (%), by Type 2024 & 2032
- Figure 59: Asia Pacific Electrochemical Phosphine Sensor Revenue (million), by Country 2024 & 2032
- Figure 60: Asia Pacific Electrochemical Phosphine Sensor Volume (K), by Country 2024 & 2032
- Figure 61: Asia Pacific Electrochemical Phosphine Sensor Revenue Share (%), by Country 2024 & 2032
- Figure 62: Asia Pacific Electrochemical Phosphine Sensor Volume Share (%), by Country 2024 & 2032
List of Tables
- Table 1: Global Electrochemical Phosphine Sensor Revenue million Forecast, by Region 2019 & 2032
- Table 2: Global Electrochemical Phosphine Sensor Volume K Forecast, by Region 2019 & 2032
- Table 3: Global Electrochemical Phosphine Sensor Revenue million Forecast, by Application 2019 & 2032
- Table 4: Global Electrochemical Phosphine Sensor Volume K Forecast, by Application 2019 & 2032
- Table 5: Global Electrochemical Phosphine Sensor Revenue million Forecast, by Type 2019 & 2032
- Table 6: Global Electrochemical Phosphine Sensor Volume K Forecast, by Type 2019 & 2032
- Table 7: Global Electrochemical Phosphine Sensor Revenue million Forecast, by Region 2019 & 2032
- Table 8: Global Electrochemical Phosphine Sensor Volume K Forecast, by Region 2019 & 2032
- Table 9: Global Electrochemical Phosphine Sensor Revenue million Forecast, by Application 2019 & 2032
- Table 10: Global Electrochemical Phosphine Sensor Volume K Forecast, by Application 2019 & 2032
- Table 11: Global Electrochemical Phosphine Sensor Revenue million Forecast, by Type 2019 & 2032
- Table 12: Global Electrochemical Phosphine Sensor Volume K Forecast, by Type 2019 & 2032
- Table 13: Global Electrochemical Phosphine Sensor Revenue million Forecast, by Country 2019 & 2032
- Table 14: Global Electrochemical Phosphine Sensor Volume K Forecast, by Country 2019 & 2032
- Table 15: United States Electrochemical Phosphine Sensor Revenue (million) Forecast, by Application 2019 & 2032
- Table 16: United States Electrochemical Phosphine Sensor Volume (K) Forecast, by Application 2019 & 2032
- Table 17: Canada Electrochemical Phosphine Sensor Revenue (million) Forecast, by Application 2019 & 2032
- Table 18: Canada Electrochemical Phosphine Sensor Volume (K) Forecast, by Application 2019 & 2032
- Table 19: Mexico Electrochemical Phosphine Sensor Revenue (million) Forecast, by Application 2019 & 2032
- Table 20: Mexico Electrochemical Phosphine Sensor Volume (K) Forecast, by Application 2019 & 2032
- Table 21: Global Electrochemical Phosphine Sensor Revenue million Forecast, by Application 2019 & 2032
- Table 22: Global Electrochemical Phosphine Sensor Volume K Forecast, by Application 2019 & 2032
- Table 23: Global Electrochemical Phosphine Sensor Revenue million Forecast, by Type 2019 & 2032
- Table 24: Global Electrochemical Phosphine Sensor Volume K Forecast, by Type 2019 & 2032
- Table 25: Global Electrochemical Phosphine Sensor Revenue million Forecast, by Country 2019 & 2032
- Table 26: Global Electrochemical Phosphine Sensor Volume K Forecast, by Country 2019 & 2032
- Table 27: Brazil Electrochemical Phosphine Sensor Revenue (million) Forecast, by Application 2019 & 2032
- Table 28: Brazil Electrochemical Phosphine Sensor Volume (K) Forecast, by Application 2019 & 2032
- Table 29: Argentina Electrochemical Phosphine Sensor Revenue (million) Forecast, by Application 2019 & 2032
- Table 30: Argentina Electrochemical Phosphine Sensor Volume (K) Forecast, by Application 2019 & 2032
- Table 31: Rest of South America Electrochemical Phosphine Sensor Revenue (million) Forecast, by Application 2019 & 2032
- Table 32: Rest of South America Electrochemical Phosphine Sensor Volume (K) Forecast, by Application 2019 & 2032
- Table 33: Global Electrochemical Phosphine Sensor Revenue million Forecast, by Application 2019 & 2032
- Table 34: Global Electrochemical Phosphine Sensor Volume K Forecast, by Application 2019 & 2032
- Table 35: Global Electrochemical Phosphine Sensor Revenue million Forecast, by Type 2019 & 2032
- Table 36: Global Electrochemical Phosphine Sensor Volume K Forecast, by Type 2019 & 2032
- Table 37: Global Electrochemical Phosphine Sensor Revenue million Forecast, by Country 2019 & 2032
- Table 38: Global Electrochemical Phosphine Sensor Volume K Forecast, by Country 2019 & 2032
- Table 39: United Kingdom Electrochemical Phosphine Sensor Revenue (million) Forecast, by Application 2019 & 2032
- Table 40: United Kingdom Electrochemical Phosphine Sensor Volume (K) Forecast, by Application 2019 & 2032
- Table 41: Germany Electrochemical Phosphine Sensor Revenue (million) Forecast, by Application 2019 & 2032
- Table 42: Germany Electrochemical Phosphine Sensor Volume (K) Forecast, by Application 2019 & 2032
- Table 43: France Electrochemical Phosphine Sensor Revenue (million) Forecast, by Application 2019 & 2032
- Table 44: France Electrochemical Phosphine Sensor Volume (K) Forecast, by Application 2019 & 2032
- Table 45: Italy Electrochemical Phosphine Sensor Revenue (million) Forecast, by Application 2019 & 2032
- Table 46: Italy Electrochemical Phosphine Sensor Volume (K) Forecast, by Application 2019 & 2032
- Table 47: Spain Electrochemical Phosphine Sensor Revenue (million) Forecast, by Application 2019 & 2032
- Table 48: Spain Electrochemical Phosphine Sensor Volume (K) Forecast, by Application 2019 & 2032
- Table 49: Russia Electrochemical Phosphine Sensor Revenue (million) Forecast, by Application 2019 & 2032
- Table 50: Russia Electrochemical Phosphine Sensor Volume (K) Forecast, by Application 2019 & 2032
- Table 51: Benelux Electrochemical Phosphine Sensor Revenue (million) Forecast, by Application 2019 & 2032
- Table 52: Benelux Electrochemical Phosphine Sensor Volume (K) Forecast, by Application 2019 & 2032
- Table 53: Nordics Electrochemical Phosphine Sensor Revenue (million) Forecast, by Application 2019 & 2032
- Table 54: Nordics Electrochemical Phosphine Sensor Volume (K) Forecast, by Application 2019 & 2032
- Table 55: Rest of Europe Electrochemical Phosphine Sensor Revenue (million) Forecast, by Application 2019 & 2032
- Table 56: Rest of Europe Electrochemical Phosphine Sensor Volume (K) Forecast, by Application 2019 & 2032
- Table 57: Global Electrochemical Phosphine Sensor Revenue million Forecast, by Application 2019 & 2032
- Table 58: Global Electrochemical Phosphine Sensor Volume K Forecast, by Application 2019 & 2032
- Table 59: Global Electrochemical Phosphine Sensor Revenue million Forecast, by Type 2019 & 2032
- Table 60: Global Electrochemical Phosphine Sensor Volume K Forecast, by Type 2019 & 2032
- Table 61: Global Electrochemical Phosphine Sensor Revenue million Forecast, by Country 2019 & 2032
- Table 62: Global Electrochemical Phosphine Sensor Volume K Forecast, by Country 2019 & 2032
- Table 63: Turkey Electrochemical Phosphine Sensor Revenue (million) Forecast, by Application 2019 & 2032
- Table 64: Turkey Electrochemical Phosphine Sensor Volume (K) Forecast, by Application 2019 & 2032
- Table 65: Israel Electrochemical Phosphine Sensor Revenue (million) Forecast, by Application 2019 & 2032
- Table 66: Israel Electrochemical Phosphine Sensor Volume (K) Forecast, by Application 2019 & 2032
- Table 67: GCC Electrochemical Phosphine Sensor Revenue (million) Forecast, by Application 2019 & 2032
- Table 68: GCC Electrochemical Phosphine Sensor Volume (K) Forecast, by Application 2019 & 2032
- Table 69: North Africa Electrochemical Phosphine Sensor Revenue (million) Forecast, by Application 2019 & 2032
- Table 70: North Africa Electrochemical Phosphine Sensor Volume (K) Forecast, by Application 2019 & 2032
- Table 71: South Africa Electrochemical Phosphine Sensor Revenue (million) Forecast, by Application 2019 & 2032
- Table 72: South Africa Electrochemical Phosphine Sensor Volume (K) Forecast, by Application 2019 & 2032
- Table 73: Rest of Middle East & Africa Electrochemical Phosphine Sensor Revenue (million) Forecast, by Application 2019 & 2032
- Table 74: Rest of Middle East & Africa Electrochemical Phosphine Sensor Volume (K) Forecast, by Application 2019 & 2032
- Table 75: Global Electrochemical Phosphine Sensor Revenue million Forecast, by Application 2019 & 2032
- Table 76: Global Electrochemical Phosphine Sensor Volume K Forecast, by Application 2019 & 2032
- Table 77: Global Electrochemical Phosphine Sensor Revenue million Forecast, by Type 2019 & 2032
- Table 78: Global Electrochemical Phosphine Sensor Volume K Forecast, by Type 2019 & 2032
- Table 79: Global Electrochemical Phosphine Sensor Revenue million Forecast, by Country 2019 & 2032
- Table 80: Global Electrochemical Phosphine Sensor Volume K Forecast, by Country 2019 & 2032
- Table 81: China Electrochemical Phosphine Sensor Revenue (million) Forecast, by Application 2019 & 2032
- Table 82: China Electrochemical Phosphine Sensor Volume (K) Forecast, by Application 2019 & 2032
- Table 83: India Electrochemical Phosphine Sensor Revenue (million) Forecast, by Application 2019 & 2032
- Table 84: India Electrochemical Phosphine Sensor Volume (K) Forecast, by Application 2019 & 2032
- Table 85: Japan Electrochemical Phosphine Sensor Revenue (million) Forecast, by Application 2019 & 2032
- Table 86: Japan Electrochemical Phosphine Sensor Volume (K) Forecast, by Application 2019 & 2032
- Table 87: South Korea Electrochemical Phosphine Sensor Revenue (million) Forecast, by Application 2019 & 2032
- Table 88: South Korea Electrochemical Phosphine Sensor Volume (K) Forecast, by Application 2019 & 2032
- Table 89: ASEAN Electrochemical Phosphine Sensor Revenue (million) Forecast, by Application 2019 & 2032
- Table 90: ASEAN Electrochemical Phosphine Sensor Volume (K) Forecast, by Application 2019 & 2032
- Table 91: Oceania Electrochemical Phosphine Sensor Revenue (million) Forecast, by Application 2019 & 2032
- Table 92: Oceania Electrochemical Phosphine Sensor Volume (K) Forecast, by Application 2019 & 2032
- Table 93: Rest of Asia Pacific Electrochemical Phosphine Sensor Revenue (million) Forecast, by Application 2019 & 2032
- Table 94: Rest of Asia Pacific Electrochemical Phosphine Sensor Volume (K) Forecast, by Application 2019 & 2032
Frequently Asked Questions
1. What is the projected Compound Annual Growth Rate (CAGR) of the Electrochemical Phosphine Sensor?
The projected CAGR is approximately 5.1%.
2. Which companies are prominent players in the Electrochemical Phosphine Sensor?
Key companies in the market include EC Sense, Honeywell, Infinite Electronics, Interlink Electronics, Innodisk Corporation, Crowcon, RC Systems, Zhengzhou Winsen Electronics Technology, Guangzhou Luftmy Intelligent Technology, Shenzhen Singoan Electronic Technology, Skesen, Prsens, Advanced Sensors Application, Sangbay.
3. What are the main segments of the Electrochemical Phosphine Sensor?
The market segments include Application, Type.
4. Can you provide details about the market size?
The market size is estimated to be USD 364 million as of 2022.
5. What are some drivers contributing to market growth?
N/A
6. What are the notable trends driving market growth?
N/A
7. Are there any restraints impacting market growth?
N/A
8. Can you provide examples of recent developments in the market?
N/A
9. What pricing options are available for accessing the report?
Pricing options include single-user, multi-user, and enterprise licenses priced at USD 3950.00, USD 5925.00, and USD 7900.00 respectively.
10. Is the market size provided in terms of value or volume?
The market size is provided in terms of value, measured in million and volume, measured in K.
11. Are there any specific market keywords associated with the report?
Yes, the market keyword associated with the report is "Electrochemical Phosphine Sensor," which aids in identifying and referencing the specific market segment covered.
12. How do I determine which pricing option suits my needs best?
The pricing options vary based on user requirements and access needs. Individual users may opt for single-user licenses, while businesses requiring broader access may choose multi-user or enterprise licenses for cost-effective access to the report.
13. Are there any additional resources or data provided in the Electrochemical Phosphine Sensor report?
While the report offers comprehensive insights, it's advisable to review the specific contents or supplementary materials provided to ascertain if additional resources or data are available.
14. How can I stay updated on further developments or reports in the Electrochemical Phosphine Sensor?
To stay informed about further developments, trends, and reports in the Electrochemical Phosphine Sensor, consider subscribing to industry newsletters, following relevant companies and organizations, or regularly checking reputable industry news sources and publications.
Methodology
Step 1 - Identification of Relevant Samples Size from Population Database


Step 2 - Approaches for Defining Global Market Size (Value, Volume* & Price*)

Note*: In applicable scenarios
Step 3 - Data Sources
Primary Research
- Web Analytics
- Survey Reports
- Research Institute
- Latest Research Reports
- Opinion Leaders
Secondary Research
- Annual Reports
- White Paper
- Latest Press Release
- Industry Association
- Paid Database
- Investor Presentations

Step 4 - Data Triangulation
Involves using different sources of information in order to increase the validity of a study
These sources are likely to be stakeholders in a program - participants, other researchers, program staff, other community members, and so on.
Then we put all data in single framework & apply various statistical tools to find out the dynamic on the market.
During the analysis stage, feedback from the stakeholder groups would be compared to determine areas of agreement as well as areas of divergence


