
Key Insights
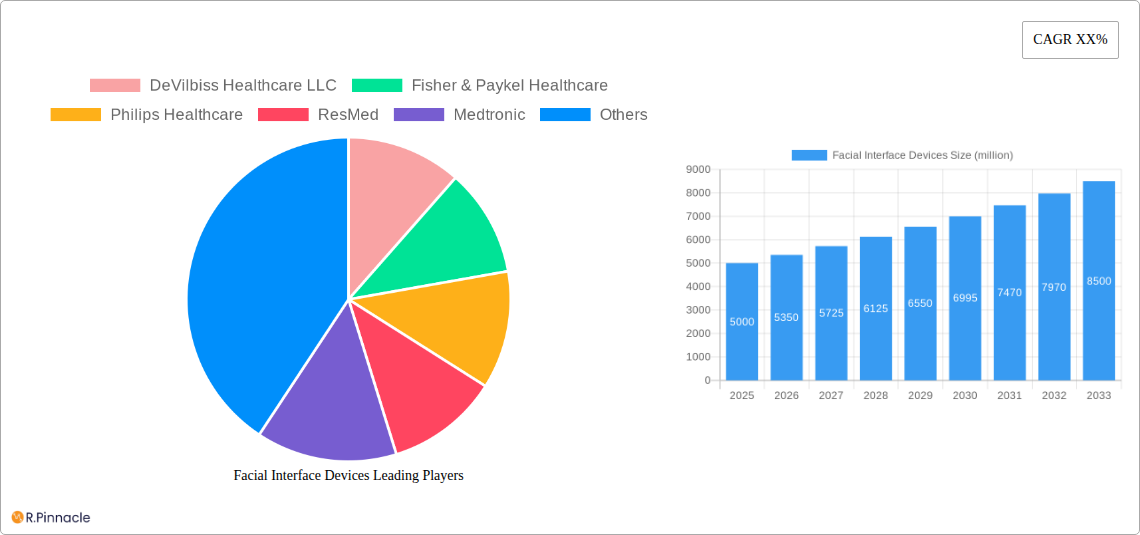
The global market for facial interface devices, encompassing nasal pillow masks, nasal masks, oral masks, and full-face masks, is experiencing robust growth, driven by the increasing prevalence of sleep apnea and other respiratory disorders. The market, estimated at $5 billion in 2025, is projected to expand at a Compound Annual Growth Rate (CAGR) of 7% from 2025 to 2033, reaching approximately $8.5 billion by 2033. This growth is fueled by several key factors. Technological advancements leading to more comfortable and effective devices, coupled with rising healthcare expenditure and improved access to diagnostic tools, are significant contributors. The aging global population, with its increased susceptibility to respiratory conditions, further boosts market demand. The segment dominated by hospitals and clinics is expected to maintain its leading position, owing to the specialized care provided in these settings. However, the home care segment is demonstrating rapid growth, driven by the preference for convenient and cost-effective at-home treatment options. Competition among major players such as ResMed, Philips Healthcare, and Fisher & Paykel Healthcare remains intense, stimulating innovation and driving down prices, making these devices more accessible to a wider patient population.
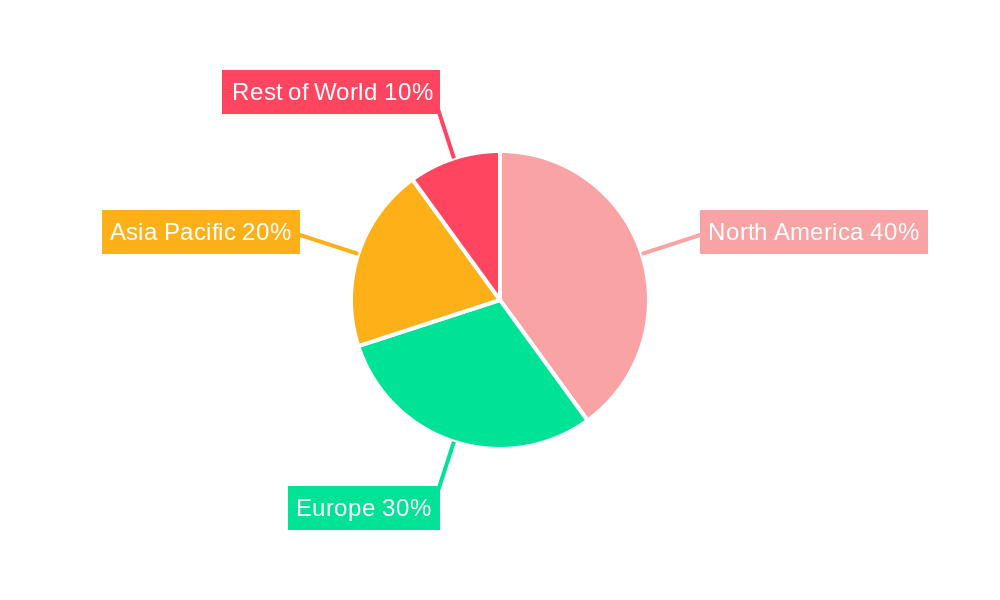
The market's growth, however, is not without its challenges. High initial costs associated with purchasing and maintaining these devices can be a barrier for certain patient groups. Furthermore, the market faces regulatory hurdles in various regions, influencing the pace of new product launches and adoption. The increasing demand for reusable and sustainable devices represents both a challenge and an opportunity, pushing manufacturers to develop eco-friendly and cost-effective alternatives. Geographic variations in healthcare infrastructure and insurance coverage also impact market penetration. North America currently holds the largest market share due to advanced healthcare infrastructure and high prevalence of sleep disorders, but the Asia-Pacific region is anticipated to experience significant growth in the coming years, driven by rising disposable incomes and increased awareness of respiratory health. This necessitates a strategic approach from manufacturers focusing on tailored solutions for diverse regional needs.
Facial Interface Devices Market Report: 2019-2033
This comprehensive report provides an in-depth analysis of the global Facial Interface Devices market, projecting a market value exceeding $XX million by 2033. The study covers the period from 2019 to 2033, with 2025 serving as the base and estimated year. This report is essential for industry professionals, investors, and strategists seeking actionable insights into this dynamic market.
Facial Interface Devices Market Structure & Innovation Trends
The global facial interface devices market exhibits a moderately consolidated structure, with key players like DeVilbiss Healthcare LLC, Fisher & Paykel Healthcare, Philips Healthcare, ResMed, and Medtronic holding significant market share. The combined market share of these top five companies is estimated at xx%, as of 2025. Innovation is driven primarily by advancements in materials science (lighter, more comfortable masks), integration of smart sensors for data monitoring (breath rate, leaks), and the development of reusable and sustainable products. Stringent regulatory frameworks, particularly concerning safety and efficacy, are shaping the market landscape. The market also experiences competitive pressures from substitute products, particularly in the home care segment. M&A activity in the sector has been moderate in recent years, with deal values totaling approximately $XX million between 2019 and 2024. End-user demographics indicate a growing elderly population driving demand for home care solutions.
- Market Share Concentration: Top 5 companies hold xx% market share in 2025.
- Innovation Drivers: Material science advancements, smart sensor integration, sustainable product design.
- Regulatory Landscape: Stringent safety and efficacy regulations impacting market entry.
- M&A Activity: Total deal value of approximately $XX million between 2019-2024.
Facial Interface Devices Market Dynamics & Trends
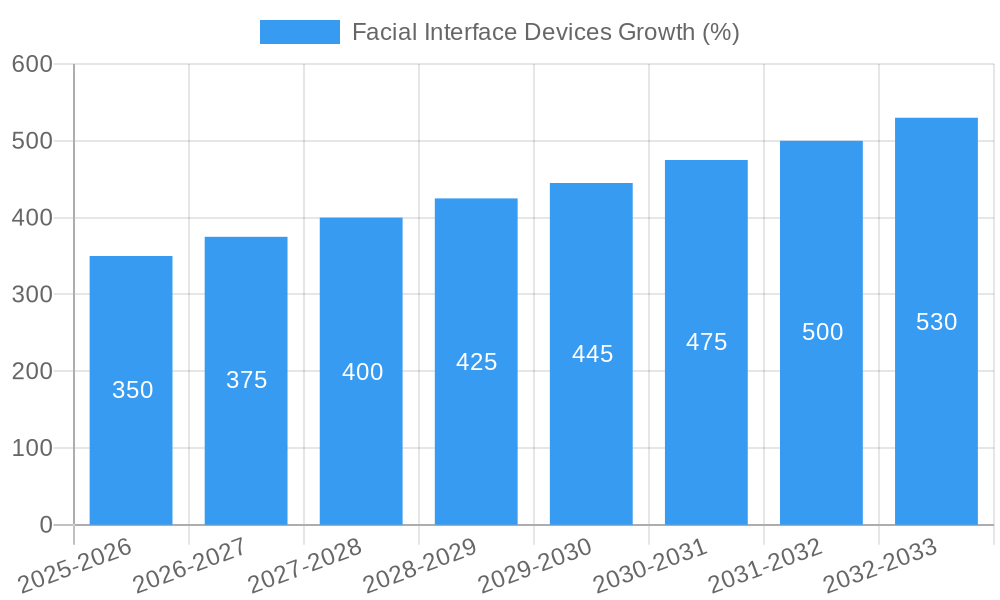
The facial interface devices market is experiencing robust growth, driven by factors such as the rising prevalence of respiratory illnesses, an aging global population increasing demand for home healthcare, and technological advancements leading to improved patient comfort and treatment efficacy. The market is anticipated to achieve a CAGR of xx% during the forecast period (2025-2033). Technological disruptions, such as the incorporation of advanced sensors and data analytics, are enhancing treatment effectiveness and personalization. Consumer preference for comfortable, user-friendly devices is impacting product development. The competitive landscape is characterized by both intense rivalry among established players and the emergence of new entrants offering innovative solutions. Market penetration remains relatively high in developed regions but presents substantial untapped potential in emerging markets.
Dominant Regions & Segments in Facial Interface Devices
The North American region currently dominates the facial interface devices market, driven by factors such as high healthcare expenditure, advanced healthcare infrastructure, and a relatively high prevalence of respiratory conditions. Hospitals remain the largest application segment, followed by home care. Nasal masks and full-face masks hold the leading positions in the type segment.
- Key Drivers in North America: High healthcare expenditure, advanced infrastructure, high prevalence of respiratory illnesses.
- Hospital Segment Dominance: Driven by higher treatment needs and insurance coverage.
- Nasal Mask & Full-Face Mask Dominance: Preferred for their comfort and effectiveness.
Europe and Asia-Pacific are expected to witness significant growth in the coming years driven by increasing awareness and adoption of advanced respiratory therapies and expansion of healthcare infrastructure.
Facial Interface Devices Product Innovations
Recent product innovations focus on enhancing comfort, reducing leaks, and improving ease of use. This includes the development of lightweight materials, advanced seal designs, and integrated humidification systems. Several companies are incorporating connected technology to monitor patient usage and provide remote patient monitoring capabilities. These innovations aim to address limitations of previous generations, offering competitive advantages through improved patient compliance and outcomes.
Report Scope & Segmentation Analysis
This report segments the facial interface devices market by application (Hospitals, Clinics, Home Care, Other) and type (Nasal Pillow Masks, Nasal Masks, Oral Masks, Full-Face Masks, Other). Each segment is analyzed based on historical data (2019-2024), market size in 2025, and projected growth from 2025-2033. Competitive dynamics, including market share and key players, are assessed for each segment. The market is showing a projected growth for all segments, with home care and nasal masks exhibiting the highest growth potential.
Key Drivers of Facial Interface Devices Growth
The growth of the facial interface devices market is primarily driven by a rising prevalence of chronic respiratory diseases like COPD and sleep apnea. Technological advancements in mask design, materials, and connected health solutions are also contributing factors. Favorable regulatory environments in some regions and increasing healthcare expenditure further stimulate market growth.
Challenges in the Facial Interface Devices Sector
The facial interface devices sector faces challenges such as stringent regulatory approvals, potential supply chain disruptions, and intense competition from established players. High production costs, especially for innovative materials and features, can affect pricing and accessibility. Furthermore, patient compliance remains an ongoing challenge.
Emerging Opportunities in Facial Interface Devices
Emerging opportunities include the expanding use of telehealth, the growing adoption of minimally invasive procedures, and the development of personalized medicine approaches tailored to individual patient needs. The increasing demand for home healthcare and the development of innovative materials with improved breathability and comfort are creating further opportunities for growth.
Leading Players in the Facial Interface Devices Market
- DeVilbiss Healthcare LLC
- Fisher & Paykel Healthcare
- Philips Healthcare
- ResMed
- Medtronic
- Drager
- Pahsco
- Smiths Medical
- Apex Medical
- Arigmed
- Penlon
- Hoffrichter GmbH
- Heyer Medical
- Bremed
- Hersill
- Armstrong Medical
- Curative Medical
- Apria Healthcare
Key Developments in Facial Interface Devices Industry
- 2022: ResMed launched a new full-face mask with improved comfort features.
- 2023: Medtronic acquired a smaller company specializing in smart sensor technology for respiratory devices.
- 2024: Fisher & Paykel Healthcare received FDA approval for a new nasal pillow mask. (Further developments to be added in the full report)
Future Outlook for Facial Interface Devices Market
The facial interface devices market is poised for continued growth, driven by technological innovation, the growing prevalence of respiratory diseases, and the increasing adoption of home healthcare. Strategic opportunities exist for companies focusing on developing innovative products, improving patient outcomes through data analytics, and expanding into emerging markets. The market's future success depends on addressing the challenges of improving affordability and accessibility alongside ongoing innovation.
Facial Interface Devices Segmentation
-
1. Application
- 1.1. Hospitals
- 1.2. Clinics
- 1.3. Home Care
- 1.4. Other
-
2. Types
- 2.1. Nasal Pillow Masks
- 2.2. Nasal Masks
- 2.3. Oral Masks
- 2.4. Full-Face Masks
- 2.5. Other
Facial Interface Devices Segmentation By Geography
-
1. North America
- 1.1. United States
- 1.2. Canada
- 1.3. Mexico
-
2. South America
- 2.1. Brazil
- 2.2. Argentina
- 2.3. Rest of South America
-
3. Europe
- 3.1. United Kingdom
- 3.2. Germany
- 3.3. France
- 3.4. Italy
- 3.5. Spain
- 3.6. Russia
- 3.7. Benelux
- 3.8. Nordics
- 3.9. Rest of Europe
-
4. Middle East & Africa
- 4.1. Turkey
- 4.2. Israel
- 4.3. GCC
- 4.4. North Africa
- 4.5. South Africa
- 4.6. Rest of Middle East & Africa
-
5. Asia Pacific
- 5.1. China
- 5.2. India
- 5.3. Japan
- 5.4. South Korea
- 5.5. ASEAN
- 5.6. Oceania
- 5.7. Rest of Asia Pacific
Facial Interface Devices REPORT HIGHLIGHTS
| Aspects | Details |
|---|---|
| Study Period | 2019-2033 |
| Base Year | 2024 |
| Estimated Year | 2025 |
| Forecast Period | 2025-2033 |
| Historical Period | 2019-2024 |
| Growth Rate | CAGR of XX% from 2019-2033 |
| Segmentation |
|
Table of Contents
- 1. Introduction
- 1.1. Research Scope
- 1.2. Market Segmentation
- 1.3. Research Methodology
- 1.4. Definitions and Assumptions
- 2. Executive Summary
- 2.1. Introduction
- 3. Market Dynamics
- 3.1. Introduction
- 3.2. Market Drivers
- 3.3. Market Restrains
- 3.4. Market Trends
- 4. Market Factor Analysis
- 4.1. Porters Five Forces
- 4.2. Supply/Value Chain
- 4.3. PESTEL analysis
- 4.4. Market Entropy
- 4.5. Patent/Trademark Analysis
- 5. Global Facial Interface Devices Analysis, Insights and Forecast, 2019-2031
- 5.1. Market Analysis, Insights and Forecast - by Application
- 5.1.1. Hospitals
- 5.1.2. Clinics
- 5.1.3. Home Care
- 5.1.4. Other
- 5.2. Market Analysis, Insights and Forecast - by Types
- 5.2.1. Nasal Pillow Masks
- 5.2.2. Nasal Masks
- 5.2.3. Oral Masks
- 5.2.4. Full-Face Masks
- 5.2.5. Other
- 5.3. Market Analysis, Insights and Forecast - by Region
- 5.3.1. North America
- 5.3.2. South America
- 5.3.3. Europe
- 5.3.4. Middle East & Africa
- 5.3.5. Asia Pacific
- 5.1. Market Analysis, Insights and Forecast - by Application
- 6. North America Facial Interface Devices Analysis, Insights and Forecast, 2019-2031
- 6.1. Market Analysis, Insights and Forecast - by Application
- 6.1.1. Hospitals
- 6.1.2. Clinics
- 6.1.3. Home Care
- 6.1.4. Other
- 6.2. Market Analysis, Insights and Forecast - by Types
- 6.2.1. Nasal Pillow Masks
- 6.2.2. Nasal Masks
- 6.2.3. Oral Masks
- 6.2.4. Full-Face Masks
- 6.2.5. Other
- 6.1. Market Analysis, Insights and Forecast - by Application
- 7. South America Facial Interface Devices Analysis, Insights and Forecast, 2019-2031
- 7.1. Market Analysis, Insights and Forecast - by Application
- 7.1.1. Hospitals
- 7.1.2. Clinics
- 7.1.3. Home Care
- 7.1.4. Other
- 7.2. Market Analysis, Insights and Forecast - by Types
- 7.2.1. Nasal Pillow Masks
- 7.2.2. Nasal Masks
- 7.2.3. Oral Masks
- 7.2.4. Full-Face Masks
- 7.2.5. Other
- 7.1. Market Analysis, Insights and Forecast - by Application
- 8. Europe Facial Interface Devices Analysis, Insights and Forecast, 2019-2031
- 8.1. Market Analysis, Insights and Forecast - by Application
- 8.1.1. Hospitals
- 8.1.2. Clinics
- 8.1.3. Home Care
- 8.1.4. Other
- 8.2. Market Analysis, Insights and Forecast - by Types
- 8.2.1. Nasal Pillow Masks
- 8.2.2. Nasal Masks
- 8.2.3. Oral Masks
- 8.2.4. Full-Face Masks
- 8.2.5. Other
- 8.1. Market Analysis, Insights and Forecast - by Application
- 9. Middle East & Africa Facial Interface Devices Analysis, Insights and Forecast, 2019-2031
- 9.1. Market Analysis, Insights and Forecast - by Application
- 9.1.1. Hospitals
- 9.1.2. Clinics
- 9.1.3. Home Care
- 9.1.4. Other
- 9.2. Market Analysis, Insights and Forecast - by Types
- 9.2.1. Nasal Pillow Masks
- 9.2.2. Nasal Masks
- 9.2.3. Oral Masks
- 9.2.4. Full-Face Masks
- 9.2.5. Other
- 9.1. Market Analysis, Insights and Forecast - by Application
- 10. Asia Pacific Facial Interface Devices Analysis, Insights and Forecast, 2019-2031
- 10.1. Market Analysis, Insights and Forecast - by Application
- 10.1.1. Hospitals
- 10.1.2. Clinics
- 10.1.3. Home Care
- 10.1.4. Other
- 10.2. Market Analysis, Insights and Forecast - by Types
- 10.2.1. Nasal Pillow Masks
- 10.2.2. Nasal Masks
- 10.2.3. Oral Masks
- 10.2.4. Full-Face Masks
- 10.2.5. Other
- 10.1. Market Analysis, Insights and Forecast - by Application
- 11. Competitive Analysis
- 11.1. Global Market Share Analysis 2024
- 11.2. Company Profiles
- 11.2.1 DeVilbiss Healthcare LLC
- 11.2.1.1. Overview
- 11.2.1.2. Products
- 11.2.1.3. SWOT Analysis
- 11.2.1.4. Recent Developments
- 11.2.1.5. Financials (Based on Availability)
- 11.2.2 Fisher & Paykel Healthcare
- 11.2.2.1. Overview
- 11.2.2.2. Products
- 11.2.2.3. SWOT Analysis
- 11.2.2.4. Recent Developments
- 11.2.2.5. Financials (Based on Availability)
- 11.2.3 Philips Healthcare
- 11.2.3.1. Overview
- 11.2.3.2. Products
- 11.2.3.3. SWOT Analysis
- 11.2.3.4. Recent Developments
- 11.2.3.5. Financials (Based on Availability)
- 11.2.4 ResMed
- 11.2.4.1. Overview
- 11.2.4.2. Products
- 11.2.4.3. SWOT Analysis
- 11.2.4.4. Recent Developments
- 11.2.4.5. Financials (Based on Availability)
- 11.2.5 Medtronic
- 11.2.5.1. Overview
- 11.2.5.2. Products
- 11.2.5.3. SWOT Analysis
- 11.2.5.4. Recent Developments
- 11.2.5.5. Financials (Based on Availability)
- 11.2.6 Drager
- 11.2.6.1. Overview
- 11.2.6.2. Products
- 11.2.6.3. SWOT Analysis
- 11.2.6.4. Recent Developments
- 11.2.6.5. Financials (Based on Availability)
- 11.2.7 Pahsco
- 11.2.7.1. Overview
- 11.2.7.2. Products
- 11.2.7.3. SWOT Analysis
- 11.2.7.4. Recent Developments
- 11.2.7.5. Financials (Based on Availability)
- 11.2.8 Smiths Medical
- 11.2.8.1. Overview
- 11.2.8.2. Products
- 11.2.8.3. SWOT Analysis
- 11.2.8.4. Recent Developments
- 11.2.8.5. Financials (Based on Availability)
- 11.2.9 Apex Medical
- 11.2.9.1. Overview
- 11.2.9.2. Products
- 11.2.9.3. SWOT Analysis
- 11.2.9.4. Recent Developments
- 11.2.9.5. Financials (Based on Availability)
- 11.2.10 Arigmed
- 11.2.10.1. Overview
- 11.2.10.2. Products
- 11.2.10.3. SWOT Analysis
- 11.2.10.4. Recent Developments
- 11.2.10.5. Financials (Based on Availability)
- 11.2.11 Penlon
- 11.2.11.1. Overview
- 11.2.11.2. Products
- 11.2.11.3. SWOT Analysis
- 11.2.11.4. Recent Developments
- 11.2.11.5. Financials (Based on Availability)
- 11.2.12 Hoffrichter GmbH
- 11.2.12.1. Overview
- 11.2.12.2. Products
- 11.2.12.3. SWOT Analysis
- 11.2.12.4. Recent Developments
- 11.2.12.5. Financials (Based on Availability)
- 11.2.13 Heyer Medical
- 11.2.13.1. Overview
- 11.2.13.2. Products
- 11.2.13.3. SWOT Analysis
- 11.2.13.4. Recent Developments
- 11.2.13.5. Financials (Based on Availability)
- 11.2.14 Bremed
- 11.2.14.1. Overview
- 11.2.14.2. Products
- 11.2.14.3. SWOT Analysis
- 11.2.14.4. Recent Developments
- 11.2.14.5. Financials (Based on Availability)
- 11.2.15 Hersill
- 11.2.15.1. Overview
- 11.2.15.2. Products
- 11.2.15.3. SWOT Analysis
- 11.2.15.4. Recent Developments
- 11.2.15.5. Financials (Based on Availability)
- 11.2.16 Armstrong Medical
- 11.2.16.1. Overview
- 11.2.16.2. Products
- 11.2.16.3. SWOT Analysis
- 11.2.16.4. Recent Developments
- 11.2.16.5. Financials (Based on Availability)
- 11.2.17 Curative Medical
- 11.2.17.1. Overview
- 11.2.17.2. Products
- 11.2.17.3. SWOT Analysis
- 11.2.17.4. Recent Developments
- 11.2.17.5. Financials (Based on Availability)
- 11.2.18 Apria Healthcare
- 11.2.18.1. Overview
- 11.2.18.2. Products
- 11.2.18.3. SWOT Analysis
- 11.2.18.4. Recent Developments
- 11.2.18.5. Financials (Based on Availability)
- 11.2.1 DeVilbiss Healthcare LLC
List of Figures
- Figure 1: Global Facial Interface Devices Revenue Breakdown (million, %) by Region 2024 & 2032
- Figure 2: Global Facial Interface Devices Volume Breakdown (K, %) by Region 2024 & 2032
- Figure 3: North America Facial Interface Devices Revenue (million), by Application 2024 & 2032
- Figure 4: North America Facial Interface Devices Volume (K), by Application 2024 & 2032
- Figure 5: North America Facial Interface Devices Revenue Share (%), by Application 2024 & 2032
- Figure 6: North America Facial Interface Devices Volume Share (%), by Application 2024 & 2032
- Figure 7: North America Facial Interface Devices Revenue (million), by Types 2024 & 2032
- Figure 8: North America Facial Interface Devices Volume (K), by Types 2024 & 2032
- Figure 9: North America Facial Interface Devices Revenue Share (%), by Types 2024 & 2032
- Figure 10: North America Facial Interface Devices Volume Share (%), by Types 2024 & 2032
- Figure 11: North America Facial Interface Devices Revenue (million), by Country 2024 & 2032
- Figure 12: North America Facial Interface Devices Volume (K), by Country 2024 & 2032
- Figure 13: North America Facial Interface Devices Revenue Share (%), by Country 2024 & 2032
- Figure 14: North America Facial Interface Devices Volume Share (%), by Country 2024 & 2032
- Figure 15: South America Facial Interface Devices Revenue (million), by Application 2024 & 2032
- Figure 16: South America Facial Interface Devices Volume (K), by Application 2024 & 2032
- Figure 17: South America Facial Interface Devices Revenue Share (%), by Application 2024 & 2032
- Figure 18: South America Facial Interface Devices Volume Share (%), by Application 2024 & 2032
- Figure 19: South America Facial Interface Devices Revenue (million), by Types 2024 & 2032
- Figure 20: South America Facial Interface Devices Volume (K), by Types 2024 & 2032
- Figure 21: South America Facial Interface Devices Revenue Share (%), by Types 2024 & 2032
- Figure 22: South America Facial Interface Devices Volume Share (%), by Types 2024 & 2032
- Figure 23: South America Facial Interface Devices Revenue (million), by Country 2024 & 2032
- Figure 24: South America Facial Interface Devices Volume (K), by Country 2024 & 2032
- Figure 25: South America Facial Interface Devices Revenue Share (%), by Country 2024 & 2032
- Figure 26: South America Facial Interface Devices Volume Share (%), by Country 2024 & 2032
- Figure 27: Europe Facial Interface Devices Revenue (million), by Application 2024 & 2032
- Figure 28: Europe Facial Interface Devices Volume (K), by Application 2024 & 2032
- Figure 29: Europe Facial Interface Devices Revenue Share (%), by Application 2024 & 2032
- Figure 30: Europe Facial Interface Devices Volume Share (%), by Application 2024 & 2032
- Figure 31: Europe Facial Interface Devices Revenue (million), by Types 2024 & 2032
- Figure 32: Europe Facial Interface Devices Volume (K), by Types 2024 & 2032
- Figure 33: Europe Facial Interface Devices Revenue Share (%), by Types 2024 & 2032
- Figure 34: Europe Facial Interface Devices Volume Share (%), by Types 2024 & 2032
- Figure 35: Europe Facial Interface Devices Revenue (million), by Country 2024 & 2032
- Figure 36: Europe Facial Interface Devices Volume (K), by Country 2024 & 2032
- Figure 37: Europe Facial Interface Devices Revenue Share (%), by Country 2024 & 2032
- Figure 38: Europe Facial Interface Devices Volume Share (%), by Country 2024 & 2032
- Figure 39: Middle East & Africa Facial Interface Devices Revenue (million), by Application 2024 & 2032
- Figure 40: Middle East & Africa Facial Interface Devices Volume (K), by Application 2024 & 2032
- Figure 41: Middle East & Africa Facial Interface Devices Revenue Share (%), by Application 2024 & 2032
- Figure 42: Middle East & Africa Facial Interface Devices Volume Share (%), by Application 2024 & 2032
- Figure 43: Middle East & Africa Facial Interface Devices Revenue (million), by Types 2024 & 2032
- Figure 44: Middle East & Africa Facial Interface Devices Volume (K), by Types 2024 & 2032
- Figure 45: Middle East & Africa Facial Interface Devices Revenue Share (%), by Types 2024 & 2032
- Figure 46: Middle East & Africa Facial Interface Devices Volume Share (%), by Types 2024 & 2032
- Figure 47: Middle East & Africa Facial Interface Devices Revenue (million), by Country 2024 & 2032
- Figure 48: Middle East & Africa Facial Interface Devices Volume (K), by Country 2024 & 2032
- Figure 49: Middle East & Africa Facial Interface Devices Revenue Share (%), by Country 2024 & 2032
- Figure 50: Middle East & Africa Facial Interface Devices Volume Share (%), by Country 2024 & 2032
- Figure 51: Asia Pacific Facial Interface Devices Revenue (million), by Application 2024 & 2032
- Figure 52: Asia Pacific Facial Interface Devices Volume (K), by Application 2024 & 2032
- Figure 53: Asia Pacific Facial Interface Devices Revenue Share (%), by Application 2024 & 2032
- Figure 54: Asia Pacific Facial Interface Devices Volume Share (%), by Application 2024 & 2032
- Figure 55: Asia Pacific Facial Interface Devices Revenue (million), by Types 2024 & 2032
- Figure 56: Asia Pacific Facial Interface Devices Volume (K), by Types 2024 & 2032
- Figure 57: Asia Pacific Facial Interface Devices Revenue Share (%), by Types 2024 & 2032
- Figure 58: Asia Pacific Facial Interface Devices Volume Share (%), by Types 2024 & 2032
- Figure 59: Asia Pacific Facial Interface Devices Revenue (million), by Country 2024 & 2032
- Figure 60: Asia Pacific Facial Interface Devices Volume (K), by Country 2024 & 2032
- Figure 61: Asia Pacific Facial Interface Devices Revenue Share (%), by Country 2024 & 2032
- Figure 62: Asia Pacific Facial Interface Devices Volume Share (%), by Country 2024 & 2032
List of Tables
- Table 1: Global Facial Interface Devices Revenue million Forecast, by Region 2019 & 2032
- Table 2: Global Facial Interface Devices Volume K Forecast, by Region 2019 & 2032
- Table 3: Global Facial Interface Devices Revenue million Forecast, by Application 2019 & 2032
- Table 4: Global Facial Interface Devices Volume K Forecast, by Application 2019 & 2032
- Table 5: Global Facial Interface Devices Revenue million Forecast, by Types 2019 & 2032
- Table 6: Global Facial Interface Devices Volume K Forecast, by Types 2019 & 2032
- Table 7: Global Facial Interface Devices Revenue million Forecast, by Region 2019 & 2032
- Table 8: Global Facial Interface Devices Volume K Forecast, by Region 2019 & 2032
- Table 9: Global Facial Interface Devices Revenue million Forecast, by Application 2019 & 2032
- Table 10: Global Facial Interface Devices Volume K Forecast, by Application 2019 & 2032
- Table 11: Global Facial Interface Devices Revenue million Forecast, by Types 2019 & 2032
- Table 12: Global Facial Interface Devices Volume K Forecast, by Types 2019 & 2032
- Table 13: Global Facial Interface Devices Revenue million Forecast, by Country 2019 & 2032
- Table 14: Global Facial Interface Devices Volume K Forecast, by Country 2019 & 2032
- Table 15: United States Facial Interface Devices Revenue (million) Forecast, by Application 2019 & 2032
- Table 16: United States Facial Interface Devices Volume (K) Forecast, by Application 2019 & 2032
- Table 17: Canada Facial Interface Devices Revenue (million) Forecast, by Application 2019 & 2032
- Table 18: Canada Facial Interface Devices Volume (K) Forecast, by Application 2019 & 2032
- Table 19: Mexico Facial Interface Devices Revenue (million) Forecast, by Application 2019 & 2032
- Table 20: Mexico Facial Interface Devices Volume (K) Forecast, by Application 2019 & 2032
- Table 21: Global Facial Interface Devices Revenue million Forecast, by Application 2019 & 2032
- Table 22: Global Facial Interface Devices Volume K Forecast, by Application 2019 & 2032
- Table 23: Global Facial Interface Devices Revenue million Forecast, by Types 2019 & 2032
- Table 24: Global Facial Interface Devices Volume K Forecast, by Types 2019 & 2032
- Table 25: Global Facial Interface Devices Revenue million Forecast, by Country 2019 & 2032
- Table 26: Global Facial Interface Devices Volume K Forecast, by Country 2019 & 2032
- Table 27: Brazil Facial Interface Devices Revenue (million) Forecast, by Application 2019 & 2032
- Table 28: Brazil Facial Interface Devices Volume (K) Forecast, by Application 2019 & 2032
- Table 29: Argentina Facial Interface Devices Revenue (million) Forecast, by Application 2019 & 2032
- Table 30: Argentina Facial Interface Devices Volume (K) Forecast, by Application 2019 & 2032
- Table 31: Rest of South America Facial Interface Devices Revenue (million) Forecast, by Application 2019 & 2032
- Table 32: Rest of South America Facial Interface Devices Volume (K) Forecast, by Application 2019 & 2032
- Table 33: Global Facial Interface Devices Revenue million Forecast, by Application 2019 & 2032
- Table 34: Global Facial Interface Devices Volume K Forecast, by Application 2019 & 2032
- Table 35: Global Facial Interface Devices Revenue million Forecast, by Types 2019 & 2032
- Table 36: Global Facial Interface Devices Volume K Forecast, by Types 2019 & 2032
- Table 37: Global Facial Interface Devices Revenue million Forecast, by Country 2019 & 2032
- Table 38: Global Facial Interface Devices Volume K Forecast, by Country 2019 & 2032
- Table 39: United Kingdom Facial Interface Devices Revenue (million) Forecast, by Application 2019 & 2032
- Table 40: United Kingdom Facial Interface Devices Volume (K) Forecast, by Application 2019 & 2032
- Table 41: Germany Facial Interface Devices Revenue (million) Forecast, by Application 2019 & 2032
- Table 42: Germany Facial Interface Devices Volume (K) Forecast, by Application 2019 & 2032
- Table 43: France Facial Interface Devices Revenue (million) Forecast, by Application 2019 & 2032
- Table 44: France Facial Interface Devices Volume (K) Forecast, by Application 2019 & 2032
- Table 45: Italy Facial Interface Devices Revenue (million) Forecast, by Application 2019 & 2032
- Table 46: Italy Facial Interface Devices Volume (K) Forecast, by Application 2019 & 2032
- Table 47: Spain Facial Interface Devices Revenue (million) Forecast, by Application 2019 & 2032
- Table 48: Spain Facial Interface Devices Volume (K) Forecast, by Application 2019 & 2032
- Table 49: Russia Facial Interface Devices Revenue (million) Forecast, by Application 2019 & 2032
- Table 50: Russia Facial Interface Devices Volume (K) Forecast, by Application 2019 & 2032
- Table 51: Benelux Facial Interface Devices Revenue (million) Forecast, by Application 2019 & 2032
- Table 52: Benelux Facial Interface Devices Volume (K) Forecast, by Application 2019 & 2032
- Table 53: Nordics Facial Interface Devices Revenue (million) Forecast, by Application 2019 & 2032
- Table 54: Nordics Facial Interface Devices Volume (K) Forecast, by Application 2019 & 2032
- Table 55: Rest of Europe Facial Interface Devices Revenue (million) Forecast, by Application 2019 & 2032
- Table 56: Rest of Europe Facial Interface Devices Volume (K) Forecast, by Application 2019 & 2032
- Table 57: Global Facial Interface Devices Revenue million Forecast, by Application 2019 & 2032
- Table 58: Global Facial Interface Devices Volume K Forecast, by Application 2019 & 2032
- Table 59: Global Facial Interface Devices Revenue million Forecast, by Types 2019 & 2032
- Table 60: Global Facial Interface Devices Volume K Forecast, by Types 2019 & 2032
- Table 61: Global Facial Interface Devices Revenue million Forecast, by Country 2019 & 2032
- Table 62: Global Facial Interface Devices Volume K Forecast, by Country 2019 & 2032
- Table 63: Turkey Facial Interface Devices Revenue (million) Forecast, by Application 2019 & 2032
- Table 64: Turkey Facial Interface Devices Volume (K) Forecast, by Application 2019 & 2032
- Table 65: Israel Facial Interface Devices Revenue (million) Forecast, by Application 2019 & 2032
- Table 66: Israel Facial Interface Devices Volume (K) Forecast, by Application 2019 & 2032
- Table 67: GCC Facial Interface Devices Revenue (million) Forecast, by Application 2019 & 2032
- Table 68: GCC Facial Interface Devices Volume (K) Forecast, by Application 2019 & 2032
- Table 69: North Africa Facial Interface Devices Revenue (million) Forecast, by Application 2019 & 2032
- Table 70: North Africa Facial Interface Devices Volume (K) Forecast, by Application 2019 & 2032
- Table 71: South Africa Facial Interface Devices Revenue (million) Forecast, by Application 2019 & 2032
- Table 72: South Africa Facial Interface Devices Volume (K) Forecast, by Application 2019 & 2032
- Table 73: Rest of Middle East & Africa Facial Interface Devices Revenue (million) Forecast, by Application 2019 & 2032
- Table 74: Rest of Middle East & Africa Facial Interface Devices Volume (K) Forecast, by Application 2019 & 2032
- Table 75: Global Facial Interface Devices Revenue million Forecast, by Application 2019 & 2032
- Table 76: Global Facial Interface Devices Volume K Forecast, by Application 2019 & 2032
- Table 77: Global Facial Interface Devices Revenue million Forecast, by Types 2019 & 2032
- Table 78: Global Facial Interface Devices Volume K Forecast, by Types 2019 & 2032
- Table 79: Global Facial Interface Devices Revenue million Forecast, by Country 2019 & 2032
- Table 80: Global Facial Interface Devices Volume K Forecast, by Country 2019 & 2032
- Table 81: China Facial Interface Devices Revenue (million) Forecast, by Application 2019 & 2032
- Table 82: China Facial Interface Devices Volume (K) Forecast, by Application 2019 & 2032
- Table 83: India Facial Interface Devices Revenue (million) Forecast, by Application 2019 & 2032
- Table 84: India Facial Interface Devices Volume (K) Forecast, by Application 2019 & 2032
- Table 85: Japan Facial Interface Devices Revenue (million) Forecast, by Application 2019 & 2032
- Table 86: Japan Facial Interface Devices Volume (K) Forecast, by Application 2019 & 2032
- Table 87: South Korea Facial Interface Devices Revenue (million) Forecast, by Application 2019 & 2032
- Table 88: South Korea Facial Interface Devices Volume (K) Forecast, by Application 2019 & 2032
- Table 89: ASEAN Facial Interface Devices Revenue (million) Forecast, by Application 2019 & 2032
- Table 90: ASEAN Facial Interface Devices Volume (K) Forecast, by Application 2019 & 2032
- Table 91: Oceania Facial Interface Devices Revenue (million) Forecast, by Application 2019 & 2032
- Table 92: Oceania Facial Interface Devices Volume (K) Forecast, by Application 2019 & 2032
- Table 93: Rest of Asia Pacific Facial Interface Devices Revenue (million) Forecast, by Application 2019 & 2032
- Table 94: Rest of Asia Pacific Facial Interface Devices Volume (K) Forecast, by Application 2019 & 2032
Frequently Asked Questions
1. What is the projected Compound Annual Growth Rate (CAGR) of the Facial Interface Devices?
The projected CAGR is approximately XX%.
2. Which companies are prominent players in the Facial Interface Devices?
Key companies in the market include DeVilbiss Healthcare LLC, Fisher & Paykel Healthcare, Philips Healthcare, ResMed, Medtronic, Drager, Pahsco, Smiths Medical, Apex Medical, Arigmed, Penlon, Hoffrichter GmbH, Heyer Medical, Bremed, Hersill, Armstrong Medical, Curative Medical, Apria Healthcare.
3. What are the main segments of the Facial Interface Devices?
The market segments include Application, Types.
4. Can you provide details about the market size?
The market size is estimated to be USD XXX million as of 2022.
5. What are some drivers contributing to market growth?
N/A
6. What are the notable trends driving market growth?
N/A
7. Are there any restraints impacting market growth?
N/A
8. Can you provide examples of recent developments in the market?
N/A
9. What pricing options are available for accessing the report?
Pricing options include single-user, multi-user, and enterprise licenses priced at USD 3350.00, USD 5025.00, and USD 6700.00 respectively.
10. Is the market size provided in terms of value or volume?
The market size is provided in terms of value, measured in million and volume, measured in K.
11. Are there any specific market keywords associated with the report?
Yes, the market keyword associated with the report is "Facial Interface Devices," which aids in identifying and referencing the specific market segment covered.
12. How do I determine which pricing option suits my needs best?
The pricing options vary based on user requirements and access needs. Individual users may opt for single-user licenses, while businesses requiring broader access may choose multi-user or enterprise licenses for cost-effective access to the report.
13. Are there any additional resources or data provided in the Facial Interface Devices report?
While the report offers comprehensive insights, it's advisable to review the specific contents or supplementary materials provided to ascertain if additional resources or data are available.
14. How can I stay updated on further developments or reports in the Facial Interface Devices?
To stay informed about further developments, trends, and reports in the Facial Interface Devices, consider subscribing to industry newsletters, following relevant companies and organizations, or regularly checking reputable industry news sources and publications.
Methodology
Step 1 - Identification of Relevant Samples Size from Population Database


Step 2 - Approaches for Defining Global Market Size (Value, Volume* & Price*)

Note*: In applicable scenarios
Step 3 - Data Sources
Primary Research
- Web Analytics
- Survey Reports
- Research Institute
- Latest Research Reports
- Opinion Leaders
Secondary Research
- Annual Reports
- White Paper
- Latest Press Release
- Industry Association
- Paid Database
- Investor Presentations

Step 4 - Data Triangulation
Involves using different sources of information in order to increase the validity of a study
These sources are likely to be stakeholders in a program - participants, other researchers, program staff, other community members, and so on.
Then we put all data in single framework & apply various statistical tools to find out the dynamic on the market.
During the analysis stage, feedback from the stakeholder groups would be compared to determine areas of agreement as well as areas of divergence


