

Key Insights
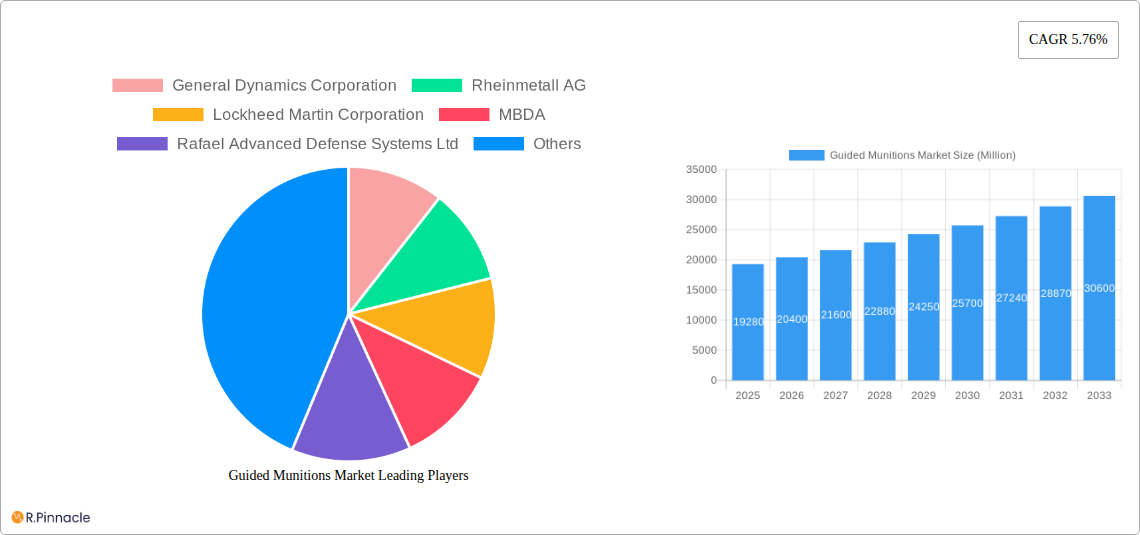
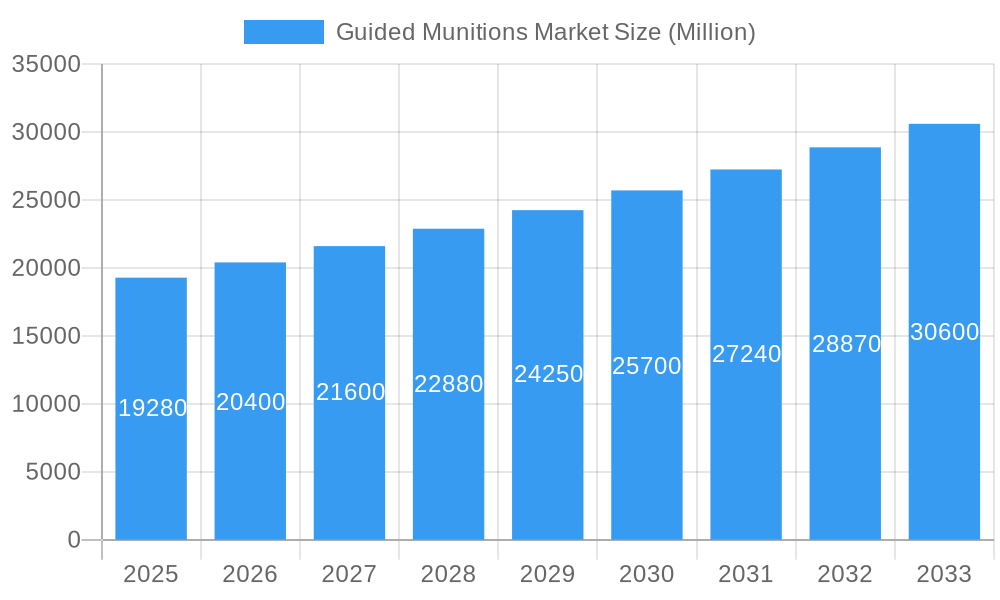
The global guided munitions market, valued at $19.28 billion in 2025, is projected to experience robust growth, driven by escalating geopolitical tensions, modernization of military arsenals, and the increasing demand for precision-guided weapons systems. The market's Compound Annual Growth Rate (CAGR) of 5.76% from 2025 to 2033 indicates a significant expansion, reaching an estimated value exceeding $30 billion by 2033. Key growth drivers include the rising adoption of advanced guidance technologies like satellite, radar, infrared, and laser guidance, enhancing accuracy and minimizing collateral damage. Furthermore, the increasing integration of guided munitions across various platforms—land, sea, and air—coupled with rising defense budgets worldwide, fuels market expansion. The segment breakdown reveals a significant share held by land-based platforms due to their wide-scale deployment in various conflict scenarios. Major players like General Dynamics, Lockheed Martin, and BAE Systems are leading the innovation and market share, constantly developing advanced guided munitions with enhanced capabilities. However, high research and development costs, stringent regulatory frameworks, and technological complexities associated with guided munitions pose challenges to market growth.
Guided Munitions Market Market Size (In Billion)
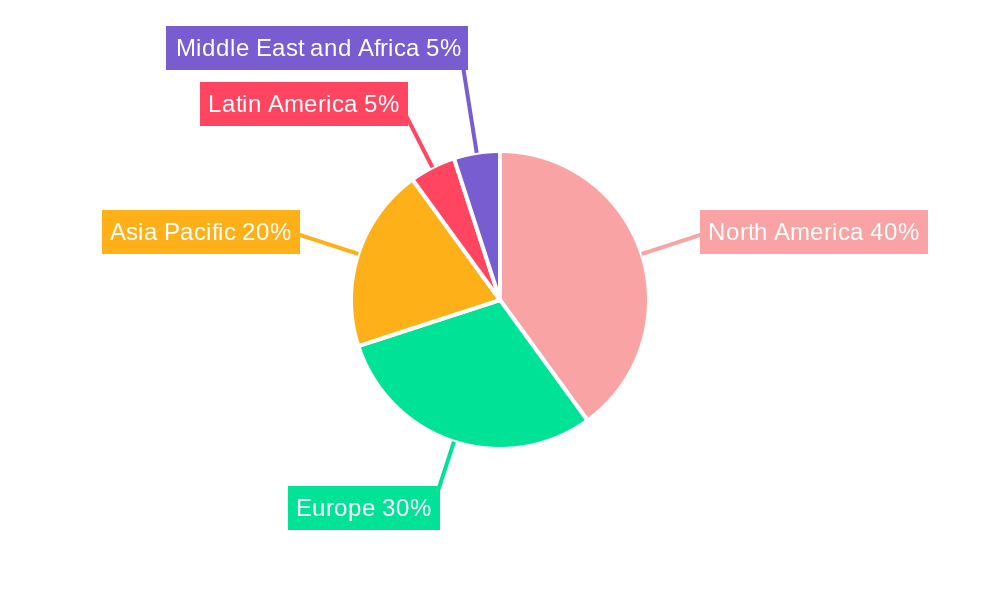
The geographical distribution reveals a strong presence in North America and Europe, primarily driven by significant defense spending and advanced technological capabilities. However, the Asia-Pacific region is also expected to witness considerable growth due to rising defense modernization efforts in countries like China and India. The segment encompassing missiles and ammunition holds a dominant market share, reflecting their extensive use across various military operations. Future growth will be influenced by technological advancements in autonomous targeting systems, AI-powered guidance systems, and the development of hypersonic guided munitions. The continued geopolitical instability and the focus on precision strikes will underpin the market's sustained expansion throughout the forecast period.
Guided Munitions Market Company Market Share
Guided Munitions Market: A Comprehensive Report (2019-2033)
This in-depth report provides a comprehensive analysis of the Guided Munitions Market, offering invaluable insights for industry professionals, investors, and strategic decision-makers. Covering the period from 2019 to 2033, with a focus on 2025, this report dissects market dynamics, competitive landscapes, and future growth potential. The report leverages extensive data analysis to provide actionable intelligence, enabling informed strategic planning and investment decisions.
Guided Munitions Market Market Structure & Innovation Trends
The Guided Munitions Market exhibits a moderately concentrated structure, with key players like General Dynamics Corporation, Rheinmetall AG, Lockheed Martin Corporation, MBDA, Rafael Advanced Defense Systems Ltd, IAI, RTX Corporation, Safra, BAE Systems plc, Northrop Grumman Corporation, and The Boeing Company holding significant market share. Market concentration is influenced by factors such as R&D investments, technological advancements, and government contracts. Innovation is driven by the need for enhanced precision, improved targeting capabilities, and the development of smart munitions. Regulatory frameworks, including export controls and international arms treaties, significantly impact market dynamics. Product substitutes, such as conventional munitions, are less effective and less precise, limiting their appeal in niche applications. The market experiences a moderate level of M&A activity, with deal values varying depending on the size and strategic fit of the acquired companies. For example, a recent significant transaction involved [Insert example M&A deal if available, including value in Millions]; the average M&A deal size in recent years has been approximately xx Million.
- Market Share: The top 5 players hold approximately xx% of the market share.
- M&A Deal Values (Recent Years): Average xx Million; Highest xx Million.
- Innovation Drivers: Enhanced precision, improved targeting, smart munitions development.
- Regulatory Impact: Export controls, international arms treaties.
Guided Munitions Market Market Dynamics & Trends
The Guided Munitions Market is experiencing robust growth, driven by increasing defense budgets globally, escalating geopolitical tensions, and technological advancements in guidance systems. The Compound Annual Growth Rate (CAGR) is projected to be xx% during the forecast period (2025-2033). Market penetration is high within the military segment, while the law enforcement segment shows promising growth potential. Technological disruptions, such as the integration of AI and machine learning in targeting systems, are transforming the market landscape. Consumer preferences are shifting towards more accurate, versatile, and adaptable guided munitions. Competitive dynamics are shaped by continuous innovation, strategic partnerships, and intense competition among leading players. The increasing adoption of network-centric warfare and the development of multi-effect warheads are significant growth drivers. The market is further propelled by the continuous demand for sophisticated weapons systems to address evolving threats and asymmetric warfare.
Dominant Regions & Segments in Guided Munitions Market
The North American region is currently the dominant market for guided munitions, driven by substantial defense spending and technological advancements. However, the Asia-Pacific region shows the highest growth potential, fueled by increasing military modernization efforts and rising geopolitical tensions.
Key Drivers by Region:
- North America: High defense budgets, technological leadership.
- Asia-Pacific: Military modernization, geopolitical tensions.
- Europe: Strong defense industry, regional conflicts.
Dominant Segments:
- By Platform: Air platforms dominate the market due to the widespread use of air-to-ground guided munitions.
- By End-User: The Military segment holds the largest share of the market, owing to the high demand from armed forces worldwide.
- By Product: Missiles represent the largest segment, followed by ammunition.
- By Technology: Infrared guidance systems hold a significant market share due to their effectiveness and reliability.
Guided Munitions Market Product Innovations
Recent product innovations focus on improving accuracy, range, and adaptability. Smart munitions, incorporating advanced guidance systems and multi-effect warheads, are gaining popularity. Miniaturization of guidance systems allows for integration into smaller munitions. The development of network-enabled weapons allows for coordinated attacks and improved battlefield situational awareness. These innovations are enhancing the effectiveness and precision of guided munitions, increasing their market appeal.
Report Scope & Segmentation Analysis
This report segments the Guided Munitions Market based on platform (Land, Sea, Air), end-user (Law Enforcement, Military), product (Missiles, Ammunition, Others), and technology (Satellite Guidance, Radar Guidance, Infrared Guidance, Laser Guidance). Each segment’s market size, growth projections, and competitive dynamics are analyzed in detail. The Air platform segment is expected to witness significant growth due to increasing demand for air-to-ground precision strikes. The Military segment is expected to remain the largest end-user segment. Missiles dominate the product segment, while infrared guidance technology is expected to maintain its dominance due to its reliability.
Key Drivers of Guided Munitions Market Growth
The Guided Munitions Market growth is primarily fueled by increasing global defense spending, modernization of armed forces, technological advancements in guidance systems (such as AI-powered targeting), and the rising demand for precision-guided munitions to minimize civilian casualties. Geopolitical instability and conflicts also contribute to the growth of this market.
Challenges in the Guided Munitions Market Sector
Challenges include stringent regulatory frameworks, supply chain disruptions impacting the availability of critical components, and intense competition among established players. The high cost of research and development also presents a hurdle for smaller companies. Furthermore, the ethical considerations related to the use of autonomous weapons systems pose a significant challenge for the industry.
Emerging Opportunities in Guided Munitions Market
Emerging opportunities lie in the development and deployment of autonomous guided munitions, the integration of AI and machine learning in targeting systems, and the expansion into new markets such as counter-drone and counter-UAS technologies. The increasing demand for unmanned aerial vehicles (UAVs) equipped with guided munitions creates additional growth opportunities.
Leading Players in the Guided Munitions Market Market
- General Dynamics Corporation
- Rheinmetall AG
- Lockheed Martin Corporation
- MBDA
- Rafael Advanced Defense Systems Ltd
- IAI
- RTX Corporation
- Safra
- BAE Systems plc
- Northrop Grumman Corporation
- The Boeing Company
Key Developments in Guided Munitions Market Industry
- March 2023: RTX Corporation secured a USD 320 Million contract for 1500 StormBreaker smart weapons.
- April 2023: Biofire announced the development of biometrically-integrated smart guns.
Future Outlook for Guided Munitions Market Market
The Guided Munitions Market is poised for continued growth, driven by ongoing technological advancements, increasing defense budgets, and evolving geopolitical landscape. Strategic partnerships and collaborations will play a crucial role in shaping the future of the market. The focus on precision-guided munitions, incorporating AI and other advanced technologies, will be key to securing a competitive advantage.
Guided Munitions Market Segmentation
-
1. Product
- 1.1. Missiles
- 1.2. Ammunition
- 1.3. Others
-
2. Technology
- 2.1. Satellite Guidance
- 2.2. Radar Guidance
- 2.3. Infrared Guidance
- 2.4. Laser Guidance
-
3. Platform
- 3.1. Land
- 3.2. Sea
- 3.3. Air
-
4. End-User
- 4.1. Law Enforcement
- 4.2. Military
Guided Munitions Market Segmentation By Geography
-
1. North America
- 1.1. United States
- 1.2. Canada
-
2. Europe
- 2.1. United Kingdom
- 2.2. Germany
- 2.3. France
- 2.4. Rest of Europe
-
3. Asia Pacific
- 3.1. China
- 3.2. India
- 3.3. Japan
- 3.4. Rest of Asia Pacific
-
4. Latin America
- 4.1. Brazil
- 4.2. Mexico
- 4.3. Rest of Latin America
-
5. Middle East and Africa
- 5.1. United Arab Emirates
- 5.2. Saudi Arabia
- 5.3. Qatar
- 5.4. Rest of Middle East and Africa
Guided Munitions Market Regional Market Share
Geographic Coverage of Guided Munitions Market
Guided Munitions Market REPORT HIGHLIGHTS
| Aspects | Details |
|---|---|
| Study Period | 2020-2034 |
| Base Year | 2025 |
| Estimated Year | 2026 |
| Forecast Period | 2026-2034 |
| Historical Period | 2020-2025 |
| Growth Rate | CAGR of 5.76% from 2020-2034 |
| Segmentation |
|
Table of Contents
- 1. Introduction
- 1.1. Research Scope
- 1.2. Market Segmentation
- 1.3. Research Objective
- 1.4. Definitions and Assumptions
- 2. Executive Summary
- 2.1. Market Snapshot
- 3. Market Dynamics
- 3.1. Market Drivers
- 3.2. Market Restrains
- 3.3. Market Trends
- 3.4. Market Opportunities
- 4. Market Factor Analysis
- 4.1. Porters Five Forces
- 4.1.1. Bargaining Power of Suppliers
- 4.1.2. Bargaining Power of Buyers
- 4.1.3. Threat of New Entrants
- 4.1.4. Threat of Substitutes
- 4.1.5. Competitive Rivalry
- 4.2. PESTEL analysis
- 4.3. BCG Analysis
- 4.3.1. Stars (High Growth, High Market Share)
- 4.3.2. Cash Cows (Low Growth, High Market Share)
- 4.3.3. Question Mark (High Growth, Low Market Share)
- 4.3.4. Dogs (Low Growth, Low Market Share)
- 4.4. Ansoff Matrix Analysis
- 4.5. Supply Chain Analysis
- 4.6. Regulatory Landscape
- 4.7. Current Market Potential and Opportunity Assessment (TAM–SAM–SOM Framework)
- 4.8. PRI Analyst Note
- 4.1. Porters Five Forces
- 5. Market Analysis, Insights and Forecast 2021-2033
- 5.1. Market Analysis, Insights and Forecast - by Product
- 5.1.1. Missiles
- 5.1.2. Ammunition
- 5.1.3. Others
- 5.2. Market Analysis, Insights and Forecast - by Technology
- 5.2.1. Satellite Guidance
- 5.2.2. Radar Guidance
- 5.2.3. Infrared Guidance
- 5.2.4. Laser Guidance
- 5.3. Market Analysis, Insights and Forecast - by Platform
- 5.3.1. Land
- 5.3.2. Sea
- 5.3.3. Air
- 5.4. Market Analysis, Insights and Forecast - by End-User
- 5.4.1. Law Enforcement
- 5.4.2. Military
- 5.5. Market Analysis, Insights and Forecast - by Region
- 5.5.1. North America
- 5.5.2. Europe
- 5.5.3. Asia Pacific
- 5.5.4. Latin America
- 5.5.5. Middle East and Africa
- 5.1. Market Analysis, Insights and Forecast - by Product
- 6. Global Guided Munitions Market Analysis, Insights and Forecast, 2021-2033
- 6.1. Market Analysis, Insights and Forecast - by Product
- 6.1.1. Missiles
- 6.1.2. Ammunition
- 6.1.3. Others
- 6.2. Market Analysis, Insights and Forecast - by Technology
- 6.2.1. Satellite Guidance
- 6.2.2. Radar Guidance
- 6.2.3. Infrared Guidance
- 6.2.4. Laser Guidance
- 6.3. Market Analysis, Insights and Forecast - by Platform
- 6.3.1. Land
- 6.3.2. Sea
- 6.3.3. Air
- 6.4. Market Analysis, Insights and Forecast - by End-User
- 6.4.1. Law Enforcement
- 6.4.2. Military
- 6.1. Market Analysis, Insights and Forecast - by Product
- 7. North America Guided Munitions Market Analysis, Insights and Forecast, 2020-2032
- 7.1. Market Analysis, Insights and Forecast - by Product
- 7.1.1. Missiles
- 7.1.2. Ammunition
- 7.1.3. Others
- 7.2. Market Analysis, Insights and Forecast - by Technology
- 7.2.1. Satellite Guidance
- 7.2.2. Radar Guidance
- 7.2.3. Infrared Guidance
- 7.2.4. Laser Guidance
- 7.3. Market Analysis, Insights and Forecast - by Platform
- 7.3.1. Land
- 7.3.2. Sea
- 7.3.3. Air
- 7.4. Market Analysis, Insights and Forecast - by End-User
- 7.4.1. Law Enforcement
- 7.4.2. Military
- 7.1. Market Analysis, Insights and Forecast - by Product
- 8. Europe Guided Munitions Market Analysis, Insights and Forecast, 2020-2032
- 8.1. Market Analysis, Insights and Forecast - by Product
- 8.1.1. Missiles
- 8.1.2. Ammunition
- 8.1.3. Others
- 8.2. Market Analysis, Insights and Forecast - by Technology
- 8.2.1. Satellite Guidance
- 8.2.2. Radar Guidance
- 8.2.3. Infrared Guidance
- 8.2.4. Laser Guidance
- 8.3. Market Analysis, Insights and Forecast - by Platform
- 8.3.1. Land
- 8.3.2. Sea
- 8.3.3. Air
- 8.4. Market Analysis, Insights and Forecast - by End-User
- 8.4.1. Law Enforcement
- 8.4.2. Military
- 8.1. Market Analysis, Insights and Forecast - by Product
- 9. Asia Pacific Guided Munitions Market Analysis, Insights and Forecast, 2020-2032
- 9.1. Market Analysis, Insights and Forecast - by Product
- 9.1.1. Missiles
- 9.1.2. Ammunition
- 9.1.3. Others
- 9.2. Market Analysis, Insights and Forecast - by Technology
- 9.2.1. Satellite Guidance
- 9.2.2. Radar Guidance
- 9.2.3. Infrared Guidance
- 9.2.4. Laser Guidance
- 9.3. Market Analysis, Insights and Forecast - by Platform
- 9.3.1. Land
- 9.3.2. Sea
- 9.3.3. Air
- 9.4. Market Analysis, Insights and Forecast - by End-User
- 9.4.1. Law Enforcement
- 9.4.2. Military
- 9.1. Market Analysis, Insights and Forecast - by Product
- 10. Latin America Guided Munitions Market Analysis, Insights and Forecast, 2020-2032
- 10.1. Market Analysis, Insights and Forecast - by Product
- 10.1.1. Missiles
- 10.1.2. Ammunition
- 10.1.3. Others
- 10.2. Market Analysis, Insights and Forecast - by Technology
- 10.2.1. Satellite Guidance
- 10.2.2. Radar Guidance
- 10.2.3. Infrared Guidance
- 10.2.4. Laser Guidance
- 10.3. Market Analysis, Insights and Forecast - by Platform
- 10.3.1. Land
- 10.3.2. Sea
- 10.3.3. Air
- 10.4. Market Analysis, Insights and Forecast - by End-User
- 10.4.1. Law Enforcement
- 10.4.2. Military
- 10.1. Market Analysis, Insights and Forecast - by Product
- 11. Middle East and Africa Guided Munitions Market Analysis, Insights and Forecast, 2020-2032
- 11.1. Market Analysis, Insights and Forecast - by Product
- 11.1.1. Missiles
- 11.1.2. Ammunition
- 11.1.3. Others
- 11.2. Market Analysis, Insights and Forecast - by Technology
- 11.2.1. Satellite Guidance
- 11.2.2. Radar Guidance
- 11.2.3. Infrared Guidance
- 11.2.4. Laser Guidance
- 11.3. Market Analysis, Insights and Forecast - by Platform
- 11.3.1. Land
- 11.3.2. Sea
- 11.3.3. Air
- 11.4. Market Analysis, Insights and Forecast - by End-User
- 11.4.1. Law Enforcement
- 11.4.2. Military
- 11.1. Market Analysis, Insights and Forecast - by Product
- 12. Competitive Analysis
- 12.1. Company Profiles
- 12.1.1 General Dynamics Corporation
- 12.1.1.1. Company Overview
- 12.1.1.2. Products
- 12.1.1.3. Company Financials
- 12.1.1.4. SWOT Analysis
- 12.1.2 Rheinmetall AG
- 12.1.2.1. Company Overview
- 12.1.2.2. Products
- 12.1.2.3. Company Financials
- 12.1.2.4. SWOT Analysis
- 12.1.3 Lockheed Martin Corporation
- 12.1.3.1. Company Overview
- 12.1.3.2. Products
- 12.1.3.3. Company Financials
- 12.1.3.4. SWOT Analysis
- 12.1.4 MBDA
- 12.1.4.1. Company Overview
- 12.1.4.2. Products
- 12.1.4.3. Company Financials
- 12.1.4.4. SWOT Analysis
- 12.1.5 Rafael Advanced Defense Systems Ltd
- 12.1.5.1. Company Overview
- 12.1.5.2. Products
- 12.1.5.3. Company Financials
- 12.1.5.4. SWOT Analysis
- 12.1.6 IAI
- 12.1.6.1. Company Overview
- 12.1.6.2. Products
- 12.1.6.3. Company Financials
- 12.1.6.4. SWOT Analysis
- 12.1.7 RTX Corporation
- 12.1.7.1. Company Overview
- 12.1.7.2. Products
- 12.1.7.3. Company Financials
- 12.1.7.4. SWOT Analysis
- 12.1.8 Safra
- 12.1.8.1. Company Overview
- 12.1.8.2. Products
- 12.1.8.3. Company Financials
- 12.1.8.4. SWOT Analysis
- 12.1.9 BAE Systems plc
- 12.1.9.1. Company Overview
- 12.1.9.2. Products
- 12.1.9.3. Company Financials
- 12.1.9.4. SWOT Analysis
- 12.1.10 Northrop Grumman Corporation
- 12.1.10.1. Company Overview
- 12.1.10.2. Products
- 12.1.10.3. Company Financials
- 12.1.10.4. SWOT Analysis
- 12.1.11 The Boeing Company
- 12.1.11.1. Company Overview
- 12.1.11.2. Products
- 12.1.11.3. Company Financials
- 12.1.11.4. SWOT Analysis
- 12.1.1 General Dynamics Corporation
- 12.2. Market Entropy
- 12.2.1 Company's Key Areas Served
- 12.2.2 Recent Developments
- 12.3. Company Market Share Analysis 2025
- 12.3.1 Top 5 Companies Market Share Analysis
- 12.3.2 Top 3 Companies Market Share Analysis
- 12.4. List of Potential Customers
- 13. Research Methodology
List of Figures
- Figure 1: Global Guided Munitions Market Revenue Breakdown (Million, %) by Region 2025 & 2033
- Figure 2: North America Guided Munitions Market Revenue (Million), by Product 2025 & 2033
- Figure 3: North America Guided Munitions Market Revenue Share (%), by Product 2025 & 2033
- Figure 4: North America Guided Munitions Market Revenue (Million), by Technology 2025 & 2033
- Figure 5: North America Guided Munitions Market Revenue Share (%), by Technology 2025 & 2033
- Figure 6: North America Guided Munitions Market Revenue (Million), by Platform 2025 & 2033
- Figure 7: North America Guided Munitions Market Revenue Share (%), by Platform 2025 & 2033
- Figure 8: North America Guided Munitions Market Revenue (Million), by End-User 2025 & 2033
- Figure 9: North America Guided Munitions Market Revenue Share (%), by End-User 2025 & 2033
- Figure 10: North America Guided Munitions Market Revenue (Million), by Country 2025 & 2033
- Figure 11: North America Guided Munitions Market Revenue Share (%), by Country 2025 & 2033
- Figure 12: Europe Guided Munitions Market Revenue (Million), by Product 2025 & 2033
- Figure 13: Europe Guided Munitions Market Revenue Share (%), by Product 2025 & 2033
- Figure 14: Europe Guided Munitions Market Revenue (Million), by Technology 2025 & 2033
- Figure 15: Europe Guided Munitions Market Revenue Share (%), by Technology 2025 & 2033
- Figure 16: Europe Guided Munitions Market Revenue (Million), by Platform 2025 & 2033
- Figure 17: Europe Guided Munitions Market Revenue Share (%), by Platform 2025 & 2033
- Figure 18: Europe Guided Munitions Market Revenue (Million), by End-User 2025 & 2033
- Figure 19: Europe Guided Munitions Market Revenue Share (%), by End-User 2025 & 2033
- Figure 20: Europe Guided Munitions Market Revenue (Million), by Country 2025 & 2033
- Figure 21: Europe Guided Munitions Market Revenue Share (%), by Country 2025 & 2033
- Figure 22: Asia Pacific Guided Munitions Market Revenue (Million), by Product 2025 & 2033
- Figure 23: Asia Pacific Guided Munitions Market Revenue Share (%), by Product 2025 & 2033
- Figure 24: Asia Pacific Guided Munitions Market Revenue (Million), by Technology 2025 & 2033
- Figure 25: Asia Pacific Guided Munitions Market Revenue Share (%), by Technology 2025 & 2033
- Figure 26: Asia Pacific Guided Munitions Market Revenue (Million), by Platform 2025 & 2033
- Figure 27: Asia Pacific Guided Munitions Market Revenue Share (%), by Platform 2025 & 2033
- Figure 28: Asia Pacific Guided Munitions Market Revenue (Million), by End-User 2025 & 2033
- Figure 29: Asia Pacific Guided Munitions Market Revenue Share (%), by End-User 2025 & 2033
- Figure 30: Asia Pacific Guided Munitions Market Revenue (Million), by Country 2025 & 2033
- Figure 31: Asia Pacific Guided Munitions Market Revenue Share (%), by Country 2025 & 2033
- Figure 32: Latin America Guided Munitions Market Revenue (Million), by Product 2025 & 2033
- Figure 33: Latin America Guided Munitions Market Revenue Share (%), by Product 2025 & 2033
- Figure 34: Latin America Guided Munitions Market Revenue (Million), by Technology 2025 & 2033
- Figure 35: Latin America Guided Munitions Market Revenue Share (%), by Technology 2025 & 2033
- Figure 36: Latin America Guided Munitions Market Revenue (Million), by Platform 2025 & 2033
- Figure 37: Latin America Guided Munitions Market Revenue Share (%), by Platform 2025 & 2033
- Figure 38: Latin America Guided Munitions Market Revenue (Million), by End-User 2025 & 2033
- Figure 39: Latin America Guided Munitions Market Revenue Share (%), by End-User 2025 & 2033
- Figure 40: Latin America Guided Munitions Market Revenue (Million), by Country 2025 & 2033
- Figure 41: Latin America Guided Munitions Market Revenue Share (%), by Country 2025 & 2033
- Figure 42: Middle East and Africa Guided Munitions Market Revenue (Million), by Product 2025 & 2033
- Figure 43: Middle East and Africa Guided Munitions Market Revenue Share (%), by Product 2025 & 2033
- Figure 44: Middle East and Africa Guided Munitions Market Revenue (Million), by Technology 2025 & 2033
- Figure 45: Middle East and Africa Guided Munitions Market Revenue Share (%), by Technology 2025 & 2033
- Figure 46: Middle East and Africa Guided Munitions Market Revenue (Million), by Platform 2025 & 2033
- Figure 47: Middle East and Africa Guided Munitions Market Revenue Share (%), by Platform 2025 & 2033
- Figure 48: Middle East and Africa Guided Munitions Market Revenue (Million), by End-User 2025 & 2033
- Figure 49: Middle East and Africa Guided Munitions Market Revenue Share (%), by End-User 2025 & 2033
- Figure 50: Middle East and Africa Guided Munitions Market Revenue (Million), by Country 2025 & 2033
- Figure 51: Middle East and Africa Guided Munitions Market Revenue Share (%), by Country 2025 & 2033
List of Tables
- Table 1: Global Guided Munitions Market Revenue Million Forecast, by Product 2020 & 2033
- Table 2: Global Guided Munitions Market Revenue Million Forecast, by Technology 2020 & 2033
- Table 3: Global Guided Munitions Market Revenue Million Forecast, by Platform 2020 & 2033
- Table 4: Global Guided Munitions Market Revenue Million Forecast, by End-User 2020 & 2033
- Table 5: Global Guided Munitions Market Revenue Million Forecast, by Region 2020 & 2033
- Table 6: Global Guided Munitions Market Revenue Million Forecast, by Product 2020 & 2033
- Table 7: Global Guided Munitions Market Revenue Million Forecast, by Technology 2020 & 2033
- Table 8: Global Guided Munitions Market Revenue Million Forecast, by Platform 2020 & 2033
- Table 9: Global Guided Munitions Market Revenue Million Forecast, by End-User 2020 & 2033
- Table 10: Global Guided Munitions Market Revenue Million Forecast, by Country 2020 & 2033
- Table 11: United States Guided Munitions Market Revenue (Million) Forecast, by Application 2020 & 2033
- Table 12: Canada Guided Munitions Market Revenue (Million) Forecast, by Application 2020 & 2033
- Table 13: Global Guided Munitions Market Revenue Million Forecast, by Product 2020 & 2033
- Table 14: Global Guided Munitions Market Revenue Million Forecast, by Technology 2020 & 2033
- Table 15: Global Guided Munitions Market Revenue Million Forecast, by Platform 2020 & 2033
- Table 16: Global Guided Munitions Market Revenue Million Forecast, by End-User 2020 & 2033
- Table 17: Global Guided Munitions Market Revenue Million Forecast, by Country 2020 & 2033
- Table 18: United Kingdom Guided Munitions Market Revenue (Million) Forecast, by Application 2020 & 2033
- Table 19: Germany Guided Munitions Market Revenue (Million) Forecast, by Application 2020 & 2033
- Table 20: France Guided Munitions Market Revenue (Million) Forecast, by Application 2020 & 2033
- Table 21: Rest of Europe Guided Munitions Market Revenue (Million) Forecast, by Application 2020 & 2033
- Table 22: Global Guided Munitions Market Revenue Million Forecast, by Product 2020 & 2033
- Table 23: Global Guided Munitions Market Revenue Million Forecast, by Technology 2020 & 2033
- Table 24: Global Guided Munitions Market Revenue Million Forecast, by Platform 2020 & 2033
- Table 25: Global Guided Munitions Market Revenue Million Forecast, by End-User 2020 & 2033
- Table 26: Global Guided Munitions Market Revenue Million Forecast, by Country 2020 & 2033
- Table 27: China Guided Munitions Market Revenue (Million) Forecast, by Application 2020 & 2033
- Table 28: India Guided Munitions Market Revenue (Million) Forecast, by Application 2020 & 2033
- Table 29: Japan Guided Munitions Market Revenue (Million) Forecast, by Application 2020 & 2033
- Table 30: Rest of Asia Pacific Guided Munitions Market Revenue (Million) Forecast, by Application 2020 & 2033
- Table 31: Global Guided Munitions Market Revenue Million Forecast, by Product 2020 & 2033
- Table 32: Global Guided Munitions Market Revenue Million Forecast, by Technology 2020 & 2033
- Table 33: Global Guided Munitions Market Revenue Million Forecast, by Platform 2020 & 2033
- Table 34: Global Guided Munitions Market Revenue Million Forecast, by End-User 2020 & 2033
- Table 35: Global Guided Munitions Market Revenue Million Forecast, by Country 2020 & 2033
- Table 36: Brazil Guided Munitions Market Revenue (Million) Forecast, by Application 2020 & 2033
- Table 37: Mexico Guided Munitions Market Revenue (Million) Forecast, by Application 2020 & 2033
- Table 38: Rest of Latin America Guided Munitions Market Revenue (Million) Forecast, by Application 2020 & 2033
- Table 39: Global Guided Munitions Market Revenue Million Forecast, by Product 2020 & 2033
- Table 40: Global Guided Munitions Market Revenue Million Forecast, by Technology 2020 & 2033
- Table 41: Global Guided Munitions Market Revenue Million Forecast, by Platform 2020 & 2033
- Table 42: Global Guided Munitions Market Revenue Million Forecast, by End-User 2020 & 2033
- Table 43: Global Guided Munitions Market Revenue Million Forecast, by Country 2020 & 2033
- Table 44: United Arab Emirates Guided Munitions Market Revenue (Million) Forecast, by Application 2020 & 2033
- Table 45: Saudi Arabia Guided Munitions Market Revenue (Million) Forecast, by Application 2020 & 2033
- Table 46: Qatar Guided Munitions Market Revenue (Million) Forecast, by Application 2020 & 2033
- Table 47: Rest of Middle East and Africa Guided Munitions Market Revenue (Million) Forecast, by Application 2020 & 2033
Frequently Asked Questions
1. What is the projected Compound Annual Growth Rate (CAGR) of the Guided Munitions Market?
The projected CAGR is approximately 5.76%.
2. Which companies are prominent players in the Guided Munitions Market?
Key companies in the market include General Dynamics Corporation, Rheinmetall AG, Lockheed Martin Corporation, MBDA, Rafael Advanced Defense Systems Ltd, IAI, RTX Corporation, Safra, BAE Systems plc, Northrop Grumman Corporation, The Boeing Company.
3. What are the main segments of the Guided Munitions Market?
The market segments include Product, Technology, Platform, End-User.
4. Can you provide details about the market size?
The market size is estimated to be USD 19.28 Million as of 2022.
5. What are some drivers contributing to market growth?
N/A
6. What are the notable trends driving market growth?
Law Enforcement Segment is Anticipated to Grow with the Highest CAGR During the Forecast Period.
7. Are there any restraints impacting market growth?
N/A
8. Can you provide examples of recent developments in the market?
April 2023: A US-based company, Biofire, announced the development of smart guns integrated with biometric identification, which would only allow authorized persons to fire. The significant feature that sets Biofire Smart Gun apart from others is its fingerprint and facial recognition system. The fingerprint sensor has been added to the grip, and the facial recognition sensor has been added to the rear of the weapon. Moreover, the Biofire smart gun will lock itself the moment its user leaves the gun in the hand.
9. What pricing options are available for accessing the report?
Pricing options include single-user, multi-user, and enterprise licenses priced at USD 4750, USD 5250, and USD 8750 respectively.
10. Is the market size provided in terms of value or volume?
The market size is provided in terms of value, measured in Million.
11. Are there any specific market keywords associated with the report?
Yes, the market keyword associated with the report is "Guided Munitions Market," which aids in identifying and referencing the specific market segment covered.
12. How do I determine which pricing option suits my needs best?
The pricing options vary based on user requirements and access needs. Individual users may opt for single-user licenses, while businesses requiring broader access may choose multi-user or enterprise licenses for cost-effective access to the report.
13. Are there any additional resources or data provided in the Guided Munitions Market report?
While the report offers comprehensive insights, it's advisable to review the specific contents or supplementary materials provided to ascertain if additional resources or data are available.
14. How can I stay updated on further developments or reports in the Guided Munitions Market?
To stay informed about further developments, trends, and reports in the Guided Munitions Market, consider subscribing to industry newsletters, following relevant companies and organizations, or regularly checking reputable industry news sources and publications.
Methodology
Step 1 - Identification of Relevant Samples Size from Population Database


Step 2 - Approaches for Defining Global Market Size (Value, Volume* & Price*)

Note*: In applicable scenarios
Step 3 - Data Sources
Primary Research
- Web Analytics
- Survey Reports
- Research Institute
- Latest Research Reports
- Opinion Leaders
Secondary Research
- Annual Reports
- White Paper
- Latest Press Release
- Industry Association
- Paid Database
- Investor Presentations

Step 4 - Data Triangulation
Involves using different sources of information in order to increase the validity of a study
These sources are likely to be stakeholders in a program - participants, other researchers, program staff, other community members, and so on.
Then we put all data in single framework & apply various statistical tools to find out the dynamic on the market.
During the analysis stage, feedback from the stakeholder groups would be compared to determine areas of agreement as well as areas of divergence