
Key Insights
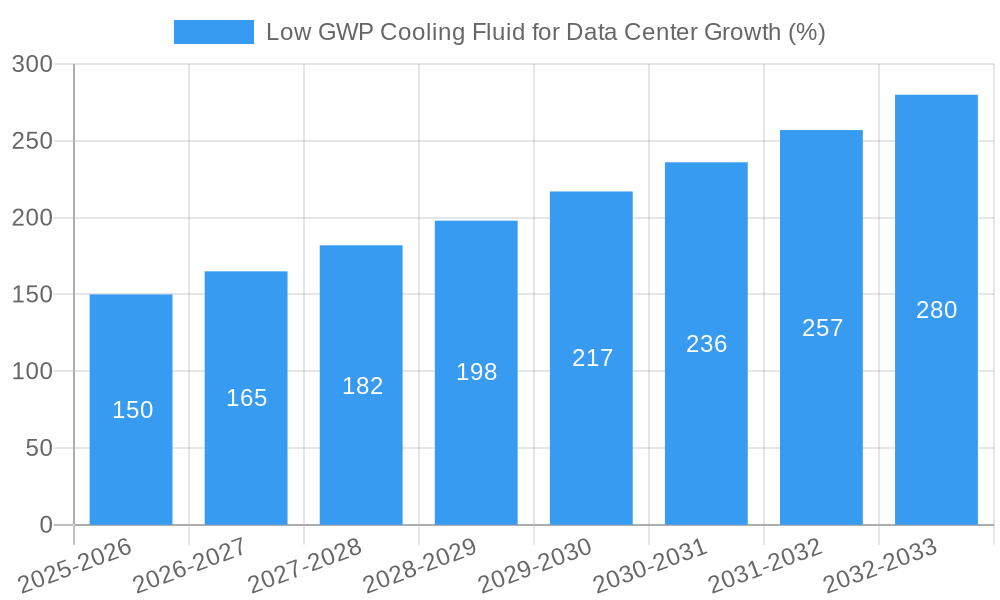
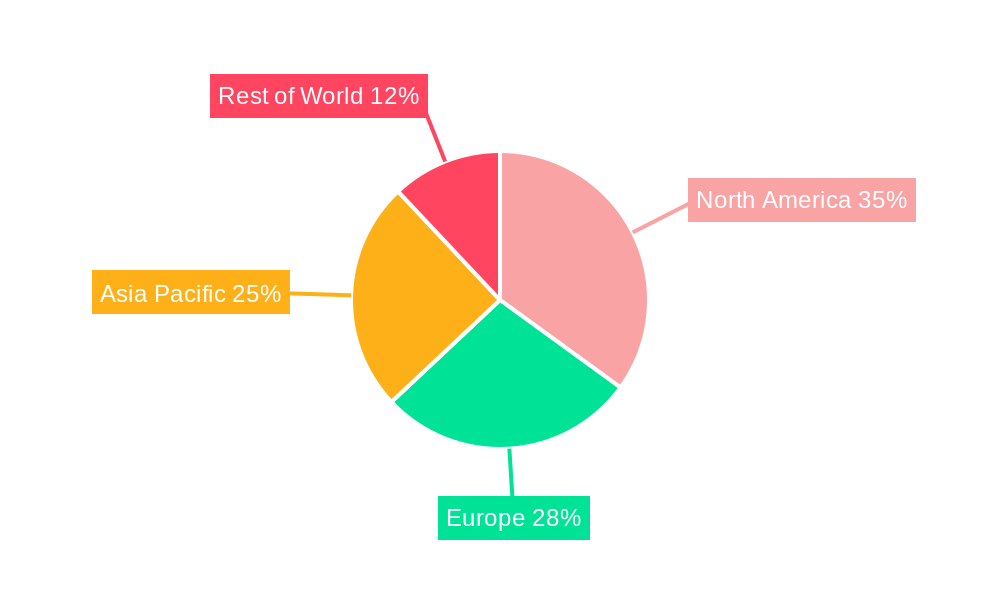
The market for low GWP cooling fluids in data centers is experiencing robust growth, driven by the increasing energy consumption and environmental concerns associated with traditional refrigerants. The rising demand for data center infrastructure, fueled by the proliferation of cloud computing, big data analytics, and artificial intelligence, is a primary catalyst. Furthermore, stringent government regulations aimed at reducing greenhouse gas emissions are pushing data center operators to adopt eco-friendly cooling solutions. This transition is particularly pronounced in regions with established data center hubs like North America and Europe, where adoption of sustainable practices is more advanced. While the initial investment in low GWP cooling systems might be higher, the long-term cost savings associated with reduced energy consumption and minimized environmental impact make them an attractive proposition. Segmentation analysis reveals strong demand across various applications, including artificial intelligence and supercomputing facilities, with higher GWP capacity fluids still holding a significant share due to legacy infrastructure. However, the market is steadily shifting towards lower GWP options as technology matures and costs decline. Leading chemical companies are actively involved in developing and supplying these advanced fluids, driving innovation and competition within the sector. The market is expected to maintain a healthy compound annual growth rate (CAGR) over the forecast period (2025-2033), with significant growth potential in emerging markets in Asia Pacific as data center infrastructure expands rapidly in these regions.
The restraints to market growth primarily involve the high initial capital expenditure required for upgrading existing cooling systems, coupled with potential challenges in the integration of new refrigerants with existing data center infrastructure. Furthermore, the availability and supply chain dynamics of some low-GWP refrigerants might present temporary bottlenecks. However, ongoing technological advancements are addressing these issues. The development of more efficient and cost-effective cooling systems, alongside supportive government policies and incentives, are mitigating these challenges and accelerating the market's growth trajectory. The ongoing trend towards greater energy efficiency and sustainability within the data center industry is expected to further propel the adoption of low-GWP cooling fluids in the coming years, making it a key area of focus for data center operators seeking to minimize their environmental footprint and operational costs.
Low GWP Cooling Fluid for Data Center Market Report: 2019-2033
Unlocking Growth in a Sustainable Data Center Landscape: A Comprehensive Market Analysis
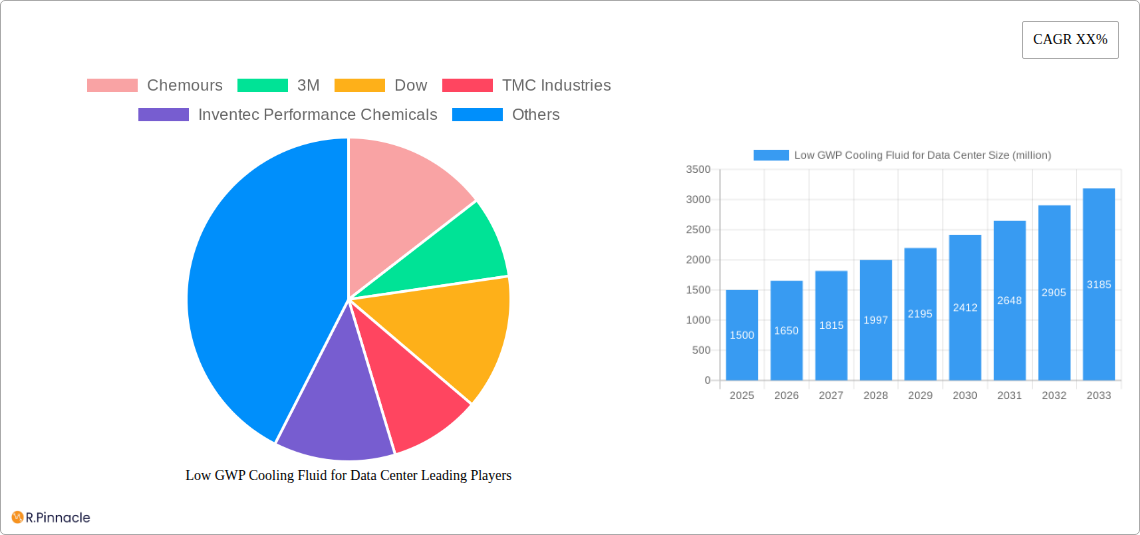
This comprehensive report provides an in-depth analysis of the Low GWP Cooling Fluid for Data Center market, offering invaluable insights for industry professionals, investors, and stakeholders. We project a market valued at $XX million in 2025, poised for significant growth during the forecast period (2025-2033). The study covers the historical period (2019-2024), with 2025 serving as the base year. Key players like Chemours, 3M, Dow, TMC Industries, and Inventec Performance Chemicals are analyzed for their market positioning and strategies. The report meticulously segments the market by application (Artificial Intelligence, Blockchain, Supercomputer, Others) and GWP levels (GWP≤20, 20<GWP≤50, 50<GWP≤100), providing granular insights into regional and segmental growth dynamics.
Low GWP Cooling Fluid for Data Center Market Structure & Innovation Trends
This section analyzes the market's competitive landscape, highlighting key players and their market shares. We delve into innovation drivers, regulatory influences, substitute products, end-user demographics, and merger & acquisition (M&A) activities within the industry. The report quantifies the market concentration and examines the impact of M&A deals valued at $XX million in the past five years on market dynamics. Innovation drivers are analyzed including government regulations favoring low-GWP refrigerants and increasing awareness of environmental concerns among data center operators. Product substitutions (e.g., shift from traditional refrigerants) and the demographic shift toward higher density data centers are also investigated.
- Market Concentration: The market exhibits a [moderately concentrated / highly fragmented / etc.] structure, with the top five players holding an estimated xx% market share in 2025.
- M&A Activity: XX major M&A deals were recorded between 2019 and 2024, totaling approximately $XX million. These deals significantly influenced market consolidation and technological advancements.
- Regulatory Landscape: Stringent environmental regulations across various regions are driving the adoption of Low GWP cooling fluids. Analysis of specific regulations (e.g., EU F-Gas Regulation) and their impacts is included.
Low GWP Cooling Fluid for Data Center Market Dynamics & Trends
This section explores the factors driving market growth, including technological advancements (e.g., the development of new low-GWP refrigerants with improved efficiency and safety), evolving consumer preferences toward environmentally friendly solutions, and competitive dynamics, such as pricing strategies and product differentiation. Key growth drivers are identified, and their individual contributions are assessed. The CAGR for the forecast period is projected at xx%, indicating robust market expansion. Market penetration of low-GWP fluids is analyzed across various data center segments, with a specific focus on the adoption rate in different regions. The impact of technological disruptions like the rise of AI and the increasing demand for high-performance computing on the market is detailed.
Dominant Regions & Segments in Low GWP Cooling Fluid for Data Center
This section identifies the leading regions and segments within the Low GWP Cooling Fluid market. Detailed analysis explores the factors contributing to dominance in each region and segment.
- Leading Region: [Name of Region] is projected to dominate the market owing to factors such as:
- Strong government support for green initiatives
- Rapid growth of the data center industry
- Well-developed infrastructure for cooling systems.
- Dominant Application Segment: The [Artificial Intelligence/Blockchain/Supercomputer/Others] segment is expected to lead the market due to [Specific reasons: high cooling demands, strategic investments, etc.].
- Leading GWP Type: The GWP≤20 segment is expected to hold the largest market share due to [Specific reasons: stricter environmental regulations, technological advancements, etc.].
Further analysis of each segment—including GWP≤20, 20<GWP≤50, and 50<GWP≤100—is provided, detailing growth projections and competitive dynamics within each.
Low GWP Cooling Fluid for Data Center Product Innovations
This section summarizes recent product developments and technological advancements in low-GWP cooling fluids for data centers. It highlights the competitive advantages of these innovations, such as improved energy efficiency, reduced environmental impact, and enhanced safety features. The focus is on how these innovations align with current market needs and trends, driving adoption among data center operators.
Report Scope & Segmentation Analysis
The report provides a detailed breakdown of the Low GWP Cooling Fluid market across various segments.
- By Application: Artificial Intelligence, Blockchain, Supercomputer, Others. Growth projections and competitive dynamics are provided for each segment.
- By GWP Level: GWP≤20, 20<GWP≤50, 50<GWP≤100. Each segment’s market size and growth trajectory are examined. Competitive landscapes are analyzed for each category.
The report offers comprehensive market size estimations for each segment, alongside analyses of their respective growth rates.
Key Drivers of Low GWP Cooling Fluid for Data Center Growth
Several factors drive market growth, including:
- Stringent environmental regulations: Policies aiming to reduce greenhouse gas emissions are accelerating the adoption of low-GWP refrigerants.
- Increasing energy efficiency demands: Data center operators are seeking more energy-efficient cooling solutions to reduce operational costs.
- Technological advancements: Continuous R&D efforts are resulting in improved low-GWP fluids with better performance characteristics.
Challenges in the Low GWP Cooling Fluid for Data Center Sector
The market faces challenges including:
- High initial investment costs: Switching to low-GWP fluids may require significant upfront investments in new equipment.
- Supply chain complexities: The availability and distribution of certain low-GWP fluids might be constrained.
- Competitive pressures: Existing players and new entrants compete fiercely, affecting pricing and market share.
Emerging Opportunities in Low GWP Cooling Fluid for Data Center
Emerging opportunities include:
- Growth in emerging economies: Data center infrastructure development in developing countries presents significant market expansion potential.
- Advancements in cooling technologies: Innovations in direct-to-chip cooling and other advanced techniques open new avenues for low-GWP fluids.
- Focus on sustainability: The growing emphasis on environmental sustainability creates a favorable market environment for low-GWP solutions.
Leading Players in the Low GWP Cooling Fluid for Data Center Market
- Chemours
- 3M
- Dow
- TMC Industries
- Inventec Performance Chemicals
Key Developments in Low GWP Cooling Fluid for Data Center Industry
- [Month, Year]: Chemours announces the launch of a new low-GWP refrigerant with enhanced efficiency.
- [Month, Year]: 3M acquires a smaller competitor, expanding its market presence.
- [Month, Year]: New EU regulations come into effect, further restricting the use of high-GWP refrigerants.
- (Add more bullet points as needed)
Future Outlook for Low GWP Cooling Fluid for Data Center Market
The market is projected to experience robust growth throughout the forecast period, driven by increasing data center deployments globally, stringent environmental regulations, and ongoing technological innovations in low-GWP cooling fluids. Strategic opportunities exist for companies focused on developing and deploying cutting-edge, sustainable cooling solutions. The market's future hinges on effective collaborations between technology providers, data center operators, and policymakers.
Low GWP Cooling Fluid for Data Center Segmentation
-
1. Application
- 1.1. Artificial Intelligence
- 1.2. Blockchain
- 1.3. Supercomputer
- 1.4. Others
-
2. Types
- 2.1. GWP≤20
- 2.2. 20<GWP≤50
- 2.3. 50<GWP≤100
Low GWP Cooling Fluid for Data Center Segmentation By Geography
-
1. North America
- 1.1. United States
- 1.2. Canada
- 1.3. Mexico
-
2. South America
- 2.1. Brazil
- 2.2. Argentina
- 2.3. Rest of South America
-
3. Europe
- 3.1. United Kingdom
- 3.2. Germany
- 3.3. France
- 3.4. Italy
- 3.5. Spain
- 3.6. Russia
- 3.7. Benelux
- 3.8. Nordics
- 3.9. Rest of Europe
-
4. Middle East & Africa
- 4.1. Turkey
- 4.2. Israel
- 4.3. GCC
- 4.4. North Africa
- 4.5. South Africa
- 4.6. Rest of Middle East & Africa
-
5. Asia Pacific
- 5.1. China
- 5.2. India
- 5.3. Japan
- 5.4. South Korea
- 5.5. ASEAN
- 5.6. Oceania
- 5.7. Rest of Asia Pacific
Low GWP Cooling Fluid for Data Center REPORT HIGHLIGHTS
| Aspects | Details |
|---|---|
| Study Period | 2019-2033 |
| Base Year | 2024 |
| Estimated Year | 2025 |
| Forecast Period | 2025-2033 |
| Historical Period | 2019-2024 |
| Growth Rate | CAGR of XX% from 2019-2033 |
| Segmentation |
|
Table of Contents
- 1. Introduction
- 1.1. Research Scope
- 1.2. Market Segmentation
- 1.3. Research Methodology
- 1.4. Definitions and Assumptions
- 2. Executive Summary
- 2.1. Introduction
- 3. Market Dynamics
- 3.1. Introduction
- 3.2. Market Drivers
- 3.3. Market Restrains
- 3.4. Market Trends
- 4. Market Factor Analysis
- 4.1. Porters Five Forces
- 4.2. Supply/Value Chain
- 4.3. PESTEL analysis
- 4.4. Market Entropy
- 4.5. Patent/Trademark Analysis
- 5. Global Low GWP Cooling Fluid for Data Center Analysis, Insights and Forecast, 2019-2031
- 5.1. Market Analysis, Insights and Forecast - by Application
- 5.1.1. Artificial Intelligence
- 5.1.2. Blockchain
- 5.1.3. Supercomputer
- 5.1.4. Others
- 5.2. Market Analysis, Insights and Forecast - by Types
- 5.2.1. GWP≤20
- 5.2.2. 20<GWP≤50
- 5.2.3. 50<GWP≤100
- 5.3. Market Analysis, Insights and Forecast - by Region
- 5.3.1. North America
- 5.3.2. South America
- 5.3.3. Europe
- 5.3.4. Middle East & Africa
- 5.3.5. Asia Pacific
- 5.1. Market Analysis, Insights and Forecast - by Application
- 6. North America Low GWP Cooling Fluid for Data Center Analysis, Insights and Forecast, 2019-2031
- 6.1. Market Analysis, Insights and Forecast - by Application
- 6.1.1. Artificial Intelligence
- 6.1.2. Blockchain
- 6.1.3. Supercomputer
- 6.1.4. Others
- 6.2. Market Analysis, Insights and Forecast - by Types
- 6.2.1. GWP≤20
- 6.2.2. 20<GWP≤50
- 6.2.3. 50<GWP≤100
- 6.1. Market Analysis, Insights and Forecast - by Application
- 7. South America Low GWP Cooling Fluid for Data Center Analysis, Insights and Forecast, 2019-2031
- 7.1. Market Analysis, Insights and Forecast - by Application
- 7.1.1. Artificial Intelligence
- 7.1.2. Blockchain
- 7.1.3. Supercomputer
- 7.1.4. Others
- 7.2. Market Analysis, Insights and Forecast - by Types
- 7.2.1. GWP≤20
- 7.2.2. 20<GWP≤50
- 7.2.3. 50<GWP≤100
- 7.1. Market Analysis, Insights and Forecast - by Application
- 8. Europe Low GWP Cooling Fluid for Data Center Analysis, Insights and Forecast, 2019-2031
- 8.1. Market Analysis, Insights and Forecast - by Application
- 8.1.1. Artificial Intelligence
- 8.1.2. Blockchain
- 8.1.3. Supercomputer
- 8.1.4. Others
- 8.2. Market Analysis, Insights and Forecast - by Types
- 8.2.1. GWP≤20
- 8.2.2. 20<GWP≤50
- 8.2.3. 50<GWP≤100
- 8.1. Market Analysis, Insights and Forecast - by Application
- 9. Middle East & Africa Low GWP Cooling Fluid for Data Center Analysis, Insights and Forecast, 2019-2031
- 9.1. Market Analysis, Insights and Forecast - by Application
- 9.1.1. Artificial Intelligence
- 9.1.2. Blockchain
- 9.1.3. Supercomputer
- 9.1.4. Others
- 9.2. Market Analysis, Insights and Forecast - by Types
- 9.2.1. GWP≤20
- 9.2.2. 20<GWP≤50
- 9.2.3. 50<GWP≤100
- 9.1. Market Analysis, Insights and Forecast - by Application
- 10. Asia Pacific Low GWP Cooling Fluid for Data Center Analysis, Insights and Forecast, 2019-2031
- 10.1. Market Analysis, Insights and Forecast - by Application
- 10.1.1. Artificial Intelligence
- 10.1.2. Blockchain
- 10.1.3. Supercomputer
- 10.1.4. Others
- 10.2. Market Analysis, Insights and Forecast - by Types
- 10.2.1. GWP≤20
- 10.2.2. 20<GWP≤50
- 10.2.3. 50<GWP≤100
- 10.1. Market Analysis, Insights and Forecast - by Application
- 11. Competitive Analysis
- 11.1. Global Market Share Analysis 2024
- 11.2. Company Profiles
- 11.2.1 Chemours
- 11.2.1.1. Overview
- 11.2.1.2. Products
- 11.2.1.3. SWOT Analysis
- 11.2.1.4. Recent Developments
- 11.2.1.5. Financials (Based on Availability)
- 11.2.2 3M
- 11.2.2.1. Overview
- 11.2.2.2. Products
- 11.2.2.3. SWOT Analysis
- 11.2.2.4. Recent Developments
- 11.2.2.5. Financials (Based on Availability)
- 11.2.3 Dow
- 11.2.3.1. Overview
- 11.2.3.2. Products
- 11.2.3.3. SWOT Analysis
- 11.2.3.4. Recent Developments
- 11.2.3.5. Financials (Based on Availability)
- 11.2.4 TMC Industries
- 11.2.4.1. Overview
- 11.2.4.2. Products
- 11.2.4.3. SWOT Analysis
- 11.2.4.4. Recent Developments
- 11.2.4.5. Financials (Based on Availability)
- 11.2.5 Inventec Performance Chemicals
- 11.2.5.1. Overview
- 11.2.5.2. Products
- 11.2.5.3. SWOT Analysis
- 11.2.5.4. Recent Developments
- 11.2.5.5. Financials (Based on Availability)
- 11.2.1 Chemours
List of Figures
- Figure 1: Global Low GWP Cooling Fluid for Data Center Revenue Breakdown (million, %) by Region 2024 & 2032
- Figure 2: Global Low GWP Cooling Fluid for Data Center Volume Breakdown (K, %) by Region 2024 & 2032
- Figure 3: North America Low GWP Cooling Fluid for Data Center Revenue (million), by Application 2024 & 2032
- Figure 4: North America Low GWP Cooling Fluid for Data Center Volume (K), by Application 2024 & 2032
- Figure 5: North America Low GWP Cooling Fluid for Data Center Revenue Share (%), by Application 2024 & 2032
- Figure 6: North America Low GWP Cooling Fluid for Data Center Volume Share (%), by Application 2024 & 2032
- Figure 7: North America Low GWP Cooling Fluid for Data Center Revenue (million), by Types 2024 & 2032
- Figure 8: North America Low GWP Cooling Fluid for Data Center Volume (K), by Types 2024 & 2032
- Figure 9: North America Low GWP Cooling Fluid for Data Center Revenue Share (%), by Types 2024 & 2032
- Figure 10: North America Low GWP Cooling Fluid for Data Center Volume Share (%), by Types 2024 & 2032
- Figure 11: North America Low GWP Cooling Fluid for Data Center Revenue (million), by Country 2024 & 2032
- Figure 12: North America Low GWP Cooling Fluid for Data Center Volume (K), by Country 2024 & 2032
- Figure 13: North America Low GWP Cooling Fluid for Data Center Revenue Share (%), by Country 2024 & 2032
- Figure 14: North America Low GWP Cooling Fluid for Data Center Volume Share (%), by Country 2024 & 2032
- Figure 15: South America Low GWP Cooling Fluid for Data Center Revenue (million), by Application 2024 & 2032
- Figure 16: South America Low GWP Cooling Fluid for Data Center Volume (K), by Application 2024 & 2032
- Figure 17: South America Low GWP Cooling Fluid for Data Center Revenue Share (%), by Application 2024 & 2032
- Figure 18: South America Low GWP Cooling Fluid for Data Center Volume Share (%), by Application 2024 & 2032
- Figure 19: South America Low GWP Cooling Fluid for Data Center Revenue (million), by Types 2024 & 2032
- Figure 20: South America Low GWP Cooling Fluid for Data Center Volume (K), by Types 2024 & 2032
- Figure 21: South America Low GWP Cooling Fluid for Data Center Revenue Share (%), by Types 2024 & 2032
- Figure 22: South America Low GWP Cooling Fluid for Data Center Volume Share (%), by Types 2024 & 2032
- Figure 23: South America Low GWP Cooling Fluid for Data Center Revenue (million), by Country 2024 & 2032
- Figure 24: South America Low GWP Cooling Fluid for Data Center Volume (K), by Country 2024 & 2032
- Figure 25: South America Low GWP Cooling Fluid for Data Center Revenue Share (%), by Country 2024 & 2032
- Figure 26: South America Low GWP Cooling Fluid for Data Center Volume Share (%), by Country 2024 & 2032
- Figure 27: Europe Low GWP Cooling Fluid for Data Center Revenue (million), by Application 2024 & 2032
- Figure 28: Europe Low GWP Cooling Fluid for Data Center Volume (K), by Application 2024 & 2032
- Figure 29: Europe Low GWP Cooling Fluid for Data Center Revenue Share (%), by Application 2024 & 2032
- Figure 30: Europe Low GWP Cooling Fluid for Data Center Volume Share (%), by Application 2024 & 2032
- Figure 31: Europe Low GWP Cooling Fluid for Data Center Revenue (million), by Types 2024 & 2032
- Figure 32: Europe Low GWP Cooling Fluid for Data Center Volume (K), by Types 2024 & 2032
- Figure 33: Europe Low GWP Cooling Fluid for Data Center Revenue Share (%), by Types 2024 & 2032
- Figure 34: Europe Low GWP Cooling Fluid for Data Center Volume Share (%), by Types 2024 & 2032
- Figure 35: Europe Low GWP Cooling Fluid for Data Center Revenue (million), by Country 2024 & 2032
- Figure 36: Europe Low GWP Cooling Fluid for Data Center Volume (K), by Country 2024 & 2032
- Figure 37: Europe Low GWP Cooling Fluid for Data Center Revenue Share (%), by Country 2024 & 2032
- Figure 38: Europe Low GWP Cooling Fluid for Data Center Volume Share (%), by Country 2024 & 2032
- Figure 39: Middle East & Africa Low GWP Cooling Fluid for Data Center Revenue (million), by Application 2024 & 2032
- Figure 40: Middle East & Africa Low GWP Cooling Fluid for Data Center Volume (K), by Application 2024 & 2032
- Figure 41: Middle East & Africa Low GWP Cooling Fluid for Data Center Revenue Share (%), by Application 2024 & 2032
- Figure 42: Middle East & Africa Low GWP Cooling Fluid for Data Center Volume Share (%), by Application 2024 & 2032
- Figure 43: Middle East & Africa Low GWP Cooling Fluid for Data Center Revenue (million), by Types 2024 & 2032
- Figure 44: Middle East & Africa Low GWP Cooling Fluid for Data Center Volume (K), by Types 2024 & 2032
- Figure 45: Middle East & Africa Low GWP Cooling Fluid for Data Center Revenue Share (%), by Types 2024 & 2032
- Figure 46: Middle East & Africa Low GWP Cooling Fluid for Data Center Volume Share (%), by Types 2024 & 2032
- Figure 47: Middle East & Africa Low GWP Cooling Fluid for Data Center Revenue (million), by Country 2024 & 2032
- Figure 48: Middle East & Africa Low GWP Cooling Fluid for Data Center Volume (K), by Country 2024 & 2032
- Figure 49: Middle East & Africa Low GWP Cooling Fluid for Data Center Revenue Share (%), by Country 2024 & 2032
- Figure 50: Middle East & Africa Low GWP Cooling Fluid for Data Center Volume Share (%), by Country 2024 & 2032
- Figure 51: Asia Pacific Low GWP Cooling Fluid for Data Center Revenue (million), by Application 2024 & 2032
- Figure 52: Asia Pacific Low GWP Cooling Fluid for Data Center Volume (K), by Application 2024 & 2032
- Figure 53: Asia Pacific Low GWP Cooling Fluid for Data Center Revenue Share (%), by Application 2024 & 2032
- Figure 54: Asia Pacific Low GWP Cooling Fluid for Data Center Volume Share (%), by Application 2024 & 2032
- Figure 55: Asia Pacific Low GWP Cooling Fluid for Data Center Revenue (million), by Types 2024 & 2032
- Figure 56: Asia Pacific Low GWP Cooling Fluid for Data Center Volume (K), by Types 2024 & 2032
- Figure 57: Asia Pacific Low GWP Cooling Fluid for Data Center Revenue Share (%), by Types 2024 & 2032
- Figure 58: Asia Pacific Low GWP Cooling Fluid for Data Center Volume Share (%), by Types 2024 & 2032
- Figure 59: Asia Pacific Low GWP Cooling Fluid for Data Center Revenue (million), by Country 2024 & 2032
- Figure 60: Asia Pacific Low GWP Cooling Fluid for Data Center Volume (K), by Country 2024 & 2032
- Figure 61: Asia Pacific Low GWP Cooling Fluid for Data Center Revenue Share (%), by Country 2024 & 2032
- Figure 62: Asia Pacific Low GWP Cooling Fluid for Data Center Volume Share (%), by Country 2024 & 2032
List of Tables
- Table 1: Global Low GWP Cooling Fluid for Data Center Revenue million Forecast, by Region 2019 & 2032
- Table 2: Global Low GWP Cooling Fluid for Data Center Volume K Forecast, by Region 2019 & 2032
- Table 3: Global Low GWP Cooling Fluid for Data Center Revenue million Forecast, by Application 2019 & 2032
- Table 4: Global Low GWP Cooling Fluid for Data Center Volume K Forecast, by Application 2019 & 2032
- Table 5: Global Low GWP Cooling Fluid for Data Center Revenue million Forecast, by Types 2019 & 2032
- Table 6: Global Low GWP Cooling Fluid for Data Center Volume K Forecast, by Types 2019 & 2032
- Table 7: Global Low GWP Cooling Fluid for Data Center Revenue million Forecast, by Region 2019 & 2032
- Table 8: Global Low GWP Cooling Fluid for Data Center Volume K Forecast, by Region 2019 & 2032
- Table 9: Global Low GWP Cooling Fluid for Data Center Revenue million Forecast, by Application 2019 & 2032
- Table 10: Global Low GWP Cooling Fluid for Data Center Volume K Forecast, by Application 2019 & 2032
- Table 11: Global Low GWP Cooling Fluid for Data Center Revenue million Forecast, by Types 2019 & 2032
- Table 12: Global Low GWP Cooling Fluid for Data Center Volume K Forecast, by Types 2019 & 2032
- Table 13: Global Low GWP Cooling Fluid for Data Center Revenue million Forecast, by Country 2019 & 2032
- Table 14: Global Low GWP Cooling Fluid for Data Center Volume K Forecast, by Country 2019 & 2032
- Table 15: United States Low GWP Cooling Fluid for Data Center Revenue (million) Forecast, by Application 2019 & 2032
- Table 16: United States Low GWP Cooling Fluid for Data Center Volume (K) Forecast, by Application 2019 & 2032
- Table 17: Canada Low GWP Cooling Fluid for Data Center Revenue (million) Forecast, by Application 2019 & 2032
- Table 18: Canada Low GWP Cooling Fluid for Data Center Volume (K) Forecast, by Application 2019 & 2032
- Table 19: Mexico Low GWP Cooling Fluid for Data Center Revenue (million) Forecast, by Application 2019 & 2032
- Table 20: Mexico Low GWP Cooling Fluid for Data Center Volume (K) Forecast, by Application 2019 & 2032
- Table 21: Global Low GWP Cooling Fluid for Data Center Revenue million Forecast, by Application 2019 & 2032
- Table 22: Global Low GWP Cooling Fluid for Data Center Volume K Forecast, by Application 2019 & 2032
- Table 23: Global Low GWP Cooling Fluid for Data Center Revenue million Forecast, by Types 2019 & 2032
- Table 24: Global Low GWP Cooling Fluid for Data Center Volume K Forecast, by Types 2019 & 2032
- Table 25: Global Low GWP Cooling Fluid for Data Center Revenue million Forecast, by Country 2019 & 2032
- Table 26: Global Low GWP Cooling Fluid for Data Center Volume K Forecast, by Country 2019 & 2032
- Table 27: Brazil Low GWP Cooling Fluid for Data Center Revenue (million) Forecast, by Application 2019 & 2032
- Table 28: Brazil Low GWP Cooling Fluid for Data Center Volume (K) Forecast, by Application 2019 & 2032
- Table 29: Argentina Low GWP Cooling Fluid for Data Center Revenue (million) Forecast, by Application 2019 & 2032
- Table 30: Argentina Low GWP Cooling Fluid for Data Center Volume (K) Forecast, by Application 2019 & 2032
- Table 31: Rest of South America Low GWP Cooling Fluid for Data Center Revenue (million) Forecast, by Application 2019 & 2032
- Table 32: Rest of South America Low GWP Cooling Fluid for Data Center Volume (K) Forecast, by Application 2019 & 2032
- Table 33: Global Low GWP Cooling Fluid for Data Center Revenue million Forecast, by Application 2019 & 2032
- Table 34: Global Low GWP Cooling Fluid for Data Center Volume K Forecast, by Application 2019 & 2032
- Table 35: Global Low GWP Cooling Fluid for Data Center Revenue million Forecast, by Types 2019 & 2032
- Table 36: Global Low GWP Cooling Fluid for Data Center Volume K Forecast, by Types 2019 & 2032
- Table 37: Global Low GWP Cooling Fluid for Data Center Revenue million Forecast, by Country 2019 & 2032
- Table 38: Global Low GWP Cooling Fluid for Data Center Volume K Forecast, by Country 2019 & 2032
- Table 39: United Kingdom Low GWP Cooling Fluid for Data Center Revenue (million) Forecast, by Application 2019 & 2032
- Table 40: United Kingdom Low GWP Cooling Fluid for Data Center Volume (K) Forecast, by Application 2019 & 2032
- Table 41: Germany Low GWP Cooling Fluid for Data Center Revenue (million) Forecast, by Application 2019 & 2032
- Table 42: Germany Low GWP Cooling Fluid for Data Center Volume (K) Forecast, by Application 2019 & 2032
- Table 43: France Low GWP Cooling Fluid for Data Center Revenue (million) Forecast, by Application 2019 & 2032
- Table 44: France Low GWP Cooling Fluid for Data Center Volume (K) Forecast, by Application 2019 & 2032
- Table 45: Italy Low GWP Cooling Fluid for Data Center Revenue (million) Forecast, by Application 2019 & 2032
- Table 46: Italy Low GWP Cooling Fluid for Data Center Volume (K) Forecast, by Application 2019 & 2032
- Table 47: Spain Low GWP Cooling Fluid for Data Center Revenue (million) Forecast, by Application 2019 & 2032
- Table 48: Spain Low GWP Cooling Fluid for Data Center Volume (K) Forecast, by Application 2019 & 2032
- Table 49: Russia Low GWP Cooling Fluid for Data Center Revenue (million) Forecast, by Application 2019 & 2032
- Table 50: Russia Low GWP Cooling Fluid for Data Center Volume (K) Forecast, by Application 2019 & 2032
- Table 51: Benelux Low GWP Cooling Fluid for Data Center Revenue (million) Forecast, by Application 2019 & 2032
- Table 52: Benelux Low GWP Cooling Fluid for Data Center Volume (K) Forecast, by Application 2019 & 2032
- Table 53: Nordics Low GWP Cooling Fluid for Data Center Revenue (million) Forecast, by Application 2019 & 2032
- Table 54: Nordics Low GWP Cooling Fluid for Data Center Volume (K) Forecast, by Application 2019 & 2032
- Table 55: Rest of Europe Low GWP Cooling Fluid for Data Center Revenue (million) Forecast, by Application 2019 & 2032
- Table 56: Rest of Europe Low GWP Cooling Fluid for Data Center Volume (K) Forecast, by Application 2019 & 2032
- Table 57: Global Low GWP Cooling Fluid for Data Center Revenue million Forecast, by Application 2019 & 2032
- Table 58: Global Low GWP Cooling Fluid for Data Center Volume K Forecast, by Application 2019 & 2032
- Table 59: Global Low GWP Cooling Fluid for Data Center Revenue million Forecast, by Types 2019 & 2032
- Table 60: Global Low GWP Cooling Fluid for Data Center Volume K Forecast, by Types 2019 & 2032
- Table 61: Global Low GWP Cooling Fluid for Data Center Revenue million Forecast, by Country 2019 & 2032
- Table 62: Global Low GWP Cooling Fluid for Data Center Volume K Forecast, by Country 2019 & 2032
- Table 63: Turkey Low GWP Cooling Fluid for Data Center Revenue (million) Forecast, by Application 2019 & 2032
- Table 64: Turkey Low GWP Cooling Fluid for Data Center Volume (K) Forecast, by Application 2019 & 2032
- Table 65: Israel Low GWP Cooling Fluid for Data Center Revenue (million) Forecast, by Application 2019 & 2032
- Table 66: Israel Low GWP Cooling Fluid for Data Center Volume (K) Forecast, by Application 2019 & 2032
- Table 67: GCC Low GWP Cooling Fluid for Data Center Revenue (million) Forecast, by Application 2019 & 2032
- Table 68: GCC Low GWP Cooling Fluid for Data Center Volume (K) Forecast, by Application 2019 & 2032
- Table 69: North Africa Low GWP Cooling Fluid for Data Center Revenue (million) Forecast, by Application 2019 & 2032
- Table 70: North Africa Low GWP Cooling Fluid for Data Center Volume (K) Forecast, by Application 2019 & 2032
- Table 71: South Africa Low GWP Cooling Fluid for Data Center Revenue (million) Forecast, by Application 2019 & 2032
- Table 72: South Africa Low GWP Cooling Fluid for Data Center Volume (K) Forecast, by Application 2019 & 2032
- Table 73: Rest of Middle East & Africa Low GWP Cooling Fluid for Data Center Revenue (million) Forecast, by Application 2019 & 2032
- Table 74: Rest of Middle East & Africa Low GWP Cooling Fluid for Data Center Volume (K) Forecast, by Application 2019 & 2032
- Table 75: Global Low GWP Cooling Fluid for Data Center Revenue million Forecast, by Application 2019 & 2032
- Table 76: Global Low GWP Cooling Fluid for Data Center Volume K Forecast, by Application 2019 & 2032
- Table 77: Global Low GWP Cooling Fluid for Data Center Revenue million Forecast, by Types 2019 & 2032
- Table 78: Global Low GWP Cooling Fluid for Data Center Volume K Forecast, by Types 2019 & 2032
- Table 79: Global Low GWP Cooling Fluid for Data Center Revenue million Forecast, by Country 2019 & 2032
- Table 80: Global Low GWP Cooling Fluid for Data Center Volume K Forecast, by Country 2019 & 2032
- Table 81: China Low GWP Cooling Fluid for Data Center Revenue (million) Forecast, by Application 2019 & 2032
- Table 82: China Low GWP Cooling Fluid for Data Center Volume (K) Forecast, by Application 2019 & 2032
- Table 83: India Low GWP Cooling Fluid for Data Center Revenue (million) Forecast, by Application 2019 & 2032
- Table 84: India Low GWP Cooling Fluid for Data Center Volume (K) Forecast, by Application 2019 & 2032
- Table 85: Japan Low GWP Cooling Fluid for Data Center Revenue (million) Forecast, by Application 2019 & 2032
- Table 86: Japan Low GWP Cooling Fluid for Data Center Volume (K) Forecast, by Application 2019 & 2032
- Table 87: South Korea Low GWP Cooling Fluid for Data Center Revenue (million) Forecast, by Application 2019 & 2032
- Table 88: South Korea Low GWP Cooling Fluid for Data Center Volume (K) Forecast, by Application 2019 & 2032
- Table 89: ASEAN Low GWP Cooling Fluid for Data Center Revenue (million) Forecast, by Application 2019 & 2032
- Table 90: ASEAN Low GWP Cooling Fluid for Data Center Volume (K) Forecast, by Application 2019 & 2032
- Table 91: Oceania Low GWP Cooling Fluid for Data Center Revenue (million) Forecast, by Application 2019 & 2032
- Table 92: Oceania Low GWP Cooling Fluid for Data Center Volume (K) Forecast, by Application 2019 & 2032
- Table 93: Rest of Asia Pacific Low GWP Cooling Fluid for Data Center Revenue (million) Forecast, by Application 2019 & 2032
- Table 94: Rest of Asia Pacific Low GWP Cooling Fluid for Data Center Volume (K) Forecast, by Application 2019 & 2032
Frequently Asked Questions
1. What is the projected Compound Annual Growth Rate (CAGR) of the Low GWP Cooling Fluid for Data Center?
The projected CAGR is approximately XX%.
2. Which companies are prominent players in the Low GWP Cooling Fluid for Data Center?
Key companies in the market include Chemours, 3M, Dow, TMC Industries, Inventec Performance Chemicals.
3. What are the main segments of the Low GWP Cooling Fluid for Data Center?
The market segments include Application, Types.
4. Can you provide details about the market size?
The market size is estimated to be USD XXX million as of 2022.
5. What are some drivers contributing to market growth?
N/A
6. What are the notable trends driving market growth?
N/A
7. Are there any restraints impacting market growth?
N/A
8. Can you provide examples of recent developments in the market?
N/A
9. What pricing options are available for accessing the report?
Pricing options include single-user, multi-user, and enterprise licenses priced at USD 4350.00, USD 6525.00, and USD 8700.00 respectively.
10. Is the market size provided in terms of value or volume?
The market size is provided in terms of value, measured in million and volume, measured in K.
11. Are there any specific market keywords associated with the report?
Yes, the market keyword associated with the report is "Low GWP Cooling Fluid for Data Center," which aids in identifying and referencing the specific market segment covered.
12. How do I determine which pricing option suits my needs best?
The pricing options vary based on user requirements and access needs. Individual users may opt for single-user licenses, while businesses requiring broader access may choose multi-user or enterprise licenses for cost-effective access to the report.
13. Are there any additional resources or data provided in the Low GWP Cooling Fluid for Data Center report?
While the report offers comprehensive insights, it's advisable to review the specific contents or supplementary materials provided to ascertain if additional resources or data are available.
14. How can I stay updated on further developments or reports in the Low GWP Cooling Fluid for Data Center?
To stay informed about further developments, trends, and reports in the Low GWP Cooling Fluid for Data Center, consider subscribing to industry newsletters, following relevant companies and organizations, or regularly checking reputable industry news sources and publications.
Methodology
Step 1 - Identification of Relevant Samples Size from Population Database


Step 2 - Approaches for Defining Global Market Size (Value, Volume* & Price*)

Note*: In applicable scenarios
Step 3 - Data Sources
Primary Research
- Web Analytics
- Survey Reports
- Research Institute
- Latest Research Reports
- Opinion Leaders
Secondary Research
- Annual Reports
- White Paper
- Latest Press Release
- Industry Association
- Paid Database
- Investor Presentations

Step 4 - Data Triangulation
Involves using different sources of information in order to increase the validity of a study
These sources are likely to be stakeholders in a program - participants, other researchers, program staff, other community members, and so on.
Then we put all data in single framework & apply various statistical tools to find out the dynamic on the market.
During the analysis stage, feedback from the stakeholder groups would be compared to determine areas of agreement as well as areas of divergence


