
Key Insights
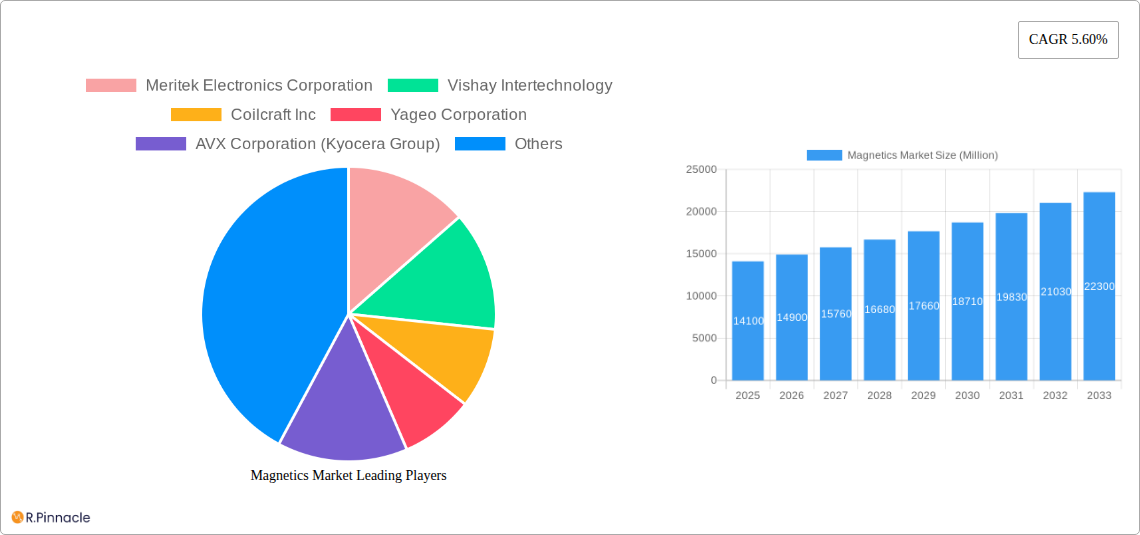
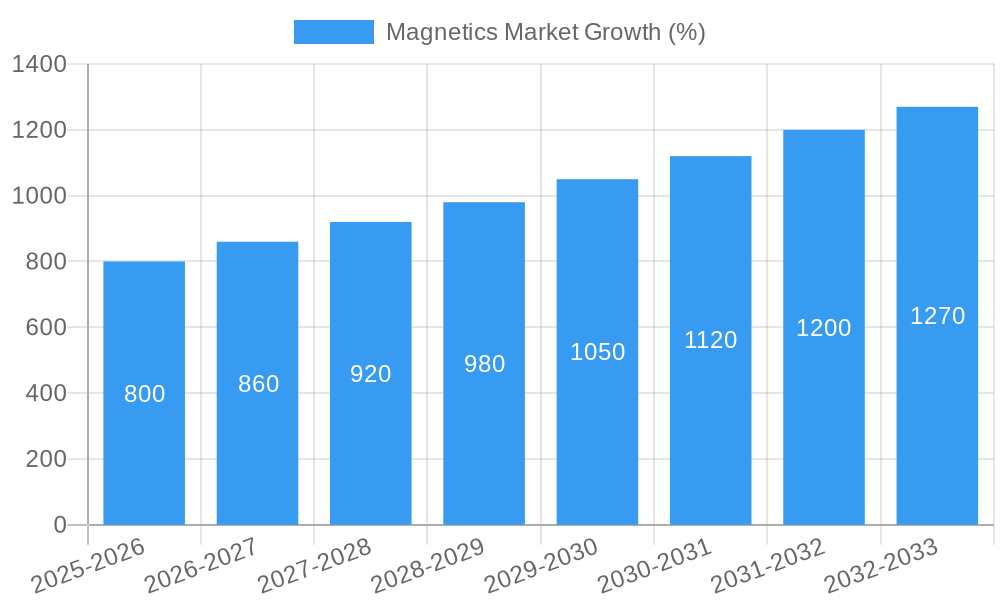
The global magnetics market, valued at $14.10 billion in 2025, is projected to experience robust growth, exhibiting a compound annual growth rate (CAGR) of 5.60% from 2025 to 2033. This expansion is driven primarily by the surging demand for magnetics in several key sectors. The burgeoning electric vehicle (EV) and hybrid electric vehicle (HEV) industry is a significant contributor, requiring sophisticated magnetics for motor control and power management. Renewable energy sources, particularly photovoltaics and wind power, also rely heavily on magnetics for efficient energy conversion and grid integration. Furthermore, the expanding industrial automation sector, encompassing applications such as motors and uninterruptible power supplies (UPS), fuels consistent demand. Growth is also spurred by advancements in consumer electronics, demanding miniaturization and improved performance in magnetics components. While potential supply chain constraints and material cost fluctuations could pose challenges, the overall market outlook remains positive, indicating significant growth opportunities for manufacturers and investors alike.
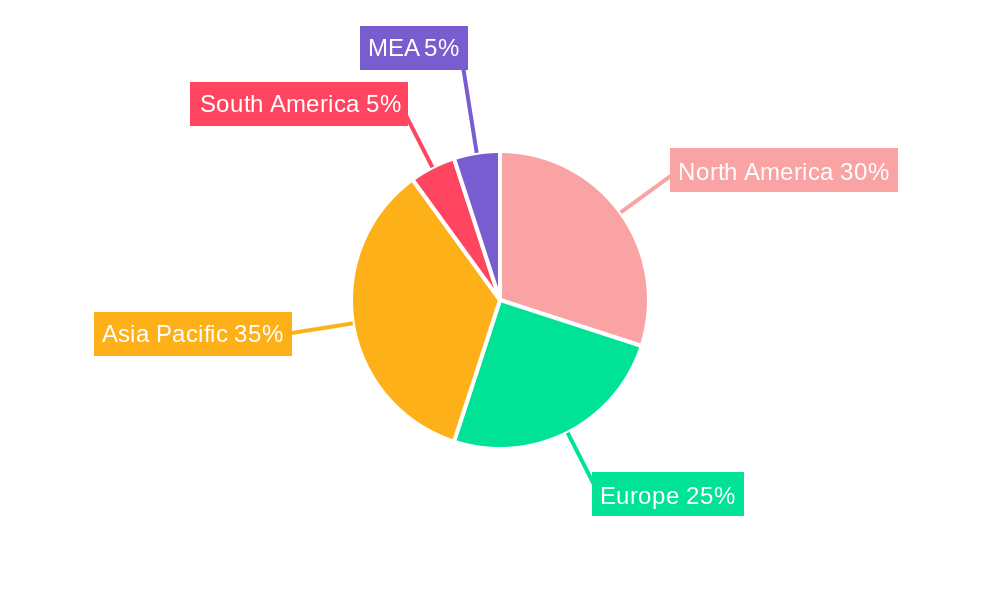
The market segmentation reveals a diverse landscape. Wire wound inductors, multi-layer inductors, and thin-film inductors represent major product types, catering to varying application needs. Ferrite cores and EMC components, along with EMI filters, RF/Power transformers, and current sense transformers, constitute essential components within diverse electronic systems. Geographically, North America and Europe currently hold significant market shares, owing to established technological infrastructure and a strong presence of major players. However, the Asia-Pacific region, particularly China and India, is expected to witness rapid growth due to increasing industrialization and expanding consumer electronics markets. Key players in the magnetics market, such as TDK Corporation, Vishay Intertechnology, and Murata Manufacturing, are actively engaged in research and development to improve component performance, efficiency, and miniaturization, further contributing to market growth. Competitive landscape analysis indicates a mix of established players and emerging companies, leading to innovations and potential market disruptions.
Magnetics Market Report: 2019-2033 Forecast
This comprehensive report provides an in-depth analysis of the Magnetics Market, offering invaluable insights for industry professionals, investors, and strategic decision-makers. Covering the period 2019-2033, with a focus on 2025, this report meticulously examines market structure, dynamics, leading players, and future trends. The market is projected to reach xx Million by 2033, exhibiting a robust CAGR of xx% during the forecast period (2025-2033).
Magnetics Market Structure & Innovation Trends
The Magnetics Market is characterized by a moderately concentrated landscape, with key players like TDK Corporation, Vishay Intertechnology, and Bourns Inc. holding significant market share. However, smaller, specialized companies also contribute significantly, particularly in niche segments like thin-film inductors. Innovation is driven by the increasing demand for higher efficiency, miniaturization, and improved performance across diverse applications. Stringent regulatory frameworks concerning energy efficiency and electromagnetic compatibility (EMC) are further shaping market developments. Product substitutes, such as alternative energy storage solutions, pose a moderate threat, while M&A activities are relatively frequent, consolidating market power and accelerating technological advancements. Deal values have varied, with some acquisitions exceeding xx Million, primarily targeting companies with specialized technologies or strong market presence in specific geographic regions.
- Market Concentration: Moderately concentrated, with top players holding xx% market share (2025).
- Innovation Drivers: Higher efficiency, miniaturization, improved performance, stringent EMC regulations.
- M&A Activity: Frequent, with deal values ranging from xx Million to xx Million.
Magnetics Market Dynamics & Trends
The Magnetics Market is experiencing robust growth, fueled by the increasing adoption of electric vehicles (EV/HEV), renewable energy technologies (photovoltaics and wind), and the expansion of industrial automation. Technological advancements, such as the development of advanced materials and improved manufacturing processes, are enhancing product performance and driving down costs. Consumer preferences for smaller, more energy-efficient electronics are further stimulating market demand. Competitive dynamics are characterized by intense rivalry among established players and the emergence of new entrants offering innovative solutions. Market penetration of new technologies, such as GaN-based transformers, is gradually increasing, while the overall market growth is significantly driven by the burgeoning EV/HEV segment.
Dominant Regions & Segments in Magnetics Market
The Asia-Pacific region dominates the Magnetics Market, driven by rapid industrialization, significant investments in renewable energy infrastructure, and a robust electronics manufacturing sector. Within the segments, Wire Wound Inductors and Multi-layer Inductors currently hold the largest market share due to their wide applicability across various end-user applications. The EV/HEV segment exhibits exceptional growth potential due to increasing vehicle electrification globally.
Leading Region: Asia-Pacific (China, Japan, South Korea)
Dominant Segments: Wire Wound Inductor, Multi-layer Inductor, EV/HEV application segment.
Key Drivers for Asia-Pacific: Rapid industrialization, strong government support for renewable energy, high electronics production.
Key Drivers for EV/HEV segment: Increasing vehicle electrification, government incentives, stringent emission norms.
Magnetics Market Product Innovations
Recent product innovations include the development of higher-power density inductors, miniaturized transformers, and improved EMI filters. These advancements address the increasing demand for smaller, more efficient, and reliable components across diverse applications, such as smartphones, electric vehicles, and renewable energy systems. Companies are focusing on developing products with enhanced thermal performance and superior electromagnetic shielding capabilities.
Report Scope & Segmentation Analysis
This report comprehensively analyzes the Magnetics Market across various segments:
By Type: Wire Wound Inductor, Multi-layer Inductor, Thin Film Inductor, Ferrite Cores and EMC Components, EMI Filters, RF/Power Transformers, Current Sense and Other Transformers. Each segment demonstrates unique growth trajectories, influenced by factors such as technological advancements and specific application requirements.
By End-user Application: Photovoltaics and wind, EV/HEV, Industrial (Motors/UPS), Rail/Transportation, Consumer Electronics, Other End-user Applications. The EV/HEV segment is projected to witness the highest CAGR, followed by renewable energy applications. Competitive dynamics vary across segments, with some characterized by intense competition and others by a more fragmented landscape.
Key Drivers of Magnetics Market Growth
The Magnetics Market's growth is primarily driven by the rising demand for energy-efficient and compact electronics across multiple sectors. The proliferation of electric vehicles, renewable energy adoption, and industrial automation initiatives are significant contributors. Government regulations promoting energy efficiency further stimulate market growth. Technological advancements, such as the development of novel materials and manufacturing processes, are enabling the creation of smaller and more efficient magnetic components.
Challenges in the Magnetics Market Sector
The Magnetics Market faces challenges such as fluctuations in raw material prices, increasing competition from low-cost manufacturers, and the complexity of meeting stringent regulatory requirements for electromagnetic compatibility (EMC) and energy efficiency. Supply chain disruptions, especially those caused by geopolitical events, may lead to production delays and increased component costs. These factors can impact profitability and market growth.
Emerging Opportunities in Magnetics Market
Emerging opportunities lie in the growing demand for advanced magnetic components in high-growth sectors such as 5G infrastructure, data centers, and medical devices. The development of innovative materials and manufacturing techniques offers significant potential for enhancing product performance and reducing costs. The focus on miniaturization and integration will also drive new product development. Exploring new markets in developing economies also represents a significant growth opportunity.
Leading Players in the Magnetics Market
- Meritek Electronics Corporation
- Vishay Intertechnology
- Coilcraft Inc
- Yageo Corporation
- AVX Corporation (Kyocera Group)
- Wurth Elektronik Group
- Taiyo Yuden Co Ltd
- Bourns Inc
- TDK Corporation
- Exxelia Technology
- Panasonic Corporation
Key Developments in Magnetics Market Industry
February 2024: Bourns introduced the SM91801AL BMS signal transformer, optimized for higher energy storage and compatible with Analog Devices LTC6815 Series, NXP MC33771C Series, and Texas Instruments BQ79616. This reflects the growing need for advanced components in energy storage systems.
October 2023: TAIYO YUDEN launched its LSDP Series Wire-Wound Metal Power Inductors, available through Future Electronics. This expansion in distribution channels aims to increase market reach and meet growing demands across various industries.
Future Outlook for Magnetics Market
The Magnetics Market is poised for continued growth, driven by technological advancements, rising demand from diverse industries, and increasing investments in renewable energy infrastructure. Strategic partnerships, focused R&D efforts, and expansion into new geographical markets will be crucial for success in this dynamic landscape. The adoption of advanced materials and manufacturing processes will unlock further efficiency gains and market expansion.
Magnetics Market Segmentation
-
1. Type
- 1.1. Wire Wound Inductor
- 1.2. Multi-layer Inductor
- 1.3. Thin Film Inductor
- 1.4. Ferrite Cores and EMC Components
- 1.5. EMI Filters
- 1.6. RF/Power Transformers
- 1.7. Current Sense and Other Transformers
-
2. End-user Application
- 2.1. Photovoltaics and wind
- 2.2. EV/HEV
- 2.3. Industrial (Motors/UPS)
- 2.4. Rail/Transportation
- 2.5. Consumer Electronics
- 2.6. Other End-user Applications
Magnetics Market Segmentation By Geography
- 1. China
- 2. Japan
- 3. United States
- 4. Taiwan
- 5. South East Asia
- 6. South Korea
- 7. Europe
- 8. Latin America
- 9. Middle East and Africa
Magnetics Market REPORT HIGHLIGHTS
| Aspects | Details |
|---|---|
| Study Period | 2019-2033 |
| Base Year | 2024 |
| Estimated Year | 2025 |
| Forecast Period | 2025-2033 |
| Historical Period | 2019-2024 |
| Growth Rate | CAGR of 5.60% from 2019-2033 |
| Segmentation |
|
Table of Contents
- 1. Introduction
- 1.1. Research Scope
- 1.2. Market Segmentation
- 1.3. Research Methodology
- 1.4. Definitions and Assumptions
- 2. Executive Summary
- 2.1. Introduction
- 3. Market Dynamics
- 3.1. Introduction
- 3.2. Market Drivers
- 3.2.1. Increasing Demand For Renewable Energy; Rising Demand For Electric and Autonomous Vehicles Drives Magnetic Components Market
- 3.3. Market Restrains
- 3.3.1 Rising Cost of Raw Materials
- 3.3.2 Especially Copper
- 3.4. Market Trends
- 3.4.1. Industrial (Motors/UPS) to Witness the Growth
- 4. Market Factor Analysis
- 4.1. Porters Five Forces
- 4.2. Supply/Value Chain
- 4.3. PESTEL analysis
- 4.4. Market Entropy
- 4.5. Patent/Trademark Analysis
- 5. Global Magnetics Market Analysis, Insights and Forecast, 2019-2031
- 5.1. Market Analysis, Insights and Forecast - by Type
- 5.1.1. Wire Wound Inductor
- 5.1.2. Multi-layer Inductor
- 5.1.3. Thin Film Inductor
- 5.1.4. Ferrite Cores and EMC Components
- 5.1.5. EMI Filters
- 5.1.6. RF/Power Transformers
- 5.1.7. Current Sense and Other Transformers
- 5.2. Market Analysis, Insights and Forecast - by End-user Application
- 5.2.1. Photovoltaics and wind
- 5.2.2. EV/HEV
- 5.2.3. Industrial (Motors/UPS)
- 5.2.4. Rail/Transportation
- 5.2.5. Consumer Electronics
- 5.2.6. Other End-user Applications
- 5.3. Market Analysis, Insights and Forecast - by Region
- 5.3.1. China
- 5.3.2. Japan
- 5.3.3. United States
- 5.3.4. Taiwan
- 5.3.5. South East Asia
- 5.3.6. South Korea
- 5.3.7. Europe
- 5.3.8. Latin America
- 5.3.9. Middle East and Africa
- 5.1. Market Analysis, Insights and Forecast - by Type
- 6. China Magnetics Market Analysis, Insights and Forecast, 2019-2031
- 6.1. Market Analysis, Insights and Forecast - by Type
- 6.1.1. Wire Wound Inductor
- 6.1.2. Multi-layer Inductor
- 6.1.3. Thin Film Inductor
- 6.1.4. Ferrite Cores and EMC Components
- 6.1.5. EMI Filters
- 6.1.6. RF/Power Transformers
- 6.1.7. Current Sense and Other Transformers
- 6.2. Market Analysis, Insights and Forecast - by End-user Application
- 6.2.1. Photovoltaics and wind
- 6.2.2. EV/HEV
- 6.2.3. Industrial (Motors/UPS)
- 6.2.4. Rail/Transportation
- 6.2.5. Consumer Electronics
- 6.2.6. Other End-user Applications
- 6.1. Market Analysis, Insights and Forecast - by Type
- 7. Japan Magnetics Market Analysis, Insights and Forecast, 2019-2031
- 7.1. Market Analysis, Insights and Forecast - by Type
- 7.1.1. Wire Wound Inductor
- 7.1.2. Multi-layer Inductor
- 7.1.3. Thin Film Inductor
- 7.1.4. Ferrite Cores and EMC Components
- 7.1.5. EMI Filters
- 7.1.6. RF/Power Transformers
- 7.1.7. Current Sense and Other Transformers
- 7.2. Market Analysis, Insights and Forecast - by End-user Application
- 7.2.1. Photovoltaics and wind
- 7.2.2. EV/HEV
- 7.2.3. Industrial (Motors/UPS)
- 7.2.4. Rail/Transportation
- 7.2.5. Consumer Electronics
- 7.2.6. Other End-user Applications
- 7.1. Market Analysis, Insights and Forecast - by Type
- 8. United States Magnetics Market Analysis, Insights and Forecast, 2019-2031
- 8.1. Market Analysis, Insights and Forecast - by Type
- 8.1.1. Wire Wound Inductor
- 8.1.2. Multi-layer Inductor
- 8.1.3. Thin Film Inductor
- 8.1.4. Ferrite Cores and EMC Components
- 8.1.5. EMI Filters
- 8.1.6. RF/Power Transformers
- 8.1.7. Current Sense and Other Transformers
- 8.2. Market Analysis, Insights and Forecast - by End-user Application
- 8.2.1. Photovoltaics and wind
- 8.2.2. EV/HEV
- 8.2.3. Industrial (Motors/UPS)
- 8.2.4. Rail/Transportation
- 8.2.5. Consumer Electronics
- 8.2.6. Other End-user Applications
- 8.1. Market Analysis, Insights and Forecast - by Type
- 9. Taiwan Magnetics Market Analysis, Insights and Forecast, 2019-2031
- 9.1. Market Analysis, Insights and Forecast - by Type
- 9.1.1. Wire Wound Inductor
- 9.1.2. Multi-layer Inductor
- 9.1.3. Thin Film Inductor
- 9.1.4. Ferrite Cores and EMC Components
- 9.1.5. EMI Filters
- 9.1.6. RF/Power Transformers
- 9.1.7. Current Sense and Other Transformers
- 9.2. Market Analysis, Insights and Forecast - by End-user Application
- 9.2.1. Photovoltaics and wind
- 9.2.2. EV/HEV
- 9.2.3. Industrial (Motors/UPS)
- 9.2.4. Rail/Transportation
- 9.2.5. Consumer Electronics
- 9.2.6. Other End-user Applications
- 9.1. Market Analysis, Insights and Forecast - by Type
- 10. South East Asia Magnetics Market Analysis, Insights and Forecast, 2019-2031
- 10.1. Market Analysis, Insights and Forecast - by Type
- 10.1.1. Wire Wound Inductor
- 10.1.2. Multi-layer Inductor
- 10.1.3. Thin Film Inductor
- 10.1.4. Ferrite Cores and EMC Components
- 10.1.5. EMI Filters
- 10.1.6. RF/Power Transformers
- 10.1.7. Current Sense and Other Transformers
- 10.2. Market Analysis, Insights and Forecast - by End-user Application
- 10.2.1. Photovoltaics and wind
- 10.2.2. EV/HEV
- 10.2.3. Industrial (Motors/UPS)
- 10.2.4. Rail/Transportation
- 10.2.5. Consumer Electronics
- 10.2.6. Other End-user Applications
- 10.1. Market Analysis, Insights and Forecast - by Type
- 11. South Korea Magnetics Market Analysis, Insights and Forecast, 2019-2031
- 11.1. Market Analysis, Insights and Forecast - by Type
- 11.1.1. Wire Wound Inductor
- 11.1.2. Multi-layer Inductor
- 11.1.3. Thin Film Inductor
- 11.1.4. Ferrite Cores and EMC Components
- 11.1.5. EMI Filters
- 11.1.6. RF/Power Transformers
- 11.1.7. Current Sense and Other Transformers
- 11.2. Market Analysis, Insights and Forecast - by End-user Application
- 11.2.1. Photovoltaics and wind
- 11.2.2. EV/HEV
- 11.2.3. Industrial (Motors/UPS)
- 11.2.4. Rail/Transportation
- 11.2.5. Consumer Electronics
- 11.2.6. Other End-user Applications
- 11.1. Market Analysis, Insights and Forecast - by Type
- 12. Europe Magnetics Market Analysis, Insights and Forecast, 2019-2031
- 12.1. Market Analysis, Insights and Forecast - by Type
- 12.1.1. Wire Wound Inductor
- 12.1.2. Multi-layer Inductor
- 12.1.3. Thin Film Inductor
- 12.1.4. Ferrite Cores and EMC Components
- 12.1.5. EMI Filters
- 12.1.6. RF/Power Transformers
- 12.1.7. Current Sense and Other Transformers
- 12.2. Market Analysis, Insights and Forecast - by End-user Application
- 12.2.1. Photovoltaics and wind
- 12.2.2. EV/HEV
- 12.2.3. Industrial (Motors/UPS)
- 12.2.4. Rail/Transportation
- 12.2.5. Consumer Electronics
- 12.2.6. Other End-user Applications
- 12.1. Market Analysis, Insights and Forecast - by Type
- 13. Latin America Magnetics Market Analysis, Insights and Forecast, 2019-2031
- 13.1. Market Analysis, Insights and Forecast - by Type
- 13.1.1. Wire Wound Inductor
- 13.1.2. Multi-layer Inductor
- 13.1.3. Thin Film Inductor
- 13.1.4. Ferrite Cores and EMC Components
- 13.1.5. EMI Filters
- 13.1.6. RF/Power Transformers
- 13.1.7. Current Sense and Other Transformers
- 13.2. Market Analysis, Insights and Forecast - by End-user Application
- 13.2.1. Photovoltaics and wind
- 13.2.2. EV/HEV
- 13.2.3. Industrial (Motors/UPS)
- 13.2.4. Rail/Transportation
- 13.2.5. Consumer Electronics
- 13.2.6. Other End-user Applications
- 13.1. Market Analysis, Insights and Forecast - by Type
- 14. Middle East and Africa Magnetics Market Analysis, Insights and Forecast, 2019-2031
- 14.1. Market Analysis, Insights and Forecast - by Type
- 14.1.1. Wire Wound Inductor
- 14.1.2. Multi-layer Inductor
- 14.1.3. Thin Film Inductor
- 14.1.4. Ferrite Cores and EMC Components
- 14.1.5. EMI Filters
- 14.1.6. RF/Power Transformers
- 14.1.7. Current Sense and Other Transformers
- 14.2. Market Analysis, Insights and Forecast - by End-user Application
- 14.2.1. Photovoltaics and wind
- 14.2.2. EV/HEV
- 14.2.3. Industrial (Motors/UPS)
- 14.2.4. Rail/Transportation
- 14.2.5. Consumer Electronics
- 14.2.6. Other End-user Applications
- 14.1. Market Analysis, Insights and Forecast - by Type
- 15. North America Magnetics Market Analysis, Insights and Forecast, 2019-2031
- 15.1. Market Analysis, Insights and Forecast - By Country/Sub-region
- 15.1.1 United States
- 15.1.2 Canada
- 15.1.3 Mexico
- 16. Europe Magnetics Market Analysis, Insights and Forecast, 2019-2031
- 16.1. Market Analysis, Insights and Forecast - By Country/Sub-region
- 16.1.1 Germany
- 16.1.2 United Kingdom
- 16.1.3 France
- 16.1.4 Spain
- 16.1.5 Italy
- 16.1.6 Spain
- 16.1.7 Belgium
- 16.1.8 Netherland
- 16.1.9 Nordics
- 16.1.10 Rest of Europe
- 17. Asia Pacific Magnetics Market Analysis, Insights and Forecast, 2019-2031
- 17.1. Market Analysis, Insights and Forecast - By Country/Sub-region
- 17.1.1 China
- 17.1.2 Japan
- 17.1.3 India
- 17.1.4 South Korea
- 17.1.5 Southeast Asia
- 17.1.6 Australia
- 17.1.7 Indonesia
- 17.1.8 Phillipes
- 17.1.9 Singapore
- 17.1.10 Thailandc
- 17.1.11 Rest of Asia Pacific
- 18. South America Magnetics Market Analysis, Insights and Forecast, 2019-2031
- 18.1. Market Analysis, Insights and Forecast - By Country/Sub-region
- 18.1.1 Brazil
- 18.1.2 Argentina
- 18.1.3 Peru
- 18.1.4 Chile
- 18.1.5 Colombia
- 18.1.6 Ecuador
- 18.1.7 Venezuela
- 18.1.8 Rest of South America
- 19. North America Magnetics Market Analysis, Insights and Forecast, 2019-2031
- 19.1. Market Analysis, Insights and Forecast - By Country/Sub-region
- 19.1.1 United States
- 19.1.2 Canada
- 19.1.3 Mexico
- 20. MEA Magnetics Market Analysis, Insights and Forecast, 2019-2031
- 20.1. Market Analysis, Insights and Forecast - By Country/Sub-region
- 20.1.1 United Arab Emirates
- 20.1.2 Saudi Arabia
- 20.1.3 South Africa
- 20.1.4 Rest of Middle East and Africa
- 21. Competitive Analysis
- 21.1. Global Market Share Analysis 2024
- 21.2. Company Profiles
- 21.2.1 Meritek Electronics Corporation
- 21.2.1.1. Overview
- 21.2.1.2. Products
- 21.2.1.3. SWOT Analysis
- 21.2.1.4. Recent Developments
- 21.2.1.5. Financials (Based on Availability)
- 21.2.2 Vishay Intertechnology
- 21.2.2.1. Overview
- 21.2.2.2. Products
- 21.2.2.3. SWOT Analysis
- 21.2.2.4. Recent Developments
- 21.2.2.5. Financials (Based on Availability)
- 21.2.3 Coilcraft Inc
- 21.2.3.1. Overview
- 21.2.3.2. Products
- 21.2.3.3. SWOT Analysis
- 21.2.3.4. Recent Developments
- 21.2.3.5. Financials (Based on Availability)
- 21.2.4 Yageo Corporation
- 21.2.4.1. Overview
- 21.2.4.2. Products
- 21.2.4.3. SWOT Analysis
- 21.2.4.4. Recent Developments
- 21.2.4.5. Financials (Based on Availability)
- 21.2.5 AVX Corporation (Kyocera Group)
- 21.2.5.1. Overview
- 21.2.5.2. Products
- 21.2.5.3. SWOT Analysis
- 21.2.5.4. Recent Developments
- 21.2.5.5. Financials (Based on Availability)
- 21.2.6 Wurth Elektronik Group
- 21.2.6.1. Overview
- 21.2.6.2. Products
- 21.2.6.3. SWOT Analysis
- 21.2.6.4. Recent Developments
- 21.2.6.5. Financials (Based on Availability)
- 21.2.7 Taiyo Yuden Co Ltd
- 21.2.7.1. Overview
- 21.2.7.2. Products
- 21.2.7.3. SWOT Analysis
- 21.2.7.4. Recent Developments
- 21.2.7.5. Financials (Based on Availability)
- 21.2.8 Bourns Inc
- 21.2.8.1. Overview
- 21.2.8.2. Products
- 21.2.8.3. SWOT Analysis
- 21.2.8.4. Recent Developments
- 21.2.8.5. Financials (Based on Availability)
- 21.2.9 TDK Corporation
- 21.2.9.1. Overview
- 21.2.9.2. Products
- 21.2.9.3. SWOT Analysis
- 21.2.9.4. Recent Developments
- 21.2.9.5. Financials (Based on Availability)
- 21.2.10 Exxelia Technology
- 21.2.10.1. Overview
- 21.2.10.2. Products
- 21.2.10.3. SWOT Analysis
- 21.2.10.4. Recent Developments
- 21.2.10.5. Financials (Based on Availability)
- 21.2.11 Panasonic Corporation
- 21.2.11.1. Overview
- 21.2.11.2. Products
- 21.2.11.3. SWOT Analysis
- 21.2.11.4. Recent Developments
- 21.2.11.5. Financials (Based on Availability)
- 21.2.1 Meritek Electronics Corporation
List of Figures
- Figure 1: Global Magnetics Market Revenue Breakdown (Million, %) by Region 2024 & 2032
- Figure 2: North America Magnetics Market Revenue (Million), by Country 2024 & 2032
- Figure 3: North America Magnetics Market Revenue Share (%), by Country 2024 & 2032
- Figure 4: Europe Magnetics Market Revenue (Million), by Country 2024 & 2032
- Figure 5: Europe Magnetics Market Revenue Share (%), by Country 2024 & 2032
- Figure 6: Asia Pacific Magnetics Market Revenue (Million), by Country 2024 & 2032
- Figure 7: Asia Pacific Magnetics Market Revenue Share (%), by Country 2024 & 2032
- Figure 8: South America Magnetics Market Revenue (Million), by Country 2024 & 2032
- Figure 9: South America Magnetics Market Revenue Share (%), by Country 2024 & 2032
- Figure 10: North America Magnetics Market Revenue (Million), by Country 2024 & 2032
- Figure 11: North America Magnetics Market Revenue Share (%), by Country 2024 & 2032
- Figure 12: MEA Magnetics Market Revenue (Million), by Country 2024 & 2032
- Figure 13: MEA Magnetics Market Revenue Share (%), by Country 2024 & 2032
- Figure 14: China Magnetics Market Revenue (Million), by Type 2024 & 2032
- Figure 15: China Magnetics Market Revenue Share (%), by Type 2024 & 2032
- Figure 16: China Magnetics Market Revenue (Million), by End-user Application 2024 & 2032
- Figure 17: China Magnetics Market Revenue Share (%), by End-user Application 2024 & 2032
- Figure 18: China Magnetics Market Revenue (Million), by Country 2024 & 2032
- Figure 19: China Magnetics Market Revenue Share (%), by Country 2024 & 2032
- Figure 20: Japan Magnetics Market Revenue (Million), by Type 2024 & 2032
- Figure 21: Japan Magnetics Market Revenue Share (%), by Type 2024 & 2032
- Figure 22: Japan Magnetics Market Revenue (Million), by End-user Application 2024 & 2032
- Figure 23: Japan Magnetics Market Revenue Share (%), by End-user Application 2024 & 2032
- Figure 24: Japan Magnetics Market Revenue (Million), by Country 2024 & 2032
- Figure 25: Japan Magnetics Market Revenue Share (%), by Country 2024 & 2032
- Figure 26: United States Magnetics Market Revenue (Million), by Type 2024 & 2032
- Figure 27: United States Magnetics Market Revenue Share (%), by Type 2024 & 2032
- Figure 28: United States Magnetics Market Revenue (Million), by End-user Application 2024 & 2032
- Figure 29: United States Magnetics Market Revenue Share (%), by End-user Application 2024 & 2032
- Figure 30: United States Magnetics Market Revenue (Million), by Country 2024 & 2032
- Figure 31: United States Magnetics Market Revenue Share (%), by Country 2024 & 2032
- Figure 32: Taiwan Magnetics Market Revenue (Million), by Type 2024 & 2032
- Figure 33: Taiwan Magnetics Market Revenue Share (%), by Type 2024 & 2032
- Figure 34: Taiwan Magnetics Market Revenue (Million), by End-user Application 2024 & 2032
- Figure 35: Taiwan Magnetics Market Revenue Share (%), by End-user Application 2024 & 2032
- Figure 36: Taiwan Magnetics Market Revenue (Million), by Country 2024 & 2032
- Figure 37: Taiwan Magnetics Market Revenue Share (%), by Country 2024 & 2032
- Figure 38: South East Asia Magnetics Market Revenue (Million), by Type 2024 & 2032
- Figure 39: South East Asia Magnetics Market Revenue Share (%), by Type 2024 & 2032
- Figure 40: South East Asia Magnetics Market Revenue (Million), by End-user Application 2024 & 2032
- Figure 41: South East Asia Magnetics Market Revenue Share (%), by End-user Application 2024 & 2032
- Figure 42: South East Asia Magnetics Market Revenue (Million), by Country 2024 & 2032
- Figure 43: South East Asia Magnetics Market Revenue Share (%), by Country 2024 & 2032
- Figure 44: South Korea Magnetics Market Revenue (Million), by Type 2024 & 2032
- Figure 45: South Korea Magnetics Market Revenue Share (%), by Type 2024 & 2032
- Figure 46: South Korea Magnetics Market Revenue (Million), by End-user Application 2024 & 2032
- Figure 47: South Korea Magnetics Market Revenue Share (%), by End-user Application 2024 & 2032
- Figure 48: South Korea Magnetics Market Revenue (Million), by Country 2024 & 2032
- Figure 49: South Korea Magnetics Market Revenue Share (%), by Country 2024 & 2032
- Figure 50: Europe Magnetics Market Revenue (Million), by Type 2024 & 2032
- Figure 51: Europe Magnetics Market Revenue Share (%), by Type 2024 & 2032
- Figure 52: Europe Magnetics Market Revenue (Million), by End-user Application 2024 & 2032
- Figure 53: Europe Magnetics Market Revenue Share (%), by End-user Application 2024 & 2032
- Figure 54: Europe Magnetics Market Revenue (Million), by Country 2024 & 2032
- Figure 55: Europe Magnetics Market Revenue Share (%), by Country 2024 & 2032
- Figure 56: Latin America Magnetics Market Revenue (Million), by Type 2024 & 2032
- Figure 57: Latin America Magnetics Market Revenue Share (%), by Type 2024 & 2032
- Figure 58: Latin America Magnetics Market Revenue (Million), by End-user Application 2024 & 2032
- Figure 59: Latin America Magnetics Market Revenue Share (%), by End-user Application 2024 & 2032
- Figure 60: Latin America Magnetics Market Revenue (Million), by Country 2024 & 2032
- Figure 61: Latin America Magnetics Market Revenue Share (%), by Country 2024 & 2032
- Figure 62: Middle East and Africa Magnetics Market Revenue (Million), by Type 2024 & 2032
- Figure 63: Middle East and Africa Magnetics Market Revenue Share (%), by Type 2024 & 2032
- Figure 64: Middle East and Africa Magnetics Market Revenue (Million), by End-user Application 2024 & 2032
- Figure 65: Middle East and Africa Magnetics Market Revenue Share (%), by End-user Application 2024 & 2032
- Figure 66: Middle East and Africa Magnetics Market Revenue (Million), by Country 2024 & 2032
- Figure 67: Middle East and Africa Magnetics Market Revenue Share (%), by Country 2024 & 2032
List of Tables
- Table 1: Global Magnetics Market Revenue Million Forecast, by Region 2019 & 2032
- Table 2: Global Magnetics Market Revenue Million Forecast, by Type 2019 & 2032
- Table 3: Global Magnetics Market Revenue Million Forecast, by End-user Application 2019 & 2032
- Table 4: Global Magnetics Market Revenue Million Forecast, by Region 2019 & 2032
- Table 5: Global Magnetics Market Revenue Million Forecast, by Country 2019 & 2032
- Table 6: United States Magnetics Market Revenue (Million) Forecast, by Application 2019 & 2032
- Table 7: Canada Magnetics Market Revenue (Million) Forecast, by Application 2019 & 2032
- Table 8: Mexico Magnetics Market Revenue (Million) Forecast, by Application 2019 & 2032
- Table 9: Global Magnetics Market Revenue Million Forecast, by Country 2019 & 2032
- Table 10: Germany Magnetics Market Revenue (Million) Forecast, by Application 2019 & 2032
- Table 11: United Kingdom Magnetics Market Revenue (Million) Forecast, by Application 2019 & 2032
- Table 12: France Magnetics Market Revenue (Million) Forecast, by Application 2019 & 2032
- Table 13: Spain Magnetics Market Revenue (Million) Forecast, by Application 2019 & 2032
- Table 14: Italy Magnetics Market Revenue (Million) Forecast, by Application 2019 & 2032
- Table 15: Spain Magnetics Market Revenue (Million) Forecast, by Application 2019 & 2032
- Table 16: Belgium Magnetics Market Revenue (Million) Forecast, by Application 2019 & 2032
- Table 17: Netherland Magnetics Market Revenue (Million) Forecast, by Application 2019 & 2032
- Table 18: Nordics Magnetics Market Revenue (Million) Forecast, by Application 2019 & 2032
- Table 19: Rest of Europe Magnetics Market Revenue (Million) Forecast, by Application 2019 & 2032
- Table 20: Global Magnetics Market Revenue Million Forecast, by Country 2019 & 2032
- Table 21: China Magnetics Market Revenue (Million) Forecast, by Application 2019 & 2032
- Table 22: Japan Magnetics Market Revenue (Million) Forecast, by Application 2019 & 2032
- Table 23: India Magnetics Market Revenue (Million) Forecast, by Application 2019 & 2032
- Table 24: South Korea Magnetics Market Revenue (Million) Forecast, by Application 2019 & 2032
- Table 25: Southeast Asia Magnetics Market Revenue (Million) Forecast, by Application 2019 & 2032
- Table 26: Australia Magnetics Market Revenue (Million) Forecast, by Application 2019 & 2032
- Table 27: Indonesia Magnetics Market Revenue (Million) Forecast, by Application 2019 & 2032
- Table 28: Phillipes Magnetics Market Revenue (Million) Forecast, by Application 2019 & 2032
- Table 29: Singapore Magnetics Market Revenue (Million) Forecast, by Application 2019 & 2032
- Table 30: Thailandc Magnetics Market Revenue (Million) Forecast, by Application 2019 & 2032
- Table 31: Rest of Asia Pacific Magnetics Market Revenue (Million) Forecast, by Application 2019 & 2032
- Table 32: Global Magnetics Market Revenue Million Forecast, by Country 2019 & 2032
- Table 33: Brazil Magnetics Market Revenue (Million) Forecast, by Application 2019 & 2032
- Table 34: Argentina Magnetics Market Revenue (Million) Forecast, by Application 2019 & 2032
- Table 35: Peru Magnetics Market Revenue (Million) Forecast, by Application 2019 & 2032
- Table 36: Chile Magnetics Market Revenue (Million) Forecast, by Application 2019 & 2032
- Table 37: Colombia Magnetics Market Revenue (Million) Forecast, by Application 2019 & 2032
- Table 38: Ecuador Magnetics Market Revenue (Million) Forecast, by Application 2019 & 2032
- Table 39: Venezuela Magnetics Market Revenue (Million) Forecast, by Application 2019 & 2032
- Table 40: Rest of South America Magnetics Market Revenue (Million) Forecast, by Application 2019 & 2032
- Table 41: Global Magnetics Market Revenue Million Forecast, by Country 2019 & 2032
- Table 42: United States Magnetics Market Revenue (Million) Forecast, by Application 2019 & 2032
- Table 43: Canada Magnetics Market Revenue (Million) Forecast, by Application 2019 & 2032
- Table 44: Mexico Magnetics Market Revenue (Million) Forecast, by Application 2019 & 2032
- Table 45: Global Magnetics Market Revenue Million Forecast, by Country 2019 & 2032
- Table 46: United Arab Emirates Magnetics Market Revenue (Million) Forecast, by Application 2019 & 2032
- Table 47: Saudi Arabia Magnetics Market Revenue (Million) Forecast, by Application 2019 & 2032
- Table 48: South Africa Magnetics Market Revenue (Million) Forecast, by Application 2019 & 2032
- Table 49: Rest of Middle East and Africa Magnetics Market Revenue (Million) Forecast, by Application 2019 & 2032
- Table 50: Global Magnetics Market Revenue Million Forecast, by Type 2019 & 2032
- Table 51: Global Magnetics Market Revenue Million Forecast, by End-user Application 2019 & 2032
- Table 52: Global Magnetics Market Revenue Million Forecast, by Country 2019 & 2032
- Table 53: Global Magnetics Market Revenue Million Forecast, by Type 2019 & 2032
- Table 54: Global Magnetics Market Revenue Million Forecast, by End-user Application 2019 & 2032
- Table 55: Global Magnetics Market Revenue Million Forecast, by Country 2019 & 2032
- Table 56: Global Magnetics Market Revenue Million Forecast, by Type 2019 & 2032
- Table 57: Global Magnetics Market Revenue Million Forecast, by End-user Application 2019 & 2032
- Table 58: Global Magnetics Market Revenue Million Forecast, by Country 2019 & 2032
- Table 59: Global Magnetics Market Revenue Million Forecast, by Type 2019 & 2032
- Table 60: Global Magnetics Market Revenue Million Forecast, by End-user Application 2019 & 2032
- Table 61: Global Magnetics Market Revenue Million Forecast, by Country 2019 & 2032
- Table 62: Global Magnetics Market Revenue Million Forecast, by Type 2019 & 2032
- Table 63: Global Magnetics Market Revenue Million Forecast, by End-user Application 2019 & 2032
- Table 64: Global Magnetics Market Revenue Million Forecast, by Country 2019 & 2032
- Table 65: Global Magnetics Market Revenue Million Forecast, by Type 2019 & 2032
- Table 66: Global Magnetics Market Revenue Million Forecast, by End-user Application 2019 & 2032
- Table 67: Global Magnetics Market Revenue Million Forecast, by Country 2019 & 2032
- Table 68: Global Magnetics Market Revenue Million Forecast, by Type 2019 & 2032
- Table 69: Global Magnetics Market Revenue Million Forecast, by End-user Application 2019 & 2032
- Table 70: Global Magnetics Market Revenue Million Forecast, by Country 2019 & 2032
- Table 71: Global Magnetics Market Revenue Million Forecast, by Type 2019 & 2032
- Table 72: Global Magnetics Market Revenue Million Forecast, by End-user Application 2019 & 2032
- Table 73: Global Magnetics Market Revenue Million Forecast, by Country 2019 & 2032
- Table 74: Global Magnetics Market Revenue Million Forecast, by Type 2019 & 2032
- Table 75: Global Magnetics Market Revenue Million Forecast, by End-user Application 2019 & 2032
- Table 76: Global Magnetics Market Revenue Million Forecast, by Country 2019 & 2032
Frequently Asked Questions
1. What is the projected Compound Annual Growth Rate (CAGR) of the Magnetics Market?
The projected CAGR is approximately 5.60%.
2. Which companies are prominent players in the Magnetics Market?
Key companies in the market include Meritek Electronics Corporation, Vishay Intertechnology, Coilcraft Inc, Yageo Corporation, AVX Corporation (Kyocera Group), Wurth Elektronik Group, Taiyo Yuden Co Ltd, Bourns Inc, TDK Corporation, Exxelia Technology, Panasonic Corporation.
3. What are the main segments of the Magnetics Market?
The market segments include Type, End-user Application.
4. Can you provide details about the market size?
The market size is estimated to be USD 14.10 Million as of 2022.
5. What are some drivers contributing to market growth?
Increasing Demand For Renewable Energy; Rising Demand For Electric and Autonomous Vehicles Drives Magnetic Components Market.
6. What are the notable trends driving market growth?
Industrial (Motors/UPS) to Witness the Growth.
7. Are there any restraints impacting market growth?
Rising Cost of Raw Materials. Especially Copper.
8. Can you provide examples of recent developments in the market?
February 2024 - Bourns introduced a BMS signal transformer optimized for higher energy storage. SM91801AL was developed with the analog device model LTC6815 Series, NXP Model MC33771C Series, and Texas Instruments Model BQ79616.
9. What pricing options are available for accessing the report?
Pricing options include single-user, multi-user, and enterprise licenses priced at USD 4750, USD 5250, and USD 8750 respectively.
10. Is the market size provided in terms of value or volume?
The market size is provided in terms of value, measured in Million.
11. Are there any specific market keywords associated with the report?
Yes, the market keyword associated with the report is "Magnetics Market," which aids in identifying and referencing the specific market segment covered.
12. How do I determine which pricing option suits my needs best?
The pricing options vary based on user requirements and access needs. Individual users may opt for single-user licenses, while businesses requiring broader access may choose multi-user or enterprise licenses for cost-effective access to the report.
13. Are there any additional resources or data provided in the Magnetics Market report?
While the report offers comprehensive insights, it's advisable to review the specific contents or supplementary materials provided to ascertain if additional resources or data are available.
14. How can I stay updated on further developments or reports in the Magnetics Market?
To stay informed about further developments, trends, and reports in the Magnetics Market, consider subscribing to industry newsletters, following relevant companies and organizations, or regularly checking reputable industry news sources and publications.
Methodology
Step 1 - Identification of Relevant Samples Size from Population Database


Step 2 - Approaches for Defining Global Market Size (Value, Volume* & Price*)

Note*: In applicable scenarios
Step 3 - Data Sources
Primary Research
- Web Analytics
- Survey Reports
- Research Institute
- Latest Research Reports
- Opinion Leaders
Secondary Research
- Annual Reports
- White Paper
- Latest Press Release
- Industry Association
- Paid Database
- Investor Presentations

Step 4 - Data Triangulation
Involves using different sources of information in order to increase the validity of a study
These sources are likely to be stakeholders in a program - participants, other researchers, program staff, other community members, and so on.
Then we put all data in single framework & apply various statistical tools to find out the dynamic on the market.
During the analysis stage, feedback from the stakeholder groups would be compared to determine areas of agreement as well as areas of divergence


