
Key Insights
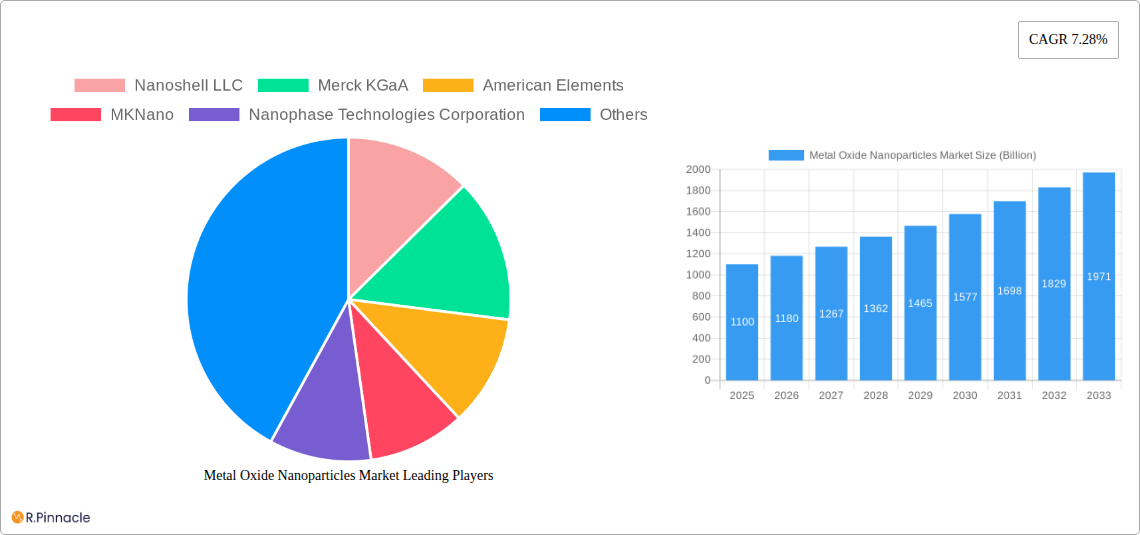
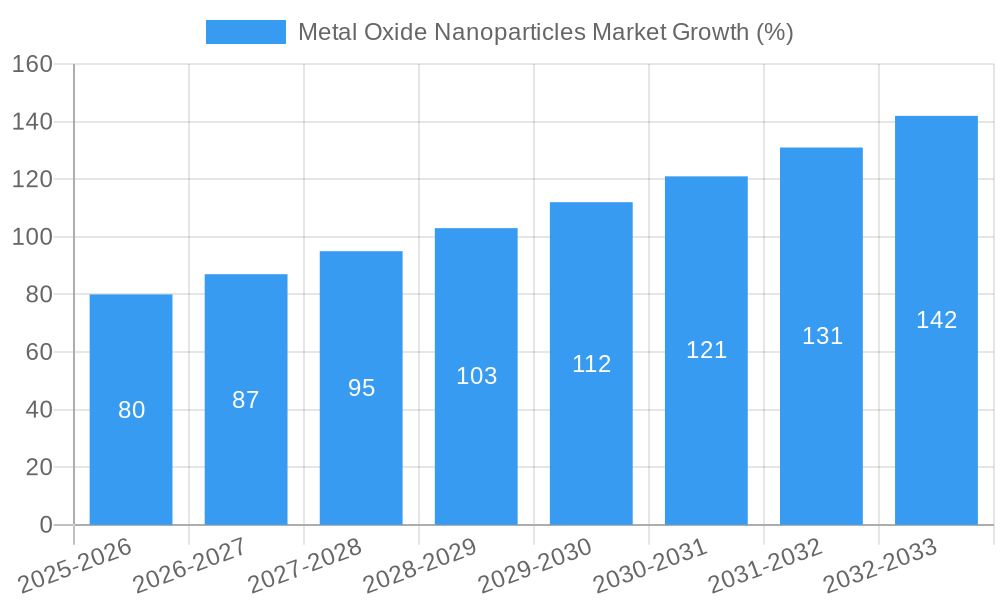
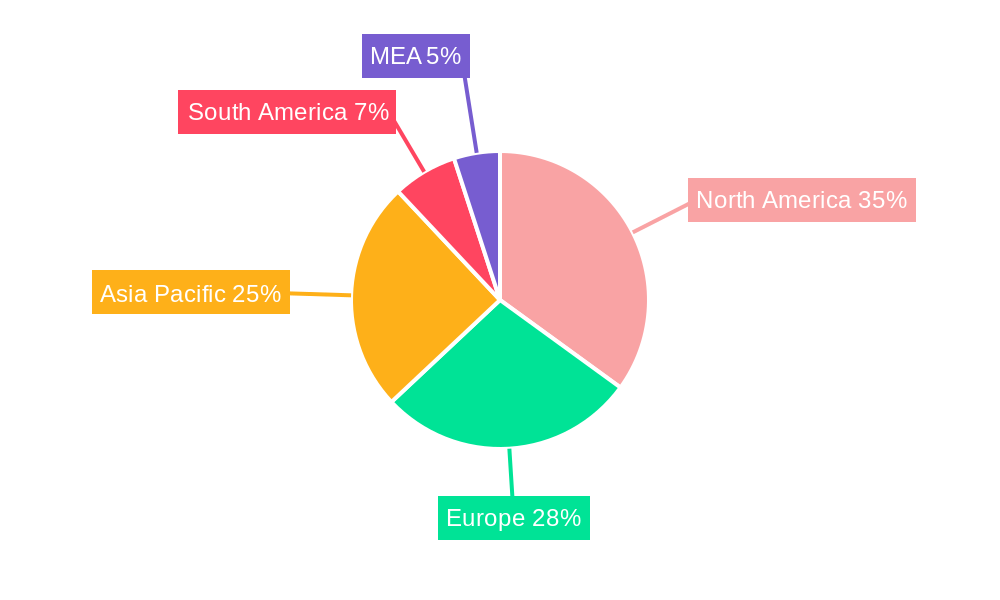
The Metal Oxide Nanoparticles market, valued at $1.1 billion in 2025, is projected to experience robust growth, driven by a compound annual growth rate (CAGR) of 7.28% from 2025 to 2033. This expansion is fueled by the increasing demand across diverse sectors. The optics and electronics industry leverages metal oxide nanoparticles for their unique optical and electrical properties in advanced displays, sensors, and integrated circuits. Simultaneously, the healthcare sector utilizes these nanoparticles in drug delivery systems, diagnostics, and regenerative medicine, capitalizing on their biocompatibility and targeted delivery capabilities. The construction industry benefits from their incorporation into high-performance materials offering enhanced durability and functionality. Furthermore, the automotive and transportation sectors are integrating these nanoparticles to improve fuel efficiency and reduce emissions. Growth in personal care products utilizing metal oxide nanoparticles for sunscreens and cosmetics also contributes significantly to market expansion. The market is segmented by product type (Aluminum Oxide, Titanium Dioxide, Silicon Dioxide, Magnesium Oxide, Zinc Oxide, and Others) and end-user industry. While Titanium Dioxide and Zinc Oxide currently dominate the product segment, the Others category, encompassing emerging applications and novel materials, shows significant growth potential. Geographic distribution reveals strong market presence across North America, Europe, and Asia-Pacific, with China and the United States acting as major contributors. However, emerging economies in Asia-Pacific and South America present substantial untapped opportunities for future growth. The market faces certain restraints such as regulatory concerns surrounding the safety and environmental impact of nanoparticles, which require careful consideration and adherence to evolving guidelines.
The competitive landscape is characterized by a mix of established players and emerging companies. Key players such as Merck KGaA, Nanophase Technologies Corporation, and Nanoshell LLC are investing heavily in research and development to introduce innovative products and expand their market share. The continuous innovation in synthesis methods, surface functionalization, and characterization techniques is fostering the development of new applications and expanding the scope of metal oxide nanoparticles. Strategic partnerships, acquisitions, and collaborations among industry players are further intensifying competition and driving innovation within this dynamic market. The continued technological advancements and expanding applications across various industries will likely sustain the robust growth trajectory of the metal oxide nanoparticles market in the coming years, making it a promising area for investment and development.
This in-depth report provides a comprehensive analysis of the Metal Oxide Nanoparticles market, offering actionable insights for industry professionals and strategic decision-makers. Valued at Billion USD in 2025, the market is poised for significant growth, projected to reach Billion USD by 2033, exhibiting a robust CAGR of xx% during the forecast period (2025-2033). The study covers the historical period (2019-2024), base year (2025), and estimated year (2025).
Metal Oxide Nanoparticles Market Structure & Innovation Trends
This section analyzes the competitive landscape, innovation drivers, and regulatory aspects of the Metal Oxide Nanoparticles market. The market exhibits a moderately concentrated structure, with key players like Merck KGaA, NanoResearch Elements Inc, and Nanophase Technologies Corporation holding significant market share (xx%, xx%, and xx% respectively, as of 2025). However, several smaller players are also contributing to market growth.
- Market Concentration: The Herfindahl-Hirschman Index (HHI) for the market is estimated at xx, suggesting a moderately concentrated market.
- Innovation Drivers: Significant investments in R&D, particularly in the development of novel synthesis techniques and functionalized nanoparticles, are driving innovation. The emergence of advanced characterization techniques also plays a crucial role.
- Regulatory Framework: Stringent regulations regarding the safety and handling of nanoparticles are shaping market dynamics. Compliance costs and certifications are impacting market entry.
- Product Substitutes: The market faces competition from alternative materials with similar functionalities, limiting market growth to some extent. However, the unique properties of metal oxide nanoparticles continue to provide a competitive edge.
- End-User Demographics: The market is driven by diverse end-user industries, with significant demand from optics & electronics, healthcare, and construction sectors. The expanding applications of these nanoparticles across these sectors fuels market growth.
- M&A Activities: The past five years have witnessed xx M&A deals in the Metal Oxide Nanoparticles market, with a total value of approximately Billion USD. These activities have reshaped the market landscape, leading to increased competition and market consolidation.
Metal Oxide Nanoparticles Market Dynamics & Trends
The Metal Oxide Nanoparticles market is experiencing robust growth, fueled by several key factors. Increasing demand from diverse end-user sectors, technological advancements, and favorable government policies are contributing to this expansion. The market exhibits a strong growth trajectory, primarily driven by the increasing adoption of metal oxide nanoparticles in various applications due to their unique properties. The CAGR is projected to be xx% during the forecast period, with market penetration rates expected to increase from xx% in 2025 to xx% by 2033. Technological advancements in synthesis and functionalization methods are also accelerating market growth. Consumer preferences are shifting towards sustainable and eco-friendly materials, presenting both challenges and opportunities for market players. Competitive dynamics are intense, with established players and new entrants vying for market share through strategic partnerships, innovation, and aggressive pricing strategies.
Dominant Regions & Segments in Metal Oxide Nanoparticles Market
The Asia-Pacific region dominates the Metal Oxide Nanoparticles market, accounting for approximately xx% of the global market share in 2025. This dominance is attributable to several factors:
Key Drivers in Asia-Pacific:
- Robust economic growth and industrial expansion
- Rapid technological advancements and infrastructure development
- Favorable government policies supporting nanotechnology research and development
- Growing demand from electronics and healthcare sectors
Dominant Segments:
- Product: Titanium Dioxide nanoparticles hold the largest market share, followed by Zinc Oxide and Silicon Dioxide. This is due to their wide range of applications and established market presence.
- End-user Industry: The Optics & Electronics sector accounts for the largest share of market demand, followed by Healthcare and Construction. The electronics industry's continued expansion and the growing healthcare sector are driving demand for these products.
Detailed dominance analysis reveals that specific countries within the Asia-Pacific region, such as China and India, are experiencing particularly high growth rates due to their robust manufacturing sectors and large populations. The North American and European markets are also significant contributors, exhibiting steady growth driven by technological advancements and regulatory changes.
Metal Oxide Nanoparticles Market Product Innovations
Recent years have witnessed significant advancements in the synthesis and functionalization of metal oxide nanoparticles. New methods, such as sol-gel processing and hydrothermal synthesis, are enabling the production of nanoparticles with enhanced properties, including improved size control, crystallinity, and surface functionality. These innovations expand the range of applications for metal oxide nanoparticles and enhance their performance in existing applications. The development of novel surface coatings and functional groups further broadens their utility. This focus on technological improvements is aligning with evolving market needs and resulting in a competitive landscape marked by continuous product enhancements.
Report Scope & Segmentation Analysis
This report segments the Metal Oxide Nanoparticles market based on product type (Aluminium Oxide, Titanium Dioxide, Silicon Dioxide, Magnesium Oxide, Zinc Oxide, Others) and end-user industry (Optics & Electronics, Healthcare, Construction, Automotive & Transportation, Personal Care, Others). Each segment is analyzed in detail, including growth projections, market sizes, and competitive dynamics. The report provides a comprehensive overview of the market, including historical data, current market trends, and future projections. The detailed segmentation allows readers to gain a granular understanding of the market and identify potential opportunities for growth. Competitive analyses for each segment reveal significant market players and their strategies for maintaining market share.
Key Drivers of Metal Oxide Nanoparticles Market Growth
Several key factors are driving the growth of the Metal Oxide Nanoparticles market. These include:
- Technological advancements: Innovations in synthesis techniques and functionalization methods are leading to the development of nanoparticles with enhanced properties.
- Growing demand from diverse end-user industries: Metal oxide nanoparticles find applications across numerous sectors, including electronics, healthcare, and construction, driving market expansion.
- Favorable government regulations and policies: Government support for nanotechnology research and development is promoting market growth.
Challenges in the Metal Oxide Nanoparticles Market Sector
Despite the significant growth potential, the Metal Oxide Nanoparticles market faces several challenges:
- Stringent regulations and safety concerns: Regulations surrounding the handling and disposal of nanoparticles pose significant challenges to manufacturers.
- Supply chain complexities: Ensuring consistent supply of high-quality raw materials can be challenging, particularly for specialized nanoparticle types.
- Intense competition: The market is characterized by intense competition, requiring companies to differentiate their products and offer competitive pricing. Price fluctuations in raw materials also affect profitability.
Emerging Opportunities in Metal Oxide Nanoparticles Market
The Metal Oxide Nanoparticles market presents numerous emerging opportunities:
- Development of new applications: Ongoing research is constantly uncovering new applications for these nanoparticles, expanding the market's potential.
- Focus on sustainability: The growing demand for eco-friendly materials presents opportunities for companies to develop sustainable and environmentally benign manufacturing processes.
- Expansion into new markets: Emerging economies offer significant growth potential for metal oxide nanoparticle producers.
Leading Players in the Metal Oxide Nanoparticles Market Market
- Nanoshell LLC
- Merck KGaA
- American Elements
- MKNano
- Nanophase Technologies Corporation
- EPRUI Biotech Co Ltd
- Xuan Cheng Jing Rui New Material Co Ltd
- NanoResearch Elements Inc
- Meliorum Technologies Inc
- Reinste
- SkySpring Nanomaterials Inc
Key Developments in Metal Oxide Nanoparticles Market Industry
- 2022-Q4: Merck KGaA announced a significant investment in expanding its metal oxide nanoparticle production capacity.
- 2023-Q1: Nanophase Technologies Corporation launched a new line of functionalized titanium dioxide nanoparticles.
- 2024-Q2: A strategic partnership was formed between two key players resulting in a joint venture focused on developing novel applications for metal oxide nanoparticles. (Further details would be included in the full report)
Future Outlook for Metal Oxide Nanoparticles Market Market
The Metal Oxide Nanoparticles market is poised for continued robust growth, driven by ongoing technological advancements, expansion into new applications, and increasing demand from diverse sectors. Strategic partnerships and investments in research and development will further shape market dynamics. The market's growth potential is significant, offering lucrative opportunities for companies that can effectively navigate the challenges and capitalize on the emerging trends. Focusing on innovation, sustainability, and regulatory compliance will be crucial for achieving success in this dynamic market.
Metal Oxide Nanoparticles Market Segmentation
-
1. Product
- 1.1. Aluminium Oxide
- 1.2. Titanium Dioxide
- 1.3. Silicon Dioxide
- 1.4. Magnesium Oxide
- 1.5. Zinc Oxide
- 1.6. Others
-
2. End-user Industry
- 2.1. Optics & Electronics
- 2.2. Healthcare
- 2.3. Construction
- 2.4. Automotive & Transportation
- 2.5. Personal Care
- 2.6. Others
Metal Oxide Nanoparticles Market Segmentation By Geography
-
1. Asia Pacific
- 1.1. China
- 1.2. India
- 1.3. Japan
- 1.4. South Korea
- 1.5. Rest of Asia Pacific
-
2. North America
- 2.1. United States
- 2.2. Canada
- 2.3. Mexico
-
3. Europe
- 3.1. Germany
- 3.2. United Kingdom
- 3.3. France
- 3.4. Italy
- 3.5. Rest of Europe
-
4. Rest of the World
- 4.1. South America
- 4.2. Middle East and Africa
Metal Oxide Nanoparticles Market REPORT HIGHLIGHTS
| Aspects | Details |
|---|---|
| Study Period | 2019-2033 |
| Base Year | 2024 |
| Estimated Year | 2025 |
| Forecast Period | 2025-2033 |
| Historical Period | 2019-2024 |
| Growth Rate | CAGR of 7.28% from 2019-2033 |
| Segmentation |
|
Table of Contents
- 1. Introduction
- 1.1. Research Scope
- 1.2. Market Segmentation
- 1.3. Research Methodology
- 1.4. Definitions and Assumptions
- 2. Executive Summary
- 2.1. Introduction
- 3. Market Dynamics
- 3.1. Introduction
- 3.2. Market Drivers
- 3.2.1. ; Growing Electronics Industry; Rising Demand from Pharmaceutical Sector
- 3.3. Market Restrains
- 3.3.1. ; Hazardous Nature of Metal Oxide Nanoparticles; Unfavorable Conditions Arising Due to COVID-19 Outbreak
- 3.4. Market Trends
- 3.4.1. Electronics Sector to Dominate the Market
- 4. Market Factor Analysis
- 4.1. Porters Five Forces
- 4.2. Supply/Value Chain
- 4.3. PESTEL analysis
- 4.4. Market Entropy
- 4.5. Patent/Trademark Analysis
- 5. Global Metal Oxide Nanoparticles Market Analysis, Insights and Forecast, 2019-2031
- 5.1. Market Analysis, Insights and Forecast - by Product
- 5.1.1. Aluminium Oxide
- 5.1.2. Titanium Dioxide
- 5.1.3. Silicon Dioxide
- 5.1.4. Magnesium Oxide
- 5.1.5. Zinc Oxide
- 5.1.6. Others
- 5.2. Market Analysis, Insights and Forecast - by End-user Industry
- 5.2.1. Optics & Electronics
- 5.2.2. Healthcare
- 5.2.3. Construction
- 5.2.4. Automotive & Transportation
- 5.2.5. Personal Care
- 5.2.6. Others
- 5.3. Market Analysis, Insights and Forecast - by Region
- 5.3.1. Asia Pacific
- 5.3.2. North America
- 5.3.3. Europe
- 5.3.4. Rest of the World
- 5.1. Market Analysis, Insights and Forecast - by Product
- 6. Asia Pacific Metal Oxide Nanoparticles Market Analysis, Insights and Forecast, 2019-2031
- 6.1. Market Analysis, Insights and Forecast - by Product
- 6.1.1. Aluminium Oxide
- 6.1.2. Titanium Dioxide
- 6.1.3. Silicon Dioxide
- 6.1.4. Magnesium Oxide
- 6.1.5. Zinc Oxide
- 6.1.6. Others
- 6.2. Market Analysis, Insights and Forecast - by End-user Industry
- 6.2.1. Optics & Electronics
- 6.2.2. Healthcare
- 6.2.3. Construction
- 6.2.4. Automotive & Transportation
- 6.2.5. Personal Care
- 6.2.6. Others
- 6.1. Market Analysis, Insights and Forecast - by Product
- 7. North America Metal Oxide Nanoparticles Market Analysis, Insights and Forecast, 2019-2031
- 7.1. Market Analysis, Insights and Forecast - by Product
- 7.1.1. Aluminium Oxide
- 7.1.2. Titanium Dioxide
- 7.1.3. Silicon Dioxide
- 7.1.4. Magnesium Oxide
- 7.1.5. Zinc Oxide
- 7.1.6. Others
- 7.2. Market Analysis, Insights and Forecast - by End-user Industry
- 7.2.1. Optics & Electronics
- 7.2.2. Healthcare
- 7.2.3. Construction
- 7.2.4. Automotive & Transportation
- 7.2.5. Personal Care
- 7.2.6. Others
- 7.1. Market Analysis, Insights and Forecast - by Product
- 8. Europe Metal Oxide Nanoparticles Market Analysis, Insights and Forecast, 2019-2031
- 8.1. Market Analysis, Insights and Forecast - by Product
- 8.1.1. Aluminium Oxide
- 8.1.2. Titanium Dioxide
- 8.1.3. Silicon Dioxide
- 8.1.4. Magnesium Oxide
- 8.1.5. Zinc Oxide
- 8.1.6. Others
- 8.2. Market Analysis, Insights and Forecast - by End-user Industry
- 8.2.1. Optics & Electronics
- 8.2.2. Healthcare
- 8.2.3. Construction
- 8.2.4. Automotive & Transportation
- 8.2.5. Personal Care
- 8.2.6. Others
- 8.1. Market Analysis, Insights and Forecast - by Product
- 9. Rest of the World Metal Oxide Nanoparticles Market Analysis, Insights and Forecast, 2019-2031
- 9.1. Market Analysis, Insights and Forecast - by Product
- 9.1.1. Aluminium Oxide
- 9.1.2. Titanium Dioxide
- 9.1.3. Silicon Dioxide
- 9.1.4. Magnesium Oxide
- 9.1.5. Zinc Oxide
- 9.1.6. Others
- 9.2. Market Analysis, Insights and Forecast - by End-user Industry
- 9.2.1. Optics & Electronics
- 9.2.2. Healthcare
- 9.2.3. Construction
- 9.2.4. Automotive & Transportation
- 9.2.5. Personal Care
- 9.2.6. Others
- 9.1. Market Analysis, Insights and Forecast - by Product
- 10. North America Metal Oxide Nanoparticles Market Analysis, Insights and Forecast, 2019-2031
- 10.1. Market Analysis, Insights and Forecast - By Country/Sub-region
- 10.1.1 United States
- 10.1.2 Canada
- 10.1.3 Mexico
- 11. Europe Metal Oxide Nanoparticles Market Analysis, Insights and Forecast, 2019-2031
- 11.1. Market Analysis, Insights and Forecast - By Country/Sub-region
- 11.1.1 Germany
- 11.1.2 France
- 11.1.3 Italy
- 11.1.4 United Kingdom
- 11.1.5 Netherlands
- 11.1.6 Rest of Europe
- 12. Asia Pacific Metal Oxide Nanoparticles Market Analysis, Insights and Forecast, 2019-2031
- 12.1. Market Analysis, Insights and Forecast - By Country/Sub-region
- 12.1.1 China
- 12.1.2 Japan
- 12.1.3 India
- 12.1.4 South Korea
- 12.1.5 Taiwan
- 12.1.6 Australia
- 12.1.7 Rest of Asia-Pacific
- 13. South America Metal Oxide Nanoparticles Market Analysis, Insights and Forecast, 2019-2031
- 13.1. Market Analysis, Insights and Forecast - By Country/Sub-region
- 13.1.1 Brazil
- 13.1.2 Argentina
- 13.1.3 Rest of South America
- 14. MEA Metal Oxide Nanoparticles Market Analysis, Insights and Forecast, 2019-2031
- 14.1. Market Analysis, Insights and Forecast - By Country/Sub-region
- 14.1.1 Middle East
- 14.1.2 Africa
- 15. Competitive Analysis
- 15.1. Global Market Share Analysis 2024
- 15.2. Company Profiles
- 15.2.1 Nanoshell LLC
- 15.2.1.1. Overview
- 15.2.1.2. Products
- 15.2.1.3. SWOT Analysis
- 15.2.1.4. Recent Developments
- 15.2.1.5. Financials (Based on Availability)
- 15.2.2 Merck KGaA
- 15.2.2.1. Overview
- 15.2.2.2. Products
- 15.2.2.3. SWOT Analysis
- 15.2.2.4. Recent Developments
- 15.2.2.5. Financials (Based on Availability)
- 15.2.3 American Elements
- 15.2.3.1. Overview
- 15.2.3.2. Products
- 15.2.3.3. SWOT Analysis
- 15.2.3.4. Recent Developments
- 15.2.3.5. Financials (Based on Availability)
- 15.2.4 MKNano
- 15.2.4.1. Overview
- 15.2.4.2. Products
- 15.2.4.3. SWOT Analysis
- 15.2.4.4. Recent Developments
- 15.2.4.5. Financials (Based on Availability)
- 15.2.5 Nanophase Technologies Corporation
- 15.2.5.1. Overview
- 15.2.5.2. Products
- 15.2.5.3. SWOT Analysis
- 15.2.5.4. Recent Developments
- 15.2.5.5. Financials (Based on Availability)
- 15.2.6 EPRUI Biotech Co Ltd
- 15.2.6.1. Overview
- 15.2.6.2. Products
- 15.2.6.3. SWOT Analysis
- 15.2.6.4. Recent Developments
- 15.2.6.5. Financials (Based on Availability)
- 15.2.7 Xuan Cheng Jing Rui New Material Co Ltd
- 15.2.7.1. Overview
- 15.2.7.2. Products
- 15.2.7.3. SWOT Analysis
- 15.2.7.4. Recent Developments
- 15.2.7.5. Financials (Based on Availability)
- 15.2.8 NanoResearch Elements Inc
- 15.2.8.1. Overview
- 15.2.8.2. Products
- 15.2.8.3. SWOT Analysis
- 15.2.8.4. Recent Developments
- 15.2.8.5. Financials (Based on Availability)
- 15.2.9 Meliorum Technologies Inc
- 15.2.9.1. Overview
- 15.2.9.2. Products
- 15.2.9.3. SWOT Analysis
- 15.2.9.4. Recent Developments
- 15.2.9.5. Financials (Based on Availability)
- 15.2.10 Reinste
- 15.2.10.1. Overview
- 15.2.10.2. Products
- 15.2.10.3. SWOT Analysis
- 15.2.10.4. Recent Developments
- 15.2.10.5. Financials (Based on Availability)
- 15.2.11 SkySpring Nanomaterials Inc
- 15.2.11.1. Overview
- 15.2.11.2. Products
- 15.2.11.3. SWOT Analysis
- 15.2.11.4. Recent Developments
- 15.2.11.5. Financials (Based on Availability)
- 15.2.1 Nanoshell LLC
List of Figures
- Figure 1: Global Metal Oxide Nanoparticles Market Revenue Breakdown (Billion, %) by Region 2024 & 2032
- Figure 2: Global Metal Oxide Nanoparticles Market Volume Breakdown (K Tons, %) by Region 2024 & 2032
- Figure 3: North America Metal Oxide Nanoparticles Market Revenue (Billion), by Country 2024 & 2032
- Figure 4: North America Metal Oxide Nanoparticles Market Volume (K Tons), by Country 2024 & 2032
- Figure 5: North America Metal Oxide Nanoparticles Market Revenue Share (%), by Country 2024 & 2032
- Figure 6: North America Metal Oxide Nanoparticles Market Volume Share (%), by Country 2024 & 2032
- Figure 7: Europe Metal Oxide Nanoparticles Market Revenue (Billion), by Country 2024 & 2032
- Figure 8: Europe Metal Oxide Nanoparticles Market Volume (K Tons), by Country 2024 & 2032
- Figure 9: Europe Metal Oxide Nanoparticles Market Revenue Share (%), by Country 2024 & 2032
- Figure 10: Europe Metal Oxide Nanoparticles Market Volume Share (%), by Country 2024 & 2032
- Figure 11: Asia Pacific Metal Oxide Nanoparticles Market Revenue (Billion), by Country 2024 & 2032
- Figure 12: Asia Pacific Metal Oxide Nanoparticles Market Volume (K Tons), by Country 2024 & 2032
- Figure 13: Asia Pacific Metal Oxide Nanoparticles Market Revenue Share (%), by Country 2024 & 2032
- Figure 14: Asia Pacific Metal Oxide Nanoparticles Market Volume Share (%), by Country 2024 & 2032
- Figure 15: South America Metal Oxide Nanoparticles Market Revenue (Billion), by Country 2024 & 2032
- Figure 16: South America Metal Oxide Nanoparticles Market Volume (K Tons), by Country 2024 & 2032
- Figure 17: South America Metal Oxide Nanoparticles Market Revenue Share (%), by Country 2024 & 2032
- Figure 18: South America Metal Oxide Nanoparticles Market Volume Share (%), by Country 2024 & 2032
- Figure 19: MEA Metal Oxide Nanoparticles Market Revenue (Billion), by Country 2024 & 2032
- Figure 20: MEA Metal Oxide Nanoparticles Market Volume (K Tons), by Country 2024 & 2032
- Figure 21: MEA Metal Oxide Nanoparticles Market Revenue Share (%), by Country 2024 & 2032
- Figure 22: MEA Metal Oxide Nanoparticles Market Volume Share (%), by Country 2024 & 2032
- Figure 23: Asia Pacific Metal Oxide Nanoparticles Market Revenue (Billion), by Product 2024 & 2032
- Figure 24: Asia Pacific Metal Oxide Nanoparticles Market Volume (K Tons), by Product 2024 & 2032
- Figure 25: Asia Pacific Metal Oxide Nanoparticles Market Revenue Share (%), by Product 2024 & 2032
- Figure 26: Asia Pacific Metal Oxide Nanoparticles Market Volume Share (%), by Product 2024 & 2032
- Figure 27: Asia Pacific Metal Oxide Nanoparticles Market Revenue (Billion), by End-user Industry 2024 & 2032
- Figure 28: Asia Pacific Metal Oxide Nanoparticles Market Volume (K Tons), by End-user Industry 2024 & 2032
- Figure 29: Asia Pacific Metal Oxide Nanoparticles Market Revenue Share (%), by End-user Industry 2024 & 2032
- Figure 30: Asia Pacific Metal Oxide Nanoparticles Market Volume Share (%), by End-user Industry 2024 & 2032
- Figure 31: Asia Pacific Metal Oxide Nanoparticles Market Revenue (Billion), by Country 2024 & 2032
- Figure 32: Asia Pacific Metal Oxide Nanoparticles Market Volume (K Tons), by Country 2024 & 2032
- Figure 33: Asia Pacific Metal Oxide Nanoparticles Market Revenue Share (%), by Country 2024 & 2032
- Figure 34: Asia Pacific Metal Oxide Nanoparticles Market Volume Share (%), by Country 2024 & 2032
- Figure 35: North America Metal Oxide Nanoparticles Market Revenue (Billion), by Product 2024 & 2032
- Figure 36: North America Metal Oxide Nanoparticles Market Volume (K Tons), by Product 2024 & 2032
- Figure 37: North America Metal Oxide Nanoparticles Market Revenue Share (%), by Product 2024 & 2032
- Figure 38: North America Metal Oxide Nanoparticles Market Volume Share (%), by Product 2024 & 2032
- Figure 39: North America Metal Oxide Nanoparticles Market Revenue (Billion), by End-user Industry 2024 & 2032
- Figure 40: North America Metal Oxide Nanoparticles Market Volume (K Tons), by End-user Industry 2024 & 2032
- Figure 41: North America Metal Oxide Nanoparticles Market Revenue Share (%), by End-user Industry 2024 & 2032
- Figure 42: North America Metal Oxide Nanoparticles Market Volume Share (%), by End-user Industry 2024 & 2032
- Figure 43: North America Metal Oxide Nanoparticles Market Revenue (Billion), by Country 2024 & 2032
- Figure 44: North America Metal Oxide Nanoparticles Market Volume (K Tons), by Country 2024 & 2032
- Figure 45: North America Metal Oxide Nanoparticles Market Revenue Share (%), by Country 2024 & 2032
- Figure 46: North America Metal Oxide Nanoparticles Market Volume Share (%), by Country 2024 & 2032
- Figure 47: Europe Metal Oxide Nanoparticles Market Revenue (Billion), by Product 2024 & 2032
- Figure 48: Europe Metal Oxide Nanoparticles Market Volume (K Tons), by Product 2024 & 2032
- Figure 49: Europe Metal Oxide Nanoparticles Market Revenue Share (%), by Product 2024 & 2032
- Figure 50: Europe Metal Oxide Nanoparticles Market Volume Share (%), by Product 2024 & 2032
- Figure 51: Europe Metal Oxide Nanoparticles Market Revenue (Billion), by End-user Industry 2024 & 2032
- Figure 52: Europe Metal Oxide Nanoparticles Market Volume (K Tons), by End-user Industry 2024 & 2032
- Figure 53: Europe Metal Oxide Nanoparticles Market Revenue Share (%), by End-user Industry 2024 & 2032
- Figure 54: Europe Metal Oxide Nanoparticles Market Volume Share (%), by End-user Industry 2024 & 2032
- Figure 55: Europe Metal Oxide Nanoparticles Market Revenue (Billion), by Country 2024 & 2032
- Figure 56: Europe Metal Oxide Nanoparticles Market Volume (K Tons), by Country 2024 & 2032
- Figure 57: Europe Metal Oxide Nanoparticles Market Revenue Share (%), by Country 2024 & 2032
- Figure 58: Europe Metal Oxide Nanoparticles Market Volume Share (%), by Country 2024 & 2032
- Figure 59: Rest of the World Metal Oxide Nanoparticles Market Revenue (Billion), by Product 2024 & 2032
- Figure 60: Rest of the World Metal Oxide Nanoparticles Market Volume (K Tons), by Product 2024 & 2032
- Figure 61: Rest of the World Metal Oxide Nanoparticles Market Revenue Share (%), by Product 2024 & 2032
- Figure 62: Rest of the World Metal Oxide Nanoparticles Market Volume Share (%), by Product 2024 & 2032
- Figure 63: Rest of the World Metal Oxide Nanoparticles Market Revenue (Billion), by End-user Industry 2024 & 2032
- Figure 64: Rest of the World Metal Oxide Nanoparticles Market Volume (K Tons), by End-user Industry 2024 & 2032
- Figure 65: Rest of the World Metal Oxide Nanoparticles Market Revenue Share (%), by End-user Industry 2024 & 2032
- Figure 66: Rest of the World Metal Oxide Nanoparticles Market Volume Share (%), by End-user Industry 2024 & 2032
- Figure 67: Rest of the World Metal Oxide Nanoparticles Market Revenue (Billion), by Country 2024 & 2032
- Figure 68: Rest of the World Metal Oxide Nanoparticles Market Volume (K Tons), by Country 2024 & 2032
- Figure 69: Rest of the World Metal Oxide Nanoparticles Market Revenue Share (%), by Country 2024 & 2032
- Figure 70: Rest of the World Metal Oxide Nanoparticles Market Volume Share (%), by Country 2024 & 2032
List of Tables
- Table 1: Global Metal Oxide Nanoparticles Market Revenue Billion Forecast, by Region 2019 & 2032
- Table 2: Global Metal Oxide Nanoparticles Market Volume K Tons Forecast, by Region 2019 & 2032
- Table 3: Global Metal Oxide Nanoparticles Market Revenue Billion Forecast, by Product 2019 & 2032
- Table 4: Global Metal Oxide Nanoparticles Market Volume K Tons Forecast, by Product 2019 & 2032
- Table 5: Global Metal Oxide Nanoparticles Market Revenue Billion Forecast, by End-user Industry 2019 & 2032
- Table 6: Global Metal Oxide Nanoparticles Market Volume K Tons Forecast, by End-user Industry 2019 & 2032
- Table 7: Global Metal Oxide Nanoparticles Market Revenue Billion Forecast, by Region 2019 & 2032
- Table 8: Global Metal Oxide Nanoparticles Market Volume K Tons Forecast, by Region 2019 & 2032
- Table 9: Global Metal Oxide Nanoparticles Market Revenue Billion Forecast, by Country 2019 & 2032
- Table 10: Global Metal Oxide Nanoparticles Market Volume K Tons Forecast, by Country 2019 & 2032
- Table 11: United States Metal Oxide Nanoparticles Market Revenue (Billion) Forecast, by Application 2019 & 2032
- Table 12: United States Metal Oxide Nanoparticles Market Volume (K Tons) Forecast, by Application 2019 & 2032
- Table 13: Canada Metal Oxide Nanoparticles Market Revenue (Billion) Forecast, by Application 2019 & 2032
- Table 14: Canada Metal Oxide Nanoparticles Market Volume (K Tons) Forecast, by Application 2019 & 2032
- Table 15: Mexico Metal Oxide Nanoparticles Market Revenue (Billion) Forecast, by Application 2019 & 2032
- Table 16: Mexico Metal Oxide Nanoparticles Market Volume (K Tons) Forecast, by Application 2019 & 2032
- Table 17: Global Metal Oxide Nanoparticles Market Revenue Billion Forecast, by Country 2019 & 2032
- Table 18: Global Metal Oxide Nanoparticles Market Volume K Tons Forecast, by Country 2019 & 2032
- Table 19: Germany Metal Oxide Nanoparticles Market Revenue (Billion) Forecast, by Application 2019 & 2032
- Table 20: Germany Metal Oxide Nanoparticles Market Volume (K Tons) Forecast, by Application 2019 & 2032
- Table 21: France Metal Oxide Nanoparticles Market Revenue (Billion) Forecast, by Application 2019 & 2032
- Table 22: France Metal Oxide Nanoparticles Market Volume (K Tons) Forecast, by Application 2019 & 2032
- Table 23: Italy Metal Oxide Nanoparticles Market Revenue (Billion) Forecast, by Application 2019 & 2032
- Table 24: Italy Metal Oxide Nanoparticles Market Volume (K Tons) Forecast, by Application 2019 & 2032
- Table 25: United Kingdom Metal Oxide Nanoparticles Market Revenue (Billion) Forecast, by Application 2019 & 2032
- Table 26: United Kingdom Metal Oxide Nanoparticles Market Volume (K Tons) Forecast, by Application 2019 & 2032
- Table 27: Netherlands Metal Oxide Nanoparticles Market Revenue (Billion) Forecast, by Application 2019 & 2032
- Table 28: Netherlands Metal Oxide Nanoparticles Market Volume (K Tons) Forecast, by Application 2019 & 2032
- Table 29: Rest of Europe Metal Oxide Nanoparticles Market Revenue (Billion) Forecast, by Application 2019 & 2032
- Table 30: Rest of Europe Metal Oxide Nanoparticles Market Volume (K Tons) Forecast, by Application 2019 & 2032
- Table 31: Global Metal Oxide Nanoparticles Market Revenue Billion Forecast, by Country 2019 & 2032
- Table 32: Global Metal Oxide Nanoparticles Market Volume K Tons Forecast, by Country 2019 & 2032
- Table 33: China Metal Oxide Nanoparticles Market Revenue (Billion) Forecast, by Application 2019 & 2032
- Table 34: China Metal Oxide Nanoparticles Market Volume (K Tons) Forecast, by Application 2019 & 2032
- Table 35: Japan Metal Oxide Nanoparticles Market Revenue (Billion) Forecast, by Application 2019 & 2032
- Table 36: Japan Metal Oxide Nanoparticles Market Volume (K Tons) Forecast, by Application 2019 & 2032
- Table 37: India Metal Oxide Nanoparticles Market Revenue (Billion) Forecast, by Application 2019 & 2032
- Table 38: India Metal Oxide Nanoparticles Market Volume (K Tons) Forecast, by Application 2019 & 2032
- Table 39: South Korea Metal Oxide Nanoparticles Market Revenue (Billion) Forecast, by Application 2019 & 2032
- Table 40: South Korea Metal Oxide Nanoparticles Market Volume (K Tons) Forecast, by Application 2019 & 2032
- Table 41: Taiwan Metal Oxide Nanoparticles Market Revenue (Billion) Forecast, by Application 2019 & 2032
- Table 42: Taiwan Metal Oxide Nanoparticles Market Volume (K Tons) Forecast, by Application 2019 & 2032
- Table 43: Australia Metal Oxide Nanoparticles Market Revenue (Billion) Forecast, by Application 2019 & 2032
- Table 44: Australia Metal Oxide Nanoparticles Market Volume (K Tons) Forecast, by Application 2019 & 2032
- Table 45: Rest of Asia-Pacific Metal Oxide Nanoparticles Market Revenue (Billion) Forecast, by Application 2019 & 2032
- Table 46: Rest of Asia-Pacific Metal Oxide Nanoparticles Market Volume (K Tons) Forecast, by Application 2019 & 2032
- Table 47: Global Metal Oxide Nanoparticles Market Revenue Billion Forecast, by Country 2019 & 2032
- Table 48: Global Metal Oxide Nanoparticles Market Volume K Tons Forecast, by Country 2019 & 2032
- Table 49: Brazil Metal Oxide Nanoparticles Market Revenue (Billion) Forecast, by Application 2019 & 2032
- Table 50: Brazil Metal Oxide Nanoparticles Market Volume (K Tons) Forecast, by Application 2019 & 2032
- Table 51: Argentina Metal Oxide Nanoparticles Market Revenue (Billion) Forecast, by Application 2019 & 2032
- Table 52: Argentina Metal Oxide Nanoparticles Market Volume (K Tons) Forecast, by Application 2019 & 2032
- Table 53: Rest of South America Metal Oxide Nanoparticles Market Revenue (Billion) Forecast, by Application 2019 & 2032
- Table 54: Rest of South America Metal Oxide Nanoparticles Market Volume (K Tons) Forecast, by Application 2019 & 2032
- Table 55: Global Metal Oxide Nanoparticles Market Revenue Billion Forecast, by Country 2019 & 2032
- Table 56: Global Metal Oxide Nanoparticles Market Volume K Tons Forecast, by Country 2019 & 2032
- Table 57: Middle East Metal Oxide Nanoparticles Market Revenue (Billion) Forecast, by Application 2019 & 2032
- Table 58: Middle East Metal Oxide Nanoparticles Market Volume (K Tons) Forecast, by Application 2019 & 2032
- Table 59: Africa Metal Oxide Nanoparticles Market Revenue (Billion) Forecast, by Application 2019 & 2032
- Table 60: Africa Metal Oxide Nanoparticles Market Volume (K Tons) Forecast, by Application 2019 & 2032
- Table 61: Global Metal Oxide Nanoparticles Market Revenue Billion Forecast, by Product 2019 & 2032
- Table 62: Global Metal Oxide Nanoparticles Market Volume K Tons Forecast, by Product 2019 & 2032
- Table 63: Global Metal Oxide Nanoparticles Market Revenue Billion Forecast, by End-user Industry 2019 & 2032
- Table 64: Global Metal Oxide Nanoparticles Market Volume K Tons Forecast, by End-user Industry 2019 & 2032
- Table 65: Global Metal Oxide Nanoparticles Market Revenue Billion Forecast, by Country 2019 & 2032
- Table 66: Global Metal Oxide Nanoparticles Market Volume K Tons Forecast, by Country 2019 & 2032
- Table 67: China Metal Oxide Nanoparticles Market Revenue (Billion) Forecast, by Application 2019 & 2032
- Table 68: China Metal Oxide Nanoparticles Market Volume (K Tons) Forecast, by Application 2019 & 2032
- Table 69: India Metal Oxide Nanoparticles Market Revenue (Billion) Forecast, by Application 2019 & 2032
- Table 70: India Metal Oxide Nanoparticles Market Volume (K Tons) Forecast, by Application 2019 & 2032
- Table 71: Japan Metal Oxide Nanoparticles Market Revenue (Billion) Forecast, by Application 2019 & 2032
- Table 72: Japan Metal Oxide Nanoparticles Market Volume (K Tons) Forecast, by Application 2019 & 2032
- Table 73: South Korea Metal Oxide Nanoparticles Market Revenue (Billion) Forecast, by Application 2019 & 2032
- Table 74: South Korea Metal Oxide Nanoparticles Market Volume (K Tons) Forecast, by Application 2019 & 2032
- Table 75: Rest of Asia Pacific Metal Oxide Nanoparticles Market Revenue (Billion) Forecast, by Application 2019 & 2032
- Table 76: Rest of Asia Pacific Metal Oxide Nanoparticles Market Volume (K Tons) Forecast, by Application 2019 & 2032
- Table 77: Global Metal Oxide Nanoparticles Market Revenue Billion Forecast, by Product 2019 & 2032
- Table 78: Global Metal Oxide Nanoparticles Market Volume K Tons Forecast, by Product 2019 & 2032
- Table 79: Global Metal Oxide Nanoparticles Market Revenue Billion Forecast, by End-user Industry 2019 & 2032
- Table 80: Global Metal Oxide Nanoparticles Market Volume K Tons Forecast, by End-user Industry 2019 & 2032
- Table 81: Global Metal Oxide Nanoparticles Market Revenue Billion Forecast, by Country 2019 & 2032
- Table 82: Global Metal Oxide Nanoparticles Market Volume K Tons Forecast, by Country 2019 & 2032
- Table 83: United States Metal Oxide Nanoparticles Market Revenue (Billion) Forecast, by Application 2019 & 2032
- Table 84: United States Metal Oxide Nanoparticles Market Volume (K Tons) Forecast, by Application 2019 & 2032
- Table 85: Canada Metal Oxide Nanoparticles Market Revenue (Billion) Forecast, by Application 2019 & 2032
- Table 86: Canada Metal Oxide Nanoparticles Market Volume (K Tons) Forecast, by Application 2019 & 2032
- Table 87: Mexico Metal Oxide Nanoparticles Market Revenue (Billion) Forecast, by Application 2019 & 2032
- Table 88: Mexico Metal Oxide Nanoparticles Market Volume (K Tons) Forecast, by Application 2019 & 2032
- Table 89: Global Metal Oxide Nanoparticles Market Revenue Billion Forecast, by Product 2019 & 2032
- Table 90: Global Metal Oxide Nanoparticles Market Volume K Tons Forecast, by Product 2019 & 2032
- Table 91: Global Metal Oxide Nanoparticles Market Revenue Billion Forecast, by End-user Industry 2019 & 2032
- Table 92: Global Metal Oxide Nanoparticles Market Volume K Tons Forecast, by End-user Industry 2019 & 2032
- Table 93: Global Metal Oxide Nanoparticles Market Revenue Billion Forecast, by Country 2019 & 2032
- Table 94: Global Metal Oxide Nanoparticles Market Volume K Tons Forecast, by Country 2019 & 2032
- Table 95: Germany Metal Oxide Nanoparticles Market Revenue (Billion) Forecast, by Application 2019 & 2032
- Table 96: Germany Metal Oxide Nanoparticles Market Volume (K Tons) Forecast, by Application 2019 & 2032
- Table 97: United Kingdom Metal Oxide Nanoparticles Market Revenue (Billion) Forecast, by Application 2019 & 2032
- Table 98: United Kingdom Metal Oxide Nanoparticles Market Volume (K Tons) Forecast, by Application 2019 & 2032
- Table 99: France Metal Oxide Nanoparticles Market Revenue (Billion) Forecast, by Application 2019 & 2032
- Table 100: France Metal Oxide Nanoparticles Market Volume (K Tons) Forecast, by Application 2019 & 2032
- Table 101: Italy Metal Oxide Nanoparticles Market Revenue (Billion) Forecast, by Application 2019 & 2032
- Table 102: Italy Metal Oxide Nanoparticles Market Volume (K Tons) Forecast, by Application 2019 & 2032
- Table 103: Rest of Europe Metal Oxide Nanoparticles Market Revenue (Billion) Forecast, by Application 2019 & 2032
- Table 104: Rest of Europe Metal Oxide Nanoparticles Market Volume (K Tons) Forecast, by Application 2019 & 2032
- Table 105: Global Metal Oxide Nanoparticles Market Revenue Billion Forecast, by Product 2019 & 2032
- Table 106: Global Metal Oxide Nanoparticles Market Volume K Tons Forecast, by Product 2019 & 2032
- Table 107: Global Metal Oxide Nanoparticles Market Revenue Billion Forecast, by End-user Industry 2019 & 2032
- Table 108: Global Metal Oxide Nanoparticles Market Volume K Tons Forecast, by End-user Industry 2019 & 2032
- Table 109: Global Metal Oxide Nanoparticles Market Revenue Billion Forecast, by Country 2019 & 2032
- Table 110: Global Metal Oxide Nanoparticles Market Volume K Tons Forecast, by Country 2019 & 2032
- Table 111: South America Metal Oxide Nanoparticles Market Revenue (Billion) Forecast, by Application 2019 & 2032
- Table 112: South America Metal Oxide Nanoparticles Market Volume (K Tons) Forecast, by Application 2019 & 2032
- Table 113: Middle East and Africa Metal Oxide Nanoparticles Market Revenue (Billion) Forecast, by Application 2019 & 2032
- Table 114: Middle East and Africa Metal Oxide Nanoparticles Market Volume (K Tons) Forecast, by Application 2019 & 2032
Frequently Asked Questions
1. What is the projected Compound Annual Growth Rate (CAGR) of the Metal Oxide Nanoparticles Market?
The projected CAGR is approximately 7.28%.
2. Which companies are prominent players in the Metal Oxide Nanoparticles Market?
Key companies in the market include Nanoshell LLC, Merck KGaA, American Elements, MKNano, Nanophase Technologies Corporation, EPRUI Biotech Co Ltd, Xuan Cheng Jing Rui New Material Co Ltd, NanoResearch Elements Inc, Meliorum Technologies Inc, Reinste, SkySpring Nanomaterials Inc.
3. What are the main segments of the Metal Oxide Nanoparticles Market?
The market segments include Product, End-user Industry.
4. Can you provide details about the market size?
The market size is estimated to be USD 1.1 Billion as of 2022.
5. What are some drivers contributing to market growth?
; Growing Electronics Industry; Rising Demand from Pharmaceutical Sector.
6. What are the notable trends driving market growth?
Electronics Sector to Dominate the Market.
7. Are there any restraints impacting market growth?
; Hazardous Nature of Metal Oxide Nanoparticles; Unfavorable Conditions Arising Due to COVID-19 Outbreak.
8. Can you provide examples of recent developments in the market?
N/A
9. What pricing options are available for accessing the report?
Pricing options include single-user, multi-user, and enterprise licenses priced at USD 4750, USD 5250, and USD 8750 respectively.
10. Is the market size provided in terms of value or volume?
The market size is provided in terms of value, measured in Billion and volume, measured in K Tons.
11. Are there any specific market keywords associated with the report?
Yes, the market keyword associated with the report is "Metal Oxide Nanoparticles Market," which aids in identifying and referencing the specific market segment covered.
12. How do I determine which pricing option suits my needs best?
The pricing options vary based on user requirements and access needs. Individual users may opt for single-user licenses, while businesses requiring broader access may choose multi-user or enterprise licenses for cost-effective access to the report.
13. Are there any additional resources or data provided in the Metal Oxide Nanoparticles Market report?
While the report offers comprehensive insights, it's advisable to review the specific contents or supplementary materials provided to ascertain if additional resources or data are available.
14. How can I stay updated on further developments or reports in the Metal Oxide Nanoparticles Market?
To stay informed about further developments, trends, and reports in the Metal Oxide Nanoparticles Market, consider subscribing to industry newsletters, following relevant companies and organizations, or regularly checking reputable industry news sources and publications.
Methodology
Step 1 - Identification of Relevant Samples Size from Population Database


Step 2 - Approaches for Defining Global Market Size (Value, Volume* & Price*)

Note*: In applicable scenarios
Step 3 - Data Sources
Primary Research
- Web Analytics
- Survey Reports
- Research Institute
- Latest Research Reports
- Opinion Leaders
Secondary Research
- Annual Reports
- White Paper
- Latest Press Release
- Industry Association
- Paid Database
- Investor Presentations

Step 4 - Data Triangulation
Involves using different sources of information in order to increase the validity of a study
These sources are likely to be stakeholders in a program - participants, other researchers, program staff, other community members, and so on.
Then we put all data in single framework & apply various statistical tools to find out the dynamic on the market.
During the analysis stage, feedback from the stakeholder groups would be compared to determine areas of agreement as well as areas of divergence


