
Key Insights
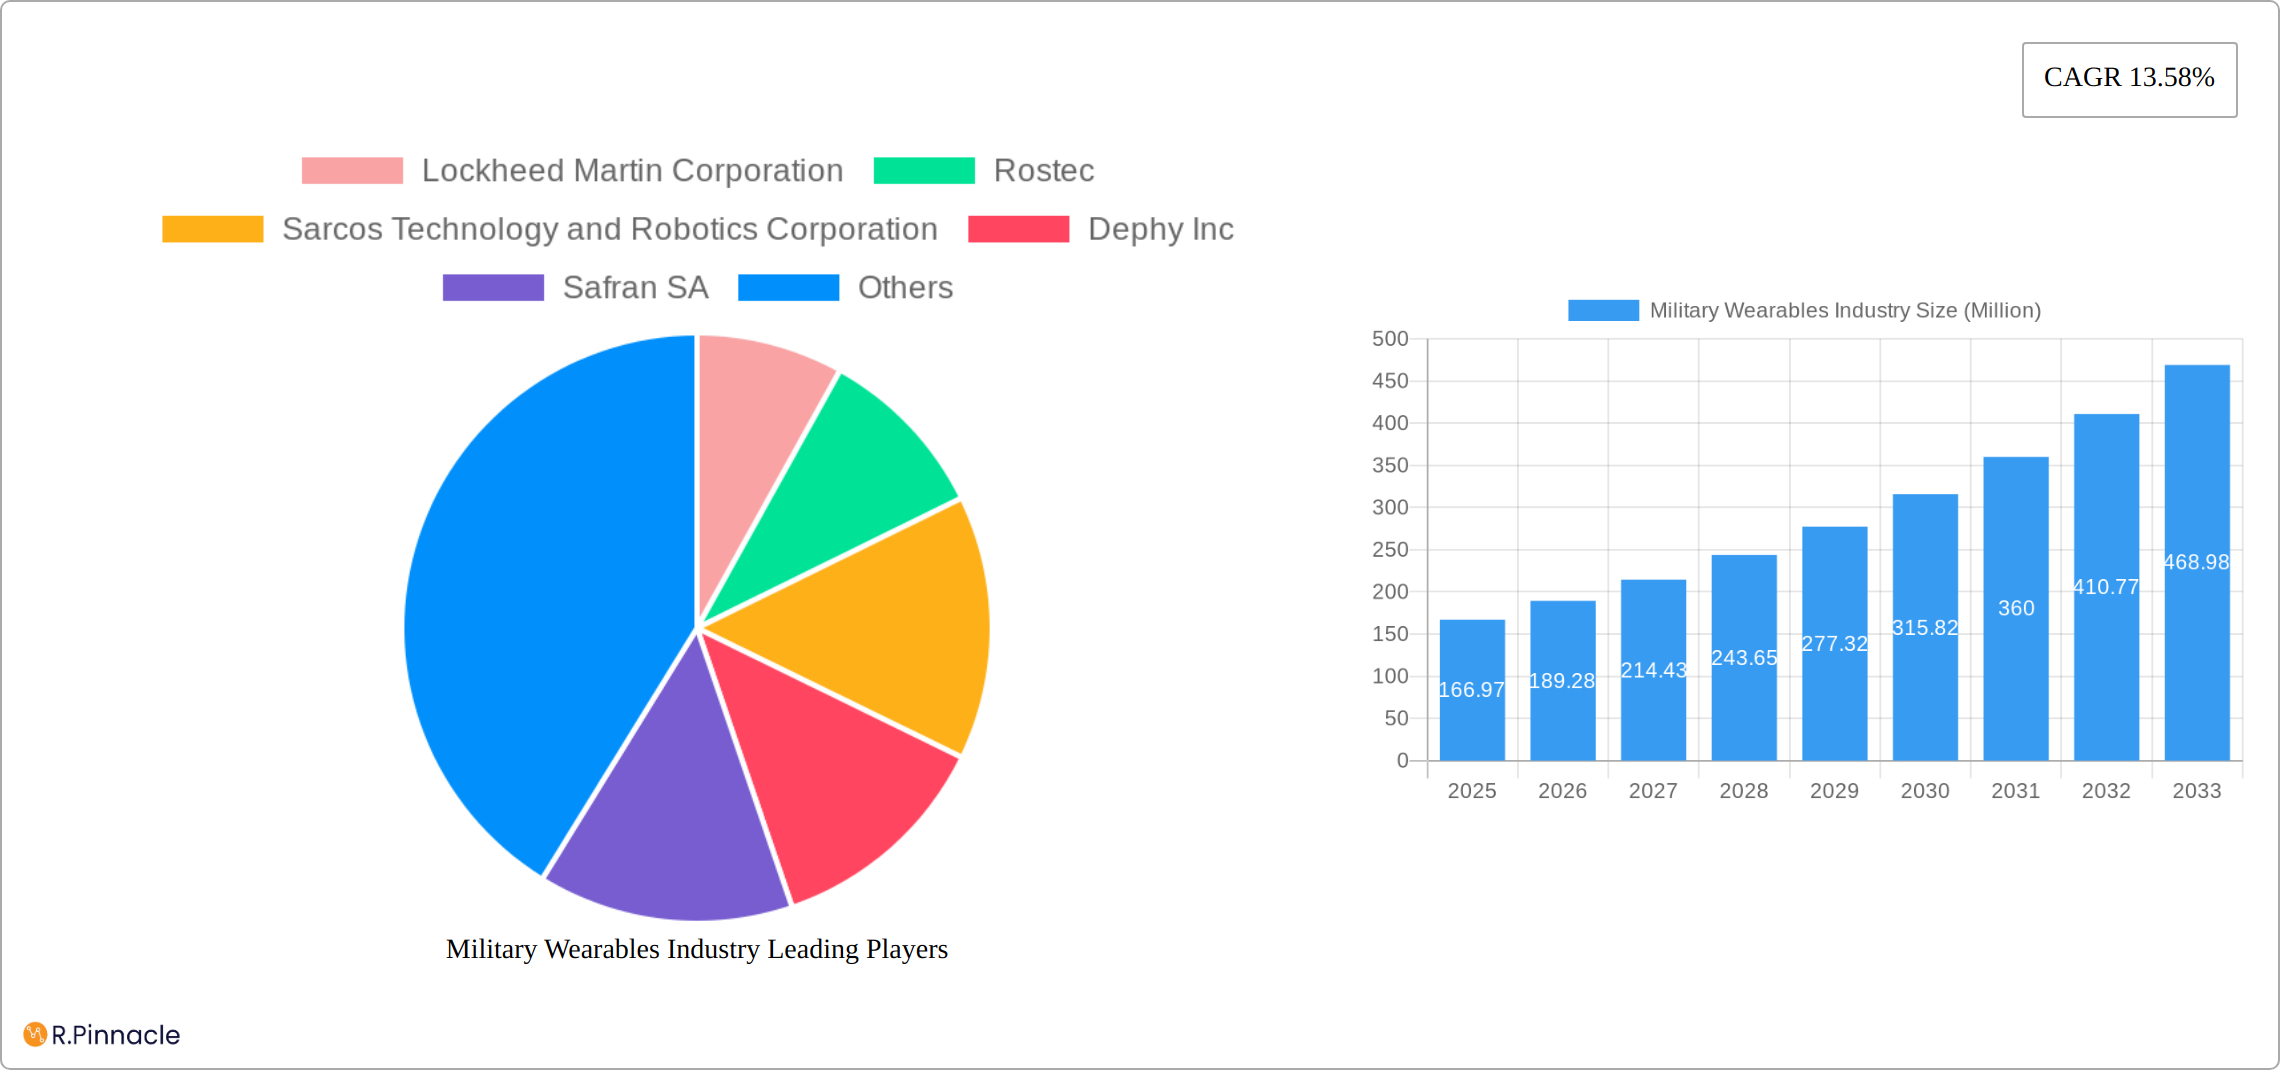
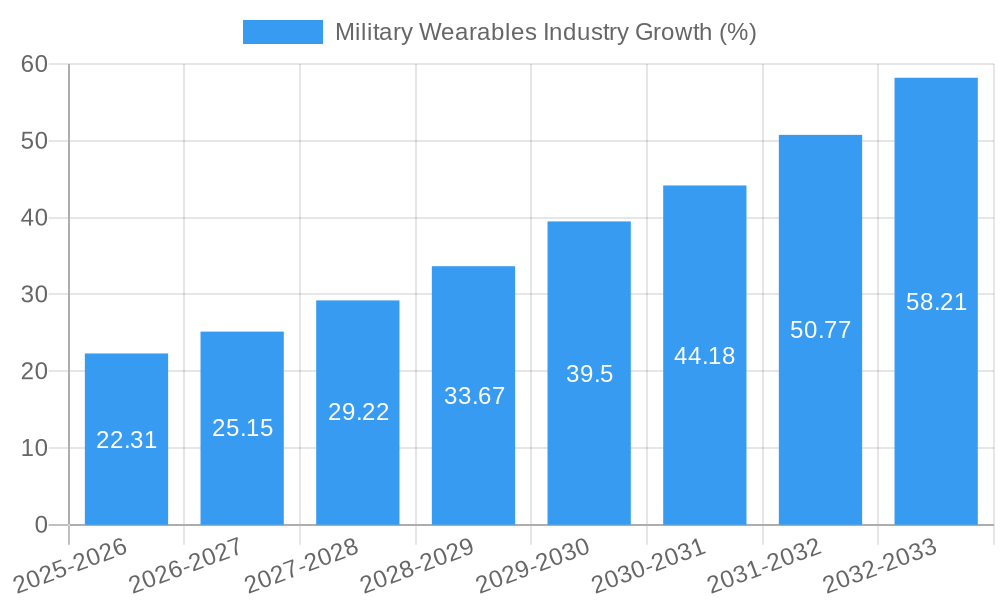
The global military wearables market, valued at $166.97 million in 2025, is projected to experience robust growth, driven by increasing demand for enhanced soldier capabilities and technological advancements. A Compound Annual Growth Rate (CAGR) of 13.58% from 2025 to 2033 indicates a significant expansion, reaching an estimated market size exceeding $600 million by 2033. Key drivers include the need for improved situational awareness, enhanced physical capabilities through exoskeletons (both full-body and partial-body, active and passive), and the integration of advanced communication and sensor technologies. Growing investments in military modernization programs across major global powers, particularly in North America and Asia-Pacific regions, further fuel this growth. Market segmentation reveals a strong preference for active exoskeletons, offering superior power and functionality compared to passive counterparts. The industry is characterized by a mix of established defense contractors like Lockheed Martin and BAE Systems, alongside innovative technology companies such as Sarcos Technology and Robotics, leading to a dynamic competitive landscape.
While the market exhibits significant potential, challenges remain. High initial investment costs associated with developing and deploying advanced military wearables could restrict widespread adoption, particularly among smaller nations with limited defense budgets. Moreover, the need for robust reliability and durability in harsh operational environments necessitates continuous research and development efforts. The integration of various wearable technologies and ensuring seamless interoperability within existing military systems presents additional complexity. However, ongoing innovation in materials science, miniaturization of electronics, and advancements in artificial intelligence are expected to overcome these challenges, further bolstering market growth in the forecast period. The increasing focus on soldier safety and effectiveness will remain a core driver propelling the adoption of these technologies.
Military Wearables Industry Market Report: 2019-2033
This comprehensive report provides a detailed analysis of the Military Wearables Industry, offering invaluable insights for industry professionals, investors, and strategists. The report covers the period 2019-2033, with a focus on the forecast period 2025-2033 and a base year of 2025. We project a market valued at $XX Million in 2025, with a compelling CAGR of XX% driving significant growth through 2033. This report delves into market segmentation, key players, technological advancements, and future opportunities within this rapidly evolving sector.
Military Wearables Industry Market Structure & Innovation Trends
This section delves into the competitive dynamics, innovation catalysts, and regulatory landscape shaping the military wearables market. While market concentration remains moderate, with several key players holding substantial but not dominant shares, the industry exhibits a dynamic interplay of competition and collaboration. Continuous innovation in materials science, power solutions, and sensor technologies is driving significant advancements.
- Market Concentration: Characterized by a moderate level of concentration, with Lockheed Martin Corporation, Rostec, and BAE Systems plc among the leading players. While they collectively hold a significant market share (estimated at XX% in 2025), the market remains open to further competition and disruption.
- Innovation Drivers: Rapid advancements in robotics, artificial intelligence (AI), and materials science are propelling the development of lighter, more durable, and functionally superior exoskeletons and other wearable technologies. Miniaturization of components and enhanced energy efficiency are key focus areas.
- Regulatory Frameworks: Stringent government regulations and rigorous military standards are paramount, influencing product design, testing, and deployment. Meeting these standards is crucial for market entry and acceptance. Compliance and certification processes are often lengthy and demanding.
- Product Substitutes: While direct substitutes are limited, indirect competition arises from traditional load-bearing equipment and assistive devices. The competitive landscape is increasingly influenced by the development of alternative technologies that offer comparable functionalities.
- End-User Demographics: The primary end-users are military personnel across various branches and specializations. However, the potential applications extend to specialized rescue, emergency response, and other high-risk operational environments.
- M&A Activities: The past five years have seen XX significant mergers and acquisitions (M&A) deals, totaling over $XX million. This wave of consolidation reflects strategic efforts by established companies to expand their market reach and technological capabilities, impacting the market's competitive structure.
Military Wearables Industry Market Dynamics & Trends
The military wearables market is experiencing robust growth, driven by increasing defense budgets, a growing demand for enhanced soldier capabilities, and the integration of advanced technologies. Technological disruptions, such as the incorporation of AI and improved sensor integration, are fundamentally changing the capabilities and applications of these systems. Consumer preferences, particularly amongst military personnel, are focused on increased mobility, reduced fatigue, and improved situational awareness. Competitive dynamics are intense, with companies vying for market share through technological innovation, strategic partnerships, and government contracts. The market is expected to grow at a CAGR of XX% during the forecast period, with a projected market penetration rate of XX% by 2033.
Dominant Regions & Segments in Military Wearables Industry
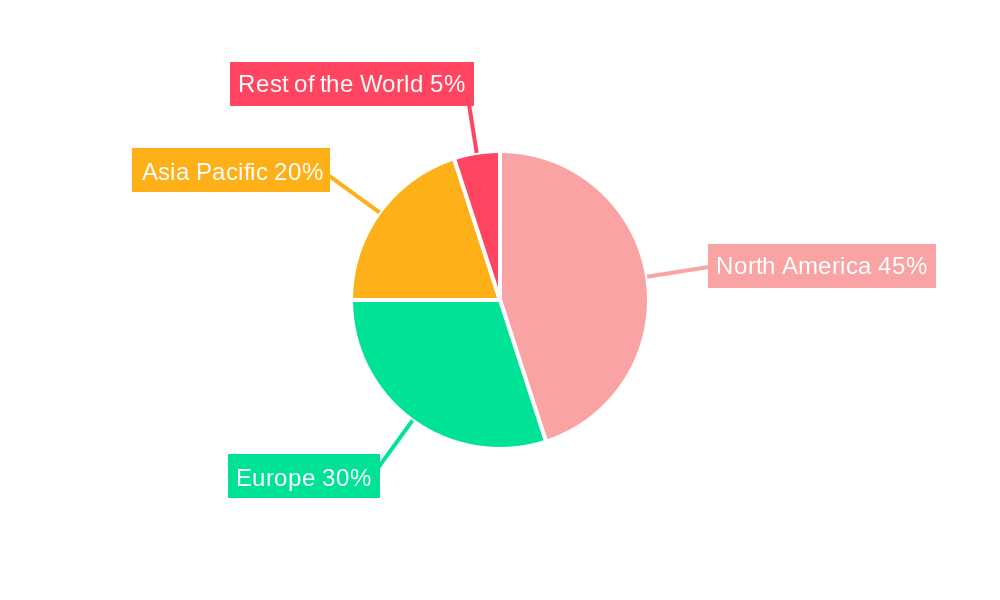
The North American market currently holds the dominant position due to significant defense spending, robust technological capabilities, and the presence of major players. Within segments:
- Type: Full-body exoskeletons are projected to witness higher growth due to their potential to provide comprehensive support and enhance soldier performance. However, partial-body exoskeletons are also gaining traction due to cost-effectiveness and applicability in specialized roles.
- Power: Active exoskeletons are currently dominating the market due to their superior performance and capability but the passive segment is expected to experience significant growth due to increasing focus on cost-effectiveness and reduced reliance on power sources.
Key Drivers:
- North America: High defense expenditure, strong technological infrastructure, and presence of key players.
- Europe: Growing interest in enhancing military capabilities and collaborative research initiatives between nations.
- Asia-Pacific: Increasing defense budgets in several countries, particularly in East Asia, are driving regional growth.
Military Wearables Industry Product Innovations
Recent innovations include advancements in lightweight materials, improved power efficiency, and the integration of advanced sensors and AI-driven algorithms for enhanced situational awareness and human-machine interaction. This leads to more comfortable, more effective, and adaptable exoskeletons for diverse military and emergency response applications.
Report Scope & Segmentation Analysis
This report segments the military wearables market based on type (Full-body Exoskeleton, Partial-body Exoskeleton) and power source (Active Exoskeleton, Passive Exoskeleton). A comprehensive analysis of each segment includes detailed growth projections, market size estimations, and a granular competitive landscape assessment, providing insights into the strengths and weaknesses of various players within each segment.
- Full-body Exoskeletons: This segment exhibits substantial growth potential, driven by its versatility across diverse military operations. However, higher production costs and technological complexity pose challenges.
- Partial-body Exoskeletons: Cost-effectiveness and targeted applications are key advantages, driving growth in niche segments focused on specific operational requirements.
- Active Exoskeletons: This segment currently holds the largest market share due to superior performance capabilities. However, power source management and battery life remain significant technical hurdles.
- Passive Exoskeletons: Gaining traction due to their cost-effectiveness and lower maintenance needs, passive exoskeletons are emerging as a viable option for certain applications.
Key Drivers of Military Wearables Industry Growth
The military wearables market is experiencing robust growth, fueled by several key factors: globally increasing defense budgets, continuous technological advancements that enhance operational capabilities, a rising demand for improved soldier safety and performance, and the urgent need for efficient solutions in rescue and disaster relief operations. These trends collectively contribute to the market's expansion.
Challenges in the Military Wearables Industry Sector
Significant challenges hinder the market's growth trajectory. These include the high costs associated with research, development, and production; the inherent complexity of integrating cutting-edge technologies; the mandatory rigorous testing and certification processes to meet stringent military standards; and the potential vulnerability to supply chain disruptions. These factors could collectively restrain market growth by approximately XX% in the short term.
Emerging Opportunities in Military Wearables Industry
Despite the challenges, the military wearables industry presents exciting opportunities for growth and innovation. Key areas include the integration of advanced sensors and AI to enhance situational awareness on the battlefield; the development of more adaptable and versatile exoskeletons capable of performing a wider range of tasks; and expansion into new markets such as law enforcement and emergency response services. Advancements in materials science and energy-efficient power sources are poised to significantly expand market penetration by XX% over the next decade.
Leading Players in the Military Wearables Industry Market
- Lockheed Martin Corporation
- Rostec
- Sarcos Technology and Robotics Corporation
- Dephy Inc
- Safran SA
- ASELSAN A S
- Mawashi Science & Technology
- SRI International
- BAE Systems plc
- Bionic Power Inc
Key Developments in Military Wearables Industry
- September 2023: NCSIST unveils a new powered exoskeleton suit for wartime and disaster relief.
- August 2022: DEVCOM funds HeroWear and Vanderbilt University to develop the SABER passive exoskeleton for the US Army.
- October 2021: Taiwan unveils a locally made powered exoskeleton suit for military and disaster relief applications.
Future Outlook for Military Wearables Industry Market
The military wearables market is poised for continued growth, driven by technological advancements, increasing defense budgets, and the expanding applications of exoskeletons in various military and emergency response operations. Strategic partnerships and investments in R&D will further propel market expansion and innovation in the coming years.
Military Wearables Industry Segmentation
- 1. Production Analysis
- 2. Consumption Analysis
- 3. Import Market Analysis (Value & Volume)
- 4. Export Market Analysis (Value & Volume)
- 5. Price Trend Analysis
Military Wearables Industry Segmentation By Geography
-
1. North America
- 1.1. United States
- 1.2. Canada
- 1.3. Mexico
-
2. South America
- 2.1. Brazil
- 2.2. Argentina
- 2.3. Rest of South America
-
3. Europe
- 3.1. United Kingdom
- 3.2. Germany
- 3.3. France
- 3.4. Italy
- 3.5. Spain
- 3.6. Russia
- 3.7. Benelux
- 3.8. Nordics
- 3.9. Rest of Europe
-
4. Middle East & Africa
- 4.1. Turkey
- 4.2. Israel
- 4.3. GCC
- 4.4. North Africa
- 4.5. South Africa
- 4.6. Rest of Middle East & Africa
-
5. Asia Pacific
- 5.1. China
- 5.2. India
- 5.3. Japan
- 5.4. South Korea
- 5.5. ASEAN
- 5.6. Oceania
- 5.7. Rest of Asia Pacific
Military Wearables Industry REPORT HIGHLIGHTS
| Aspects | Details |
|---|---|
| Study Period | 2019-2033 |
| Base Year | 2024 |
| Estimated Year | 2025 |
| Forecast Period | 2025-2033 |
| Historical Period | 2019-2024 |
| Growth Rate | CAGR of 13.58% from 2019-2033 |
| Segmentation |
|
Table of Contents
- 1. Introduction
- 1.1. Research Scope
- 1.2. Market Segmentation
- 1.3. Research Methodology
- 1.4. Definitions and Assumptions
- 2. Executive Summary
- 2.1. Introduction
- 3. Market Dynamics
- 3.1. Introduction
- 3.2. Market Drivers
- 3.3. Market Restrains
- 3.4. Market Trends
- 3.4.1. The Active Exoskeleton Segment is Expected to Witness the Highest Growth During the Forecast Period
- 4. Market Factor Analysis
- 4.1. Porters Five Forces
- 4.2. Supply/Value Chain
- 4.3. PESTEL analysis
- 4.4. Market Entropy
- 4.5. Patent/Trademark Analysis
- 5. Global Military Wearables Industry Analysis, Insights and Forecast, 2019-2031
- 5.1. Market Analysis, Insights and Forecast - by Production Analysis
- 5.2. Market Analysis, Insights and Forecast - by Consumption Analysis
- 5.3. Market Analysis, Insights and Forecast - by Import Market Analysis (Value & Volume)
- 5.4. Market Analysis, Insights and Forecast - by Export Market Analysis (Value & Volume)
- 5.5. Market Analysis, Insights and Forecast - by Price Trend Analysis
- 5.6. Market Analysis, Insights and Forecast - by Region
- 5.6.1. North America
- 5.6.2. South America
- 5.6.3. Europe
- 5.6.4. Middle East & Africa
- 5.6.5. Asia Pacific
- 5.1. Market Analysis, Insights and Forecast - by Production Analysis
- 6. North America Military Wearables Industry Analysis, Insights and Forecast, 2019-2031
- 6.1. Market Analysis, Insights and Forecast - by Production Analysis
- 6.2. Market Analysis, Insights and Forecast - by Consumption Analysis
- 6.3. Market Analysis, Insights and Forecast - by Import Market Analysis (Value & Volume)
- 6.4. Market Analysis, Insights and Forecast - by Export Market Analysis (Value & Volume)
- 6.5. Market Analysis, Insights and Forecast - by Price Trend Analysis
- 6.1. Market Analysis, Insights and Forecast - by Production Analysis
- 7. South America Military Wearables Industry Analysis, Insights and Forecast, 2019-2031
- 7.1. Market Analysis, Insights and Forecast - by Production Analysis
- 7.2. Market Analysis, Insights and Forecast - by Consumption Analysis
- 7.3. Market Analysis, Insights and Forecast - by Import Market Analysis (Value & Volume)
- 7.4. Market Analysis, Insights and Forecast - by Export Market Analysis (Value & Volume)
- 7.5. Market Analysis, Insights and Forecast - by Price Trend Analysis
- 7.1. Market Analysis, Insights and Forecast - by Production Analysis
- 8. Europe Military Wearables Industry Analysis, Insights and Forecast, 2019-2031
- 8.1. Market Analysis, Insights and Forecast - by Production Analysis
- 8.2. Market Analysis, Insights and Forecast - by Consumption Analysis
- 8.3. Market Analysis, Insights and Forecast - by Import Market Analysis (Value & Volume)
- 8.4. Market Analysis, Insights and Forecast - by Export Market Analysis (Value & Volume)
- 8.5. Market Analysis, Insights and Forecast - by Price Trend Analysis
- 8.1. Market Analysis, Insights and Forecast - by Production Analysis
- 9. Middle East & Africa Military Wearables Industry Analysis, Insights and Forecast, 2019-2031
- 9.1. Market Analysis, Insights and Forecast - by Production Analysis
- 9.2. Market Analysis, Insights and Forecast - by Consumption Analysis
- 9.3. Market Analysis, Insights and Forecast - by Import Market Analysis (Value & Volume)
- 9.4. Market Analysis, Insights and Forecast - by Export Market Analysis (Value & Volume)
- 9.5. Market Analysis, Insights and Forecast - by Price Trend Analysis
- 9.1. Market Analysis, Insights and Forecast - by Production Analysis
- 10. Asia Pacific Military Wearables Industry Analysis, Insights and Forecast, 2019-2031
- 10.1. Market Analysis, Insights and Forecast - by Production Analysis
- 10.2. Market Analysis, Insights and Forecast - by Consumption Analysis
- 10.3. Market Analysis, Insights and Forecast - by Import Market Analysis (Value & Volume)
- 10.4. Market Analysis, Insights and Forecast - by Export Market Analysis (Value & Volume)
- 10.5. Market Analysis, Insights and Forecast - by Price Trend Analysis
- 10.1. Market Analysis, Insights and Forecast - by Production Analysis
- 11. North America Military Wearables Industry Analysis, Insights and Forecast, 2019-2031
- 11.1. Market Analysis, Insights and Forecast - By Country/Sub-region
- 11.1.1 United States
- 11.1.2 Canada
- 12. Europe Military Wearables Industry Analysis, Insights and Forecast, 2019-2031
- 12.1. Market Analysis, Insights and Forecast - By Country/Sub-region
- 12.1.1 United Kingdom
- 12.1.2 France
- 12.1.3 Germany
- 12.1.4 Russia
- 12.1.5 Rest of Europe
- 13. Asia Pacific Military Wearables Industry Analysis, Insights and Forecast, 2019-2031
- 13.1. Market Analysis, Insights and Forecast - By Country/Sub-region
- 13.1.1 China
- 13.1.2 India
- 13.1.3 Japan
- 13.1.4 South Korea
- 13.1.5 Rest of Asia Pacific
- 14. Rest of the World Military Wearables Industry Analysis, Insights and Forecast, 2019-2031
- 14.1. Market Analysis, Insights and Forecast - By Country/Sub-region
- 14.1.1.
- 15. Competitive Analysis
- 15.1. Global Market Share Analysis 2024
- 15.2. Company Profiles
- 15.2.1 Lockheed Martin Corporation
- 15.2.1.1. Overview
- 15.2.1.2. Products
- 15.2.1.3. SWOT Analysis
- 15.2.1.4. Recent Developments
- 15.2.1.5. Financials (Based on Availability)
- 15.2.2 Rostec
- 15.2.2.1. Overview
- 15.2.2.2. Products
- 15.2.2.3. SWOT Analysis
- 15.2.2.4. Recent Developments
- 15.2.2.5. Financials (Based on Availability)
- 15.2.3 Sarcos Technology and Robotics Corporation
- 15.2.3.1. Overview
- 15.2.3.2. Products
- 15.2.3.3. SWOT Analysis
- 15.2.3.4. Recent Developments
- 15.2.3.5. Financials (Based on Availability)
- 15.2.4 Dephy Inc
- 15.2.4.1. Overview
- 15.2.4.2. Products
- 15.2.4.3. SWOT Analysis
- 15.2.4.4. Recent Developments
- 15.2.4.5. Financials (Based on Availability)
- 15.2.5 Safran SA
- 15.2.5.1. Overview
- 15.2.5.2. Products
- 15.2.5.3. SWOT Analysis
- 15.2.5.4. Recent Developments
- 15.2.5.5. Financials (Based on Availability)
- 15.2.6 ASELSAN A S
- 15.2.6.1. Overview
- 15.2.6.2. Products
- 15.2.6.3. SWOT Analysis
- 15.2.6.4. Recent Developments
- 15.2.6.5. Financials (Based on Availability)
- 15.2.7 Mawashi Science & Technology
- 15.2.7.1. Overview
- 15.2.7.2. Products
- 15.2.7.3. SWOT Analysis
- 15.2.7.4. Recent Developments
- 15.2.7.5. Financials (Based on Availability)
- 15.2.8 SRI Internationa
- 15.2.8.1. Overview
- 15.2.8.2. Products
- 15.2.8.3. SWOT Analysis
- 15.2.8.4. Recent Developments
- 15.2.8.5. Financials (Based on Availability)
- 15.2.9 BAE Systems plc
- 15.2.9.1. Overview
- 15.2.9.2. Products
- 15.2.9.3. SWOT Analysis
- 15.2.9.4. Recent Developments
- 15.2.9.5. Financials (Based on Availability)
- 15.2.10 Bionic Power Inc
- 15.2.10.1. Overview
- 15.2.10.2. Products
- 15.2.10.3. SWOT Analysis
- 15.2.10.4. Recent Developments
- 15.2.10.5. Financials (Based on Availability)
- 15.2.1 Lockheed Martin Corporation
List of Figures
- Figure 1: Global Military Wearables Industry Revenue Breakdown (Million, %) by Region 2024 & 2032
- Figure 2: North America Military Wearables Industry Revenue (Million), by Country 2024 & 2032
- Figure 3: North America Military Wearables Industry Revenue Share (%), by Country 2024 & 2032
- Figure 4: Europe Military Wearables Industry Revenue (Million), by Country 2024 & 2032
- Figure 5: Europe Military Wearables Industry Revenue Share (%), by Country 2024 & 2032
- Figure 6: Asia Pacific Military Wearables Industry Revenue (Million), by Country 2024 & 2032
- Figure 7: Asia Pacific Military Wearables Industry Revenue Share (%), by Country 2024 & 2032
- Figure 8: Rest of the World Military Wearables Industry Revenue (Million), by Country 2024 & 2032
- Figure 9: Rest of the World Military Wearables Industry Revenue Share (%), by Country 2024 & 2032
- Figure 10: North America Military Wearables Industry Revenue (Million), by Production Analysis 2024 & 2032
- Figure 11: North America Military Wearables Industry Revenue Share (%), by Production Analysis 2024 & 2032
- Figure 12: North America Military Wearables Industry Revenue (Million), by Consumption Analysis 2024 & 2032
- Figure 13: North America Military Wearables Industry Revenue Share (%), by Consumption Analysis 2024 & 2032
- Figure 14: North America Military Wearables Industry Revenue (Million), by Import Market Analysis (Value & Volume) 2024 & 2032
- Figure 15: North America Military Wearables Industry Revenue Share (%), by Import Market Analysis (Value & Volume) 2024 & 2032
- Figure 16: North America Military Wearables Industry Revenue (Million), by Export Market Analysis (Value & Volume) 2024 & 2032
- Figure 17: North America Military Wearables Industry Revenue Share (%), by Export Market Analysis (Value & Volume) 2024 & 2032
- Figure 18: North America Military Wearables Industry Revenue (Million), by Price Trend Analysis 2024 & 2032
- Figure 19: North America Military Wearables Industry Revenue Share (%), by Price Trend Analysis 2024 & 2032
- Figure 20: North America Military Wearables Industry Revenue (Million), by Country 2024 & 2032
- Figure 21: North America Military Wearables Industry Revenue Share (%), by Country 2024 & 2032
- Figure 22: South America Military Wearables Industry Revenue (Million), by Production Analysis 2024 & 2032
- Figure 23: South America Military Wearables Industry Revenue Share (%), by Production Analysis 2024 & 2032
- Figure 24: South America Military Wearables Industry Revenue (Million), by Consumption Analysis 2024 & 2032
- Figure 25: South America Military Wearables Industry Revenue Share (%), by Consumption Analysis 2024 & 2032
- Figure 26: South America Military Wearables Industry Revenue (Million), by Import Market Analysis (Value & Volume) 2024 & 2032
- Figure 27: South America Military Wearables Industry Revenue Share (%), by Import Market Analysis (Value & Volume) 2024 & 2032
- Figure 28: South America Military Wearables Industry Revenue (Million), by Export Market Analysis (Value & Volume) 2024 & 2032
- Figure 29: South America Military Wearables Industry Revenue Share (%), by Export Market Analysis (Value & Volume) 2024 & 2032
- Figure 30: South America Military Wearables Industry Revenue (Million), by Price Trend Analysis 2024 & 2032
- Figure 31: South America Military Wearables Industry Revenue Share (%), by Price Trend Analysis 2024 & 2032
- Figure 32: South America Military Wearables Industry Revenue (Million), by Country 2024 & 2032
- Figure 33: South America Military Wearables Industry Revenue Share (%), by Country 2024 & 2032
- Figure 34: Europe Military Wearables Industry Revenue (Million), by Production Analysis 2024 & 2032
- Figure 35: Europe Military Wearables Industry Revenue Share (%), by Production Analysis 2024 & 2032
- Figure 36: Europe Military Wearables Industry Revenue (Million), by Consumption Analysis 2024 & 2032
- Figure 37: Europe Military Wearables Industry Revenue Share (%), by Consumption Analysis 2024 & 2032
- Figure 38: Europe Military Wearables Industry Revenue (Million), by Import Market Analysis (Value & Volume) 2024 & 2032
- Figure 39: Europe Military Wearables Industry Revenue Share (%), by Import Market Analysis (Value & Volume) 2024 & 2032
- Figure 40: Europe Military Wearables Industry Revenue (Million), by Export Market Analysis (Value & Volume) 2024 & 2032
- Figure 41: Europe Military Wearables Industry Revenue Share (%), by Export Market Analysis (Value & Volume) 2024 & 2032
- Figure 42: Europe Military Wearables Industry Revenue (Million), by Price Trend Analysis 2024 & 2032
- Figure 43: Europe Military Wearables Industry Revenue Share (%), by Price Trend Analysis 2024 & 2032
- Figure 44: Europe Military Wearables Industry Revenue (Million), by Country 2024 & 2032
- Figure 45: Europe Military Wearables Industry Revenue Share (%), by Country 2024 & 2032
- Figure 46: Middle East & Africa Military Wearables Industry Revenue (Million), by Production Analysis 2024 & 2032
- Figure 47: Middle East & Africa Military Wearables Industry Revenue Share (%), by Production Analysis 2024 & 2032
- Figure 48: Middle East & Africa Military Wearables Industry Revenue (Million), by Consumption Analysis 2024 & 2032
- Figure 49: Middle East & Africa Military Wearables Industry Revenue Share (%), by Consumption Analysis 2024 & 2032
- Figure 50: Middle East & Africa Military Wearables Industry Revenue (Million), by Import Market Analysis (Value & Volume) 2024 & 2032
- Figure 51: Middle East & Africa Military Wearables Industry Revenue Share (%), by Import Market Analysis (Value & Volume) 2024 & 2032
- Figure 52: Middle East & Africa Military Wearables Industry Revenue (Million), by Export Market Analysis (Value & Volume) 2024 & 2032
- Figure 53: Middle East & Africa Military Wearables Industry Revenue Share (%), by Export Market Analysis (Value & Volume) 2024 & 2032
- Figure 54: Middle East & Africa Military Wearables Industry Revenue (Million), by Price Trend Analysis 2024 & 2032
- Figure 55: Middle East & Africa Military Wearables Industry Revenue Share (%), by Price Trend Analysis 2024 & 2032
- Figure 56: Middle East & Africa Military Wearables Industry Revenue (Million), by Country 2024 & 2032
- Figure 57: Middle East & Africa Military Wearables Industry Revenue Share (%), by Country 2024 & 2032
- Figure 58: Asia Pacific Military Wearables Industry Revenue (Million), by Production Analysis 2024 & 2032
- Figure 59: Asia Pacific Military Wearables Industry Revenue Share (%), by Production Analysis 2024 & 2032
- Figure 60: Asia Pacific Military Wearables Industry Revenue (Million), by Consumption Analysis 2024 & 2032
- Figure 61: Asia Pacific Military Wearables Industry Revenue Share (%), by Consumption Analysis 2024 & 2032
- Figure 62: Asia Pacific Military Wearables Industry Revenue (Million), by Import Market Analysis (Value & Volume) 2024 & 2032
- Figure 63: Asia Pacific Military Wearables Industry Revenue Share (%), by Import Market Analysis (Value & Volume) 2024 & 2032
- Figure 64: Asia Pacific Military Wearables Industry Revenue (Million), by Export Market Analysis (Value & Volume) 2024 & 2032
- Figure 65: Asia Pacific Military Wearables Industry Revenue Share (%), by Export Market Analysis (Value & Volume) 2024 & 2032
- Figure 66: Asia Pacific Military Wearables Industry Revenue (Million), by Price Trend Analysis 2024 & 2032
- Figure 67: Asia Pacific Military Wearables Industry Revenue Share (%), by Price Trend Analysis 2024 & 2032
- Figure 68: Asia Pacific Military Wearables Industry Revenue (Million), by Country 2024 & 2032
- Figure 69: Asia Pacific Military Wearables Industry Revenue Share (%), by Country 2024 & 2032
List of Tables
- Table 1: Global Military Wearables Industry Revenue Million Forecast, by Region 2019 & 2032
- Table 2: Global Military Wearables Industry Revenue Million Forecast, by Production Analysis 2019 & 2032
- Table 3: Global Military Wearables Industry Revenue Million Forecast, by Consumption Analysis 2019 & 2032
- Table 4: Global Military Wearables Industry Revenue Million Forecast, by Import Market Analysis (Value & Volume) 2019 & 2032
- Table 5: Global Military Wearables Industry Revenue Million Forecast, by Export Market Analysis (Value & Volume) 2019 & 2032
- Table 6: Global Military Wearables Industry Revenue Million Forecast, by Price Trend Analysis 2019 & 2032
- Table 7: Global Military Wearables Industry Revenue Million Forecast, by Region 2019 & 2032
- Table 8: Global Military Wearables Industry Revenue Million Forecast, by Country 2019 & 2032
- Table 9: United States Military Wearables Industry Revenue (Million) Forecast, by Application 2019 & 2032
- Table 10: Canada Military Wearables Industry Revenue (Million) Forecast, by Application 2019 & 2032
- Table 11: Global Military Wearables Industry Revenue Million Forecast, by Country 2019 & 2032
- Table 12: United Kingdom Military Wearables Industry Revenue (Million) Forecast, by Application 2019 & 2032
- Table 13: France Military Wearables Industry Revenue (Million) Forecast, by Application 2019 & 2032
- Table 14: Germany Military Wearables Industry Revenue (Million) Forecast, by Application 2019 & 2032
- Table 15: Russia Military Wearables Industry Revenue (Million) Forecast, by Application 2019 & 2032
- Table 16: Rest of Europe Military Wearables Industry Revenue (Million) Forecast, by Application 2019 & 2032
- Table 17: Global Military Wearables Industry Revenue Million Forecast, by Country 2019 & 2032
- Table 18: China Military Wearables Industry Revenue (Million) Forecast, by Application 2019 & 2032
- Table 19: India Military Wearables Industry Revenue (Million) Forecast, by Application 2019 & 2032
- Table 20: Japan Military Wearables Industry Revenue (Million) Forecast, by Application 2019 & 2032
- Table 21: South Korea Military Wearables Industry Revenue (Million) Forecast, by Application 2019 & 2032
- Table 22: Rest of Asia Pacific Military Wearables Industry Revenue (Million) Forecast, by Application 2019 & 2032
- Table 23: Global Military Wearables Industry Revenue Million Forecast, by Country 2019 & 2032
- Table 24: Military Wearables Industry Revenue (Million) Forecast, by Application 2019 & 2032
- Table 25: Global Military Wearables Industry Revenue Million Forecast, by Production Analysis 2019 & 2032
- Table 26: Global Military Wearables Industry Revenue Million Forecast, by Consumption Analysis 2019 & 2032
- Table 27: Global Military Wearables Industry Revenue Million Forecast, by Import Market Analysis (Value & Volume) 2019 & 2032
- Table 28: Global Military Wearables Industry Revenue Million Forecast, by Export Market Analysis (Value & Volume) 2019 & 2032
- Table 29: Global Military Wearables Industry Revenue Million Forecast, by Price Trend Analysis 2019 & 2032
- Table 30: Global Military Wearables Industry Revenue Million Forecast, by Country 2019 & 2032
- Table 31: United States Military Wearables Industry Revenue (Million) Forecast, by Application 2019 & 2032
- Table 32: Canada Military Wearables Industry Revenue (Million) Forecast, by Application 2019 & 2032
- Table 33: Mexico Military Wearables Industry Revenue (Million) Forecast, by Application 2019 & 2032
- Table 34: Global Military Wearables Industry Revenue Million Forecast, by Production Analysis 2019 & 2032
- Table 35: Global Military Wearables Industry Revenue Million Forecast, by Consumption Analysis 2019 & 2032
- Table 36: Global Military Wearables Industry Revenue Million Forecast, by Import Market Analysis (Value & Volume) 2019 & 2032
- Table 37: Global Military Wearables Industry Revenue Million Forecast, by Export Market Analysis (Value & Volume) 2019 & 2032
- Table 38: Global Military Wearables Industry Revenue Million Forecast, by Price Trend Analysis 2019 & 2032
- Table 39: Global Military Wearables Industry Revenue Million Forecast, by Country 2019 & 2032
- Table 40: Brazil Military Wearables Industry Revenue (Million) Forecast, by Application 2019 & 2032
- Table 41: Argentina Military Wearables Industry Revenue (Million) Forecast, by Application 2019 & 2032
- Table 42: Rest of South America Military Wearables Industry Revenue (Million) Forecast, by Application 2019 & 2032
- Table 43: Global Military Wearables Industry Revenue Million Forecast, by Production Analysis 2019 & 2032
- Table 44: Global Military Wearables Industry Revenue Million Forecast, by Consumption Analysis 2019 & 2032
- Table 45: Global Military Wearables Industry Revenue Million Forecast, by Import Market Analysis (Value & Volume) 2019 & 2032
- Table 46: Global Military Wearables Industry Revenue Million Forecast, by Export Market Analysis (Value & Volume) 2019 & 2032
- Table 47: Global Military Wearables Industry Revenue Million Forecast, by Price Trend Analysis 2019 & 2032
- Table 48: Global Military Wearables Industry Revenue Million Forecast, by Country 2019 & 2032
- Table 49: United Kingdom Military Wearables Industry Revenue (Million) Forecast, by Application 2019 & 2032
- Table 50: Germany Military Wearables Industry Revenue (Million) Forecast, by Application 2019 & 2032
- Table 51: France Military Wearables Industry Revenue (Million) Forecast, by Application 2019 & 2032
- Table 52: Italy Military Wearables Industry Revenue (Million) Forecast, by Application 2019 & 2032
- Table 53: Spain Military Wearables Industry Revenue (Million) Forecast, by Application 2019 & 2032
- Table 54: Russia Military Wearables Industry Revenue (Million) Forecast, by Application 2019 & 2032
- Table 55: Benelux Military Wearables Industry Revenue (Million) Forecast, by Application 2019 & 2032
- Table 56: Nordics Military Wearables Industry Revenue (Million) Forecast, by Application 2019 & 2032
- Table 57: Rest of Europe Military Wearables Industry Revenue (Million) Forecast, by Application 2019 & 2032
- Table 58: Global Military Wearables Industry Revenue Million Forecast, by Production Analysis 2019 & 2032
- Table 59: Global Military Wearables Industry Revenue Million Forecast, by Consumption Analysis 2019 & 2032
- Table 60: Global Military Wearables Industry Revenue Million Forecast, by Import Market Analysis (Value & Volume) 2019 & 2032
- Table 61: Global Military Wearables Industry Revenue Million Forecast, by Export Market Analysis (Value & Volume) 2019 & 2032
- Table 62: Global Military Wearables Industry Revenue Million Forecast, by Price Trend Analysis 2019 & 2032
- Table 63: Global Military Wearables Industry Revenue Million Forecast, by Country 2019 & 2032
- Table 64: Turkey Military Wearables Industry Revenue (Million) Forecast, by Application 2019 & 2032
- Table 65: Israel Military Wearables Industry Revenue (Million) Forecast, by Application 2019 & 2032
- Table 66: GCC Military Wearables Industry Revenue (Million) Forecast, by Application 2019 & 2032
- Table 67: North Africa Military Wearables Industry Revenue (Million) Forecast, by Application 2019 & 2032
- Table 68: South Africa Military Wearables Industry Revenue (Million) Forecast, by Application 2019 & 2032
- Table 69: Rest of Middle East & Africa Military Wearables Industry Revenue (Million) Forecast, by Application 2019 & 2032
- Table 70: Global Military Wearables Industry Revenue Million Forecast, by Production Analysis 2019 & 2032
- Table 71: Global Military Wearables Industry Revenue Million Forecast, by Consumption Analysis 2019 & 2032
- Table 72: Global Military Wearables Industry Revenue Million Forecast, by Import Market Analysis (Value & Volume) 2019 & 2032
- Table 73: Global Military Wearables Industry Revenue Million Forecast, by Export Market Analysis (Value & Volume) 2019 & 2032
- Table 74: Global Military Wearables Industry Revenue Million Forecast, by Price Trend Analysis 2019 & 2032
- Table 75: Global Military Wearables Industry Revenue Million Forecast, by Country 2019 & 2032
- Table 76: China Military Wearables Industry Revenue (Million) Forecast, by Application 2019 & 2032
- Table 77: India Military Wearables Industry Revenue (Million) Forecast, by Application 2019 & 2032
- Table 78: Japan Military Wearables Industry Revenue (Million) Forecast, by Application 2019 & 2032
- Table 79: South Korea Military Wearables Industry Revenue (Million) Forecast, by Application 2019 & 2032
- Table 80: ASEAN Military Wearables Industry Revenue (Million) Forecast, by Application 2019 & 2032
- Table 81: Oceania Military Wearables Industry Revenue (Million) Forecast, by Application 2019 & 2032
- Table 82: Rest of Asia Pacific Military Wearables Industry Revenue (Million) Forecast, by Application 2019 & 2032
Frequently Asked Questions
1. What is the projected Compound Annual Growth Rate (CAGR) of the Military Wearables Industry?
The projected CAGR is approximately 13.58%.
2. Which companies are prominent players in the Military Wearables Industry?
Key companies in the market include Lockheed Martin Corporation, Rostec, Sarcos Technology and Robotics Corporation, Dephy Inc, Safran SA, ASELSAN A S, Mawashi Science & Technology, SRI Internationa, BAE Systems plc, Bionic Power Inc.
3. What are the main segments of the Military Wearables Industry?
The market segments include Production Analysis, Consumption Analysis, Import Market Analysis (Value & Volume), Export Market Analysis (Value & Volume), Price Trend Analysis.
4. Can you provide details about the market size?
The market size is estimated to be USD 166.97 Million as of 2022.
5. What are some drivers contributing to market growth?
N/A
6. What are the notable trends driving market growth?
The Active Exoskeleton Segment is Expected to Witness the Highest Growth During the Forecast Period.
7. Are there any restraints impacting market growth?
N/A
8. Can you provide examples of recent developments in the market?
September 2023: The National Chung-Shan Institute of Science and Technology (NCSIST) unveiled the latest version of its in-development locally-made powered exoskeleton suit, which is a mechanized wearable system designed to be used in wartime or during post-disaster rescue and relief missions. The exoskeleton delivers the right torque at the right time to assist knee flexion and extension to reduce the energy wearers expend when crossing terrain, squatting, or kneeling, and to increase mobility and reduce fatigue.
9. What pricing options are available for accessing the report?
Pricing options include single-user, multi-user, and enterprise licenses priced at USD 4750, USD 5250, and USD 8750 respectively.
10. Is the market size provided in terms of value or volume?
The market size is provided in terms of value, measured in Million.
11. Are there any specific market keywords associated with the report?
Yes, the market keyword associated with the report is "Military Wearables Industry," which aids in identifying and referencing the specific market segment covered.
12. How do I determine which pricing option suits my needs best?
The pricing options vary based on user requirements and access needs. Individual users may opt for single-user licenses, while businesses requiring broader access may choose multi-user or enterprise licenses for cost-effective access to the report.
13. Are there any additional resources or data provided in the Military Wearables Industry report?
While the report offers comprehensive insights, it's advisable to review the specific contents or supplementary materials provided to ascertain if additional resources or data are available.
14. How can I stay updated on further developments or reports in the Military Wearables Industry?
To stay informed about further developments, trends, and reports in the Military Wearables Industry, consider subscribing to industry newsletters, following relevant companies and organizations, or regularly checking reputable industry news sources and publications.
Methodology
Step 1 - Identification of Relevant Samples Size from Population Database


Step 2 - Approaches for Defining Global Market Size (Value, Volume* & Price*)

Note*: In applicable scenarios
Step 3 - Data Sources
Primary Research
- Web Analytics
- Survey Reports
- Research Institute
- Latest Research Reports
- Opinion Leaders
Secondary Research
- Annual Reports
- White Paper
- Latest Press Release
- Industry Association
- Paid Database
- Investor Presentations

Step 4 - Data Triangulation
Involves using different sources of information in order to increase the validity of a study
These sources are likely to be stakeholders in a program - participants, other researchers, program staff, other community members, and so on.
Then we put all data in single framework & apply various statistical tools to find out the dynamic on the market.
During the analysis stage, feedback from the stakeholder groups would be compared to determine areas of agreement as well as areas of divergence


