
Key Insights
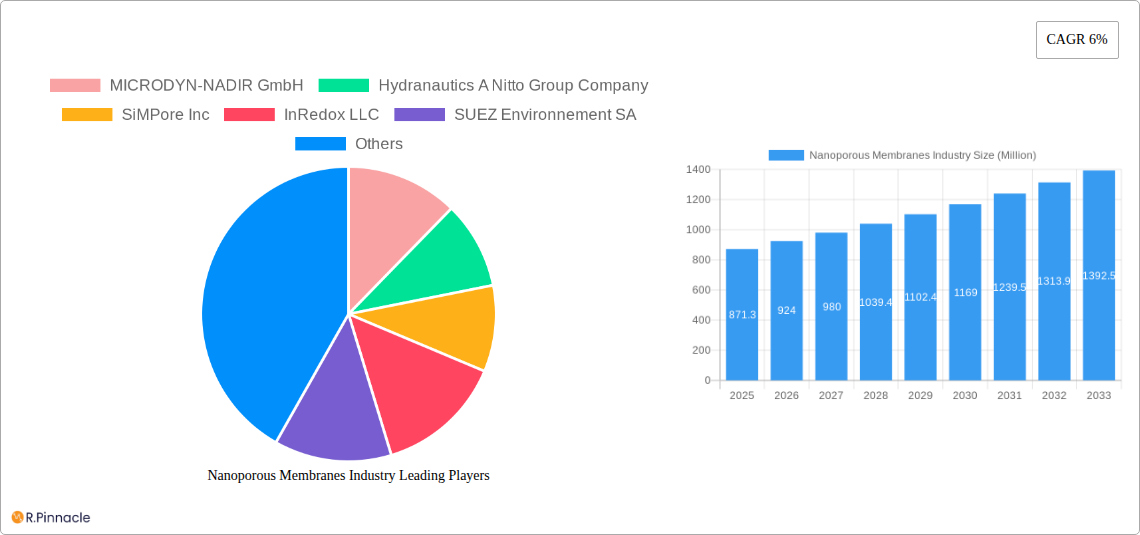
The nanoporous membranes market, valued at $871.3 million in 2025, is projected to experience robust growth, driven by increasing demand across diverse applications. A compound annual growth rate (CAGR) of 6% from 2025 to 2033 indicates a significant market expansion. Key drivers include the rising need for advanced water purification solutions in both developed and developing nations, the burgeoning fuel cell industry seeking efficient and durable membrane technologies, and the growing biomedical sector utilizing nanoporous membranes for drug delivery and diagnostics. Furthermore, advancements in materials science, leading to the development of more efficient and cost-effective organic, inorganic (including ceramics, carbon nanotubes, and graphene), and hybrid membranes, are fueling market expansion. The segmentation by material type and application reveals significant opportunities within water treatment (a dominant segment due to increasing water scarcity and pollution concerns), fuel cells (driven by the clean energy transition), and biomedical applications (spurred by technological advancements in personalized medicine). While regulatory hurdles and the high initial investment costs associated with some advanced membrane technologies may pose challenges, the overall market trajectory remains positive, fueled by innovation and growing demand across various sectors.
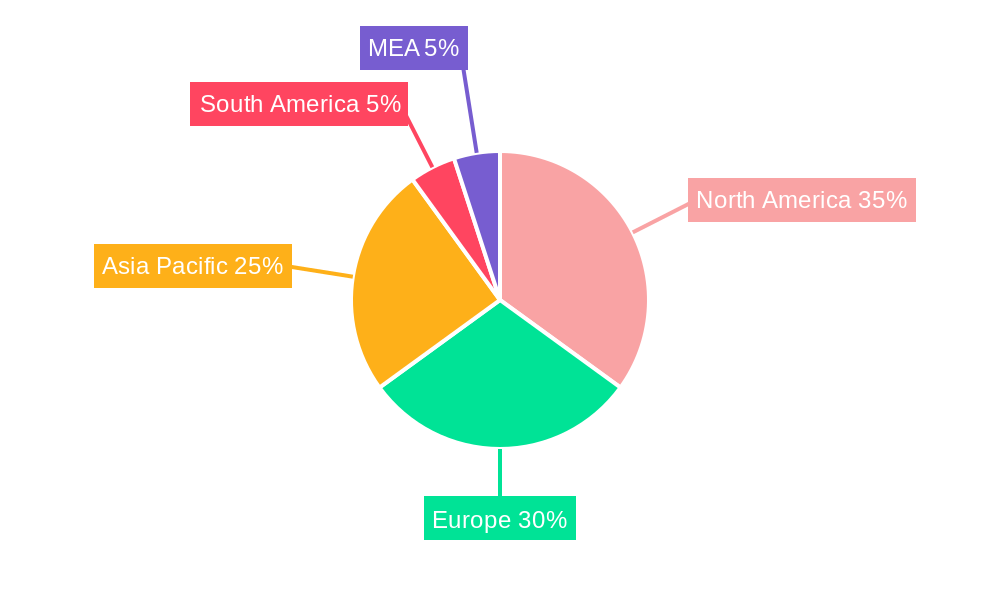
The competitive landscape is characterized by a mix of established multinational corporations and specialized smaller companies. Key players like Microdyn-Nadir, Hydranautics, and others are actively involved in research and development, focusing on improving membrane performance, durability, and cost-effectiveness. Geographic distribution indicates strong market presence in North America and Europe, fueled by early adoption and well-established infrastructure. However, the Asia-Pacific region is expected to exhibit significant growth in the coming years, driven by rapid industrialization and increasing investments in water and energy infrastructure. The continuous development of novel materials, improved manufacturing processes, and strategic partnerships will play a crucial role in shaping the market dynamics and driving future growth in the nanoporous membranes industry. The forecast period (2025-2033) promises substantial market expansion, highlighting the immense potential of this technology across multiple sectors.
Nanoporous Membranes Industry: A Comprehensive Market Report (2019-2033)
This in-depth report provides a comprehensive analysis of the global nanoporous membranes industry, offering valuable insights for industry professionals, investors, and researchers. The study period covers 2019-2033, with a base year of 2025 and a forecast period of 2025-2033. The report leverages extensive market research to deliver actionable intelligence and growth projections, valuing the market in Millions.
Nanoporous Membranes Industry Market Structure & Innovation Trends
This section analyzes the competitive landscape of the nanoporous membranes market, encompassing market concentration, innovation drivers, regulatory impacts, and industry dynamics. The report examines market share distribution among key players like MICRODYN-NADIR GmbH, Hydranautics, SiMPore Inc, and others, revealing the level of market consolidation. Innovation is explored through advancements in material science (organic, inorganic, hybrid) and manufacturing processes, along with their impact on product performance and cost-effectiveness. Regulatory frameworks, including environmental regulations and safety standards, are analyzed for their influence on market growth and company strategies. The report also quantifies the impact of mergers and acquisitions (M&A) activity, including deal values (in Millions) and their effect on market structure. Finally, the report assesses the prevalence of product substitutes and their potential to disrupt the market. For example, the increasing use of alternative filtration technologies may affect market growth. The report details the demographic factors influencing demand across various end-user segments.
Nanoporous Membranes Industry Market Dynamics & Trends
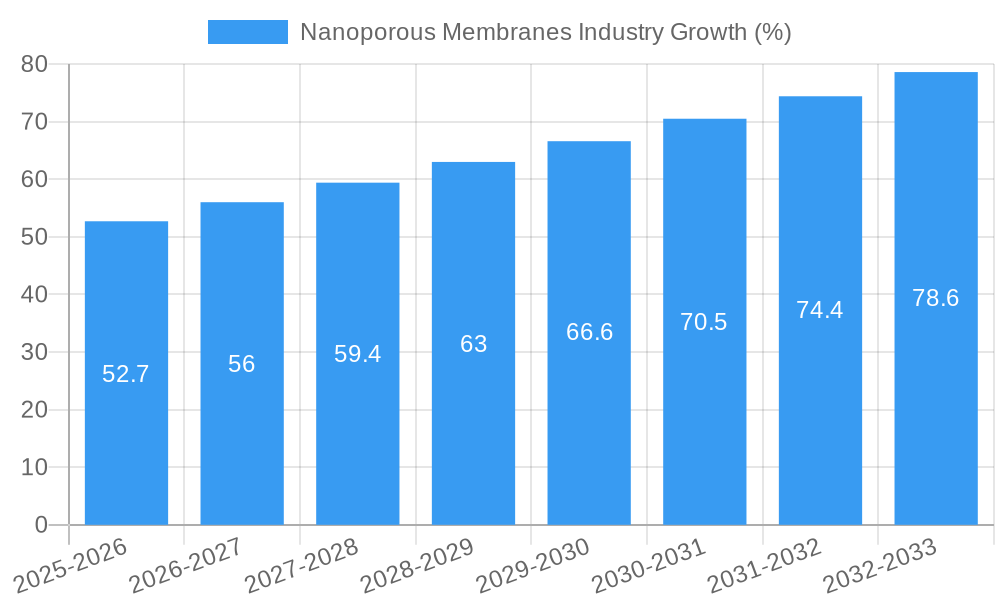
This section delves into the market's growth trajectory and influencing factors. We present a detailed analysis of the Compound Annual Growth Rate (CAGR) for the forecast period (2025-2033), projecting a xx% growth. Market penetration rates for different application segments (Water Treatment, Fuel Cells, Biomedical, Food Processing, Other Applications) are also calculated. The analysis focuses on growth drivers, including increasing demand from water treatment applications, the burgeoning fuel cell industry, and advances in medical technologies. Technological disruptions, such as the development of new membrane materials and fabrication techniques, are assessed for their impact on market dynamics. Evolving consumer preferences, including a growing focus on sustainability and environmental responsibility, are also explored. The competitive dynamics, including pricing strategies, product differentiation, and technological leadership, are analyzed to identify key trends shaping the industry landscape. The report includes an assessment of the market's response to macroeconomic factors like global economic growth and fluctuations in raw material prices.
Dominant Regions & Segments in Nanoporous Membranes Industry
This section identifies the leading regions and segments within the nanoporous membranes market. The report analyzes regional dominance, pinpointing key countries driving market growth based on factors such as economic policies promoting clean technologies, infrastructure development for water treatment facilities, and government support for research and development. Detailed analysis is presented for each segment (Material Type: Organic, Inorganic (Ceramics, Carbon Nanotubes, and Graphene), Hybrid; Application: Water Treatment, Fuel Cells, Biomedical, Food Processing, Other Applications).
- Dominant Region: [Region Name, e.g., North America]
- Key Drivers for Dominant Region:
- Robust government investment in water treatment infrastructure.
- Strong presence of major industry players.
- Favorable economic conditions stimulating industrial growth.
- Dominant Material Type: [Material Type, e.g., Organic]
- Key Drivers for Dominant Material Type:
- Cost-effectiveness.
- Ease of manufacturing.
- Superior performance characteristics for specific applications.
- Dominant Application: [Application, e.g., Water Treatment]
- Key Drivers for Dominant Application:
- Increasing global water scarcity and stringent water quality regulations.
- Growing investments in desalination and wastewater treatment plants.
Nanoporous Membranes Industry Product Innovations
The nanoporous membranes industry is witnessing rapid innovation, driven by advancements in materials science and nanotechnology. Recent product developments include the introduction of membranes with enhanced selectivity, permeability, and fouling resistance. These innovations cater to the evolving needs of various applications, including water purification, gas separation, and biomedical diagnostics. Companies are focusing on developing membranes with improved mechanical strength and durability to extend their lifespan and reduce maintenance costs. The competitive landscape is shaped by the continuous introduction of novel membrane materials and fabrication techniques.
Report Scope & Segmentation Analysis
This report comprehensively segments the nanoporous membranes market by material type (Organic, Inorganic – Ceramics, Carbon Nanotubes, and Graphene, Hybrid) and application (Water Treatment, Fuel Cells, Biomedical, Food Processing, Other Applications). Each segment’s growth projections, market size (in Millions), and competitive dynamics are analyzed. The report forecasts significant growth in the water treatment and biomedical applications segments, driven by increasing demand for clean water and advanced medical technologies. The inorganic segment, specifically carbon nanotubes and graphene, shows promise due to their exceptional properties. Competition within each segment is analyzed, highlighting key players and their market strategies.
Key Drivers of Nanoporous Membranes Industry Growth
The nanoporous membranes market is fueled by several key factors. Stringent environmental regulations promoting water conservation and pollution control are driving demand for advanced water treatment technologies. The growth of the fuel cell industry is increasing the need for high-performance membranes for gas separation. The increasing prevalence of chronic diseases is driving growth in the biomedical applications segment, specifically for drug delivery and diagnostics. Moreover, advancements in nanotechnology and materials science are enabling the development of membranes with superior properties, leading to broader adoption across various industries.
Challenges in the Nanoporous Membranes Industry Sector
The nanoporous membranes industry faces several challenges. High manufacturing costs and complex fabrication processes can limit market penetration. Supply chain disruptions can impact the availability of raw materials, impacting production and pricing. Intense competition among established players and emerging companies can exert downward pressure on profit margins. Additionally, regulatory hurdles and stringent environmental compliance requirements can increase operational costs and complexity. The industry faces the challenge of ensuring the long-term stability and performance of membranes under various operating conditions.
Emerging Opportunities in Nanoporous Membranes Industry
The nanoporous membranes market presents several compelling opportunities. The growing demand for clean energy solutions is driving interest in fuel cell applications. Advances in nanomaterials and fabrication techniques are opening new possibilities for creating high-performance membranes for gas separation and water purification. The healthcare sector presents significant potential for the use of nanoporous membranes in drug delivery systems and advanced diagnostic tools. Exploration of novel applications, such as sensors and catalysts, will unlock further growth opportunities. The increasing adoption of sustainable manufacturing practices and environmentally friendly materials will further enhance market prospects.
Leading Players in the Nanoporous Membranes Industry Market
- MICRODYN-NADIR GmbH
- Hydranautics A Nitto Group Company
- SiMPore Inc
- InRedox LLC
- SUEZ Environnement SA
- Osmotech Membranes Pvt Ltd
- Hunan Keensen Technology Co Ltd
- Synder Filtration Inc
- AXEON Water Technologies Inc
- inopor GmbH
- BASF SE
- Toray Chemical Korea Inc
- DowDuPont Inc
- Koch Membrane Systems Inc
- SmartMembranes GmbH
- Applied Membranes Inc
- Alfa Laval AB
- Pure-Pro Water Corporation
Key Developments in Nanoporous Membranes Industry
- [Month, Year]: [Company Name] launched a new line of nanoporous membranes with enhanced selectivity for water purification.
- [Month, Year]: [Company Name] announced a strategic partnership with [Company Name] to develop advanced membranes for fuel cell applications.
- [Month, Year]: [Company Name] acquired [Company Name], expanding its market share in the biomedical segment.
- [Month, Year]: Significant advancements in graphene-based membranes were reported, improving performance significantly.
Future Outlook for Nanoporous Membranes Industry Market
The future of the nanoporous membranes market is bright, driven by sustained growth across key application segments. Continued technological advancements, coupled with increasing environmental awareness and stringent regulatory policies, will further propel market expansion. Strategic partnerships, mergers and acquisitions, and increased R&D investments are expected to shape the competitive landscape. The rising demand for clean water and sustainable energy solutions will create significant opportunities for innovation and market penetration. The market is expected to witness substantial growth in the coming years, with continued expansion across diverse industries.
Nanoporous Membranes Industry Segmentation
-
1. Material Type
- 1.1. Organic
- 1.2. Inorgani
- 1.3. Hybrid
-
2. Application
- 2.1. Water Treatment
- 2.2. Fuel Cells
- 2.3. Biomedical
- 2.4. Food Processing
- 2.5. Other Applications
Nanoporous Membranes Industry Segmentation By Geography
-
1. Asia Pacific
- 1.1. China
- 1.2. India
- 1.3. Japan
- 1.4. South Korea
- 1.5. ASEAN Countries
- 1.6. Rest of Asia Pacific
-
2. North America
- 2.1. United States
- 2.2. Canada
- 2.3. Rest of North America
-
3. Europe
- 3.1. Germany
- 3.2. United Kingdom
- 3.3. Italy
- 3.4. France
- 3.5. Spain
- 3.6. Rest of Europe
-
4. South America
- 4.1. Brazil
- 4.2. Argentina
- 4.3. Rest of South America
- 5. Middle East
-
6. Saudi Arabia
- 6.1. South Africa
- 6.2. Rest of Middle East
Nanoporous Membranes Industry REPORT HIGHLIGHTS
| Aspects | Details |
|---|---|
| Study Period | 2019-2033 |
| Base Year | 2024 |
| Estimated Year | 2025 |
| Forecast Period | 2025-2033 |
| Historical Period | 2019-2024 |
| Growth Rate | CAGR of 6% from 2019-2033 |
| Segmentation |
|
Table of Contents
- 1. Introduction
- 1.1. Research Scope
- 1.2. Market Segmentation
- 1.3. Research Methodology
- 1.4. Definitions and Assumptions
- 2. Executive Summary
- 2.1. Introduction
- 3. Market Dynamics
- 3.1. Introduction
- 3.2. Market Drivers
- 3.2.1. ; Growing Need to Treat Wastewater; Rising Water Desalination Activities
- 3.3. Market Restrains
- 3.3.1. ; Low Adoption in the Developing Countries; Poor Fouling Resistance of Nanoporous Membranes; Supply Deficiency of Nanomaterials
- 3.4. Market Trends
- 3.4.1. Growing Demand from Water Treatment Application
- 4. Market Factor Analysis
- 4.1. Porters Five Forces
- 4.2. Supply/Value Chain
- 4.3. PESTEL analysis
- 4.4. Market Entropy
- 4.5. Patent/Trademark Analysis
- 5. Global Nanoporous Membranes Industry Analysis, Insights and Forecast, 2019-2031
- 5.1. Market Analysis, Insights and Forecast - by Material Type
- 5.1.1. Organic
- 5.1.2. Inorgani
- 5.1.3. Hybrid
- 5.2. Market Analysis, Insights and Forecast - by Application
- 5.2.1. Water Treatment
- 5.2.2. Fuel Cells
- 5.2.3. Biomedical
- 5.2.4. Food Processing
- 5.2.5. Other Applications
- 5.3. Market Analysis, Insights and Forecast - by Region
- 5.3.1. Asia Pacific
- 5.3.2. North America
- 5.3.3. Europe
- 5.3.4. South America
- 5.3.5. Middle East
- 5.3.6. Saudi Arabia
- 5.1. Market Analysis, Insights and Forecast - by Material Type
- 6. Asia Pacific Nanoporous Membranes Industry Analysis, Insights and Forecast, 2019-2031
- 6.1. Market Analysis, Insights and Forecast - by Material Type
- 6.1.1. Organic
- 6.1.2. Inorgani
- 6.1.3. Hybrid
- 6.2. Market Analysis, Insights and Forecast - by Application
- 6.2.1. Water Treatment
- 6.2.2. Fuel Cells
- 6.2.3. Biomedical
- 6.2.4. Food Processing
- 6.2.5. Other Applications
- 6.1. Market Analysis, Insights and Forecast - by Material Type
- 7. North America Nanoporous Membranes Industry Analysis, Insights and Forecast, 2019-2031
- 7.1. Market Analysis, Insights and Forecast - by Material Type
- 7.1.1. Organic
- 7.1.2. Inorgani
- 7.1.3. Hybrid
- 7.2. Market Analysis, Insights and Forecast - by Application
- 7.2.1. Water Treatment
- 7.2.2. Fuel Cells
- 7.2.3. Biomedical
- 7.2.4. Food Processing
- 7.2.5. Other Applications
- 7.1. Market Analysis, Insights and Forecast - by Material Type
- 8. Europe Nanoporous Membranes Industry Analysis, Insights and Forecast, 2019-2031
- 8.1. Market Analysis, Insights and Forecast - by Material Type
- 8.1.1. Organic
- 8.1.2. Inorgani
- 8.1.3. Hybrid
- 8.2. Market Analysis, Insights and Forecast - by Application
- 8.2.1. Water Treatment
- 8.2.2. Fuel Cells
- 8.2.3. Biomedical
- 8.2.4. Food Processing
- 8.2.5. Other Applications
- 8.1. Market Analysis, Insights and Forecast - by Material Type
- 9. South America Nanoporous Membranes Industry Analysis, Insights and Forecast, 2019-2031
- 9.1. Market Analysis, Insights and Forecast - by Material Type
- 9.1.1. Organic
- 9.1.2. Inorgani
- 9.1.3. Hybrid
- 9.2. Market Analysis, Insights and Forecast - by Application
- 9.2.1. Water Treatment
- 9.2.2. Fuel Cells
- 9.2.3. Biomedical
- 9.2.4. Food Processing
- 9.2.5. Other Applications
- 9.1. Market Analysis, Insights and Forecast - by Material Type
- 10. Middle East Nanoporous Membranes Industry Analysis, Insights and Forecast, 2019-2031
- 10.1. Market Analysis, Insights and Forecast - by Material Type
- 10.1.1. Organic
- 10.1.2. Inorgani
- 10.1.3. Hybrid
- 10.2. Market Analysis, Insights and Forecast - by Application
- 10.2.1. Water Treatment
- 10.2.2. Fuel Cells
- 10.2.3. Biomedical
- 10.2.4. Food Processing
- 10.2.5. Other Applications
- 10.1. Market Analysis, Insights and Forecast - by Material Type
- 11. Saudi Arabia Nanoporous Membranes Industry Analysis, Insights and Forecast, 2019-2031
- 11.1. Market Analysis, Insights and Forecast - by Material Type
- 11.1.1. Organic
- 11.1.2. Inorgani
- 11.1.3. Hybrid
- 11.2. Market Analysis, Insights and Forecast - by Application
- 11.2.1. Water Treatment
- 11.2.2. Fuel Cells
- 11.2.3. Biomedical
- 11.2.4. Food Processing
- 11.2.5. Other Applications
- 11.1. Market Analysis, Insights and Forecast - by Material Type
- 12. North America Nanoporous Membranes Industry Analysis, Insights and Forecast, 2019-2031
- 12.1. Market Analysis, Insights and Forecast - By Country/Sub-region
- 12.1.1 United States
- 12.1.2 Canada
- 13. Europe Nanoporous Membranes Industry Analysis, Insights and Forecast, 2019-2031
- 13.1. Market Analysis, Insights and Forecast - By Country/Sub-region
- 13.1.1 Germany
- 13.1.2 France
- 13.1.3 Italy
- 13.1.4 United Kingdom
- 13.1.5 Netherlands
- 13.1.6 Rest of Europe
- 14. Asia Pacific Nanoporous Membranes Industry Analysis, Insights and Forecast, 2019-2031
- 14.1. Market Analysis, Insights and Forecast - By Country/Sub-region
- 14.1.1 China
- 14.1.2 Japan
- 14.1.3 India
- 14.1.4 South Korea
- 14.1.5 Taiwan
- 14.1.6 Australia
- 14.1.7 Rest of Asia-Pacific
- 15. South America Nanoporous Membranes Industry Analysis, Insights and Forecast, 2019-2031
- 15.1. Market Analysis, Insights and Forecast - By Country/Sub-region
- 15.1.1 Brazil
- 15.1.2 Argentina
- 15.1.3 Rest of South America
- 16. MEA Nanoporous Membranes Industry Analysis, Insights and Forecast, 2019-2031
- 16.1. Market Analysis, Insights and Forecast - By Country/Sub-region
- 16.1.1 Middle East
- 16.1.2 Africa
- 17. Competitive Analysis
- 17.1. Global Market Share Analysis 2024
- 17.2. Company Profiles
- 17.2.1 MICRODYN-NADIR GmbH
- 17.2.1.1. Overview
- 17.2.1.2. Products
- 17.2.1.3. SWOT Analysis
- 17.2.1.4. Recent Developments
- 17.2.1.5. Financials (Based on Availability)
- 17.2.2 Hydranautics A Nitto Group Company
- 17.2.2.1. Overview
- 17.2.2.2. Products
- 17.2.2.3. SWOT Analysis
- 17.2.2.4. Recent Developments
- 17.2.2.5. Financials (Based on Availability)
- 17.2.3 SiMPore Inc
- 17.2.3.1. Overview
- 17.2.3.2. Products
- 17.2.3.3. SWOT Analysis
- 17.2.3.4. Recent Developments
- 17.2.3.5. Financials (Based on Availability)
- 17.2.4 InRedox LLC
- 17.2.4.1. Overview
- 17.2.4.2. Products
- 17.2.4.3. SWOT Analysis
- 17.2.4.4. Recent Developments
- 17.2.4.5. Financials (Based on Availability)
- 17.2.5 SUEZ Environnement SA
- 17.2.5.1. Overview
- 17.2.5.2. Products
- 17.2.5.3. SWOT Analysis
- 17.2.5.4. Recent Developments
- 17.2.5.5. Financials (Based on Availability)
- 17.2.6 Osmotech Membranes Pvt Ltd
- 17.2.6.1. Overview
- 17.2.6.2. Products
- 17.2.6.3. SWOT Analysis
- 17.2.6.4. Recent Developments
- 17.2.6.5. Financials (Based on Availability)
- 17.2.7 Hunan Keensen Technology Co Ltd
- 17.2.7.1. Overview
- 17.2.7.2. Products
- 17.2.7.3. SWOT Analysis
- 17.2.7.4. Recent Developments
- 17.2.7.5. Financials (Based on Availability)
- 17.2.8 Synder Filtration Inc
- 17.2.8.1. Overview
- 17.2.8.2. Products
- 17.2.8.3. SWOT Analysis
- 17.2.8.4. Recent Developments
- 17.2.8.5. Financials (Based on Availability)
- 17.2.9 AXEON Water Technologies Inc
- 17.2.9.1. Overview
- 17.2.9.2. Products
- 17.2.9.3. SWOT Analysis
- 17.2.9.4. Recent Developments
- 17.2.9.5. Financials (Based on Availability)
- 17.2.10 inopor GmbH
- 17.2.10.1. Overview
- 17.2.10.2. Products
- 17.2.10.3. SWOT Analysis
- 17.2.10.4. Recent Developments
- 17.2.10.5. Financials (Based on Availability)
- 17.2.11 BASF SE
- 17.2.11.1. Overview
- 17.2.11.2. Products
- 17.2.11.3. SWOT Analysis
- 17.2.11.4. Recent Developments
- 17.2.11.5. Financials (Based on Availability)
- 17.2.12 Toray Chemical Korea Inc
- 17.2.12.1. Overview
- 17.2.12.2. Products
- 17.2.12.3. SWOT Analysis
- 17.2.12.4. Recent Developments
- 17.2.12.5. Financials (Based on Availability)
- 17.2.13 DowDuPont Inc
- 17.2.13.1. Overview
- 17.2.13.2. Products
- 17.2.13.3. SWOT Analysis
- 17.2.13.4. Recent Developments
- 17.2.13.5. Financials (Based on Availability)
- 17.2.14 Koch Membrane Systems Inc
- 17.2.14.1. Overview
- 17.2.14.2. Products
- 17.2.14.3. SWOT Analysis
- 17.2.14.4. Recent Developments
- 17.2.14.5. Financials (Based on Availability)
- 17.2.15 SmartMembranes GmbH
- 17.2.15.1. Overview
- 17.2.15.2. Products
- 17.2.15.3. SWOT Analysis
- 17.2.15.4. Recent Developments
- 17.2.15.5. Financials (Based on Availability)
- 17.2.16 Applied Membranes Inc
- 17.2.16.1. Overview
- 17.2.16.2. Products
- 17.2.16.3. SWOT Analysis
- 17.2.16.4. Recent Developments
- 17.2.16.5. Financials (Based on Availability)
- 17.2.17 Alfa Laval AB
- 17.2.17.1. Overview
- 17.2.17.2. Products
- 17.2.17.3. SWOT Analysis
- 17.2.17.4. Recent Developments
- 17.2.17.5. Financials (Based on Availability)
- 17.2.18 Pure-Pro Water Corporation
- 17.2.18.1. Overview
- 17.2.18.2. Products
- 17.2.18.3. SWOT Analysis
- 17.2.18.4. Recent Developments
- 17.2.18.5. Financials (Based on Availability)
- 17.2.1 MICRODYN-NADIR GmbH
List of Figures
- Figure 1: Global Nanoporous Membranes Industry Revenue Breakdown (Million, %) by Region 2024 & 2032
- Figure 2: Global Nanoporous Membranes Industry Volume Breakdown (K Units, %) by Region 2024 & 2032
- Figure 3: North America Nanoporous Membranes Industry Revenue (Million), by Country 2024 & 2032
- Figure 4: North America Nanoporous Membranes Industry Volume (K Units), by Country 2024 & 2032
- Figure 5: North America Nanoporous Membranes Industry Revenue Share (%), by Country 2024 & 2032
- Figure 6: North America Nanoporous Membranes Industry Volume Share (%), by Country 2024 & 2032
- Figure 7: Europe Nanoporous Membranes Industry Revenue (Million), by Country 2024 & 2032
- Figure 8: Europe Nanoporous Membranes Industry Volume (K Units), by Country 2024 & 2032
- Figure 9: Europe Nanoporous Membranes Industry Revenue Share (%), by Country 2024 & 2032
- Figure 10: Europe Nanoporous Membranes Industry Volume Share (%), by Country 2024 & 2032
- Figure 11: Asia Pacific Nanoporous Membranes Industry Revenue (Million), by Country 2024 & 2032
- Figure 12: Asia Pacific Nanoporous Membranes Industry Volume (K Units), by Country 2024 & 2032
- Figure 13: Asia Pacific Nanoporous Membranes Industry Revenue Share (%), by Country 2024 & 2032
- Figure 14: Asia Pacific Nanoporous Membranes Industry Volume Share (%), by Country 2024 & 2032
- Figure 15: South America Nanoporous Membranes Industry Revenue (Million), by Country 2024 & 2032
- Figure 16: South America Nanoporous Membranes Industry Volume (K Units), by Country 2024 & 2032
- Figure 17: South America Nanoporous Membranes Industry Revenue Share (%), by Country 2024 & 2032
- Figure 18: South America Nanoporous Membranes Industry Volume Share (%), by Country 2024 & 2032
- Figure 19: MEA Nanoporous Membranes Industry Revenue (Million), by Country 2024 & 2032
- Figure 20: MEA Nanoporous Membranes Industry Volume (K Units), by Country 2024 & 2032
- Figure 21: MEA Nanoporous Membranes Industry Revenue Share (%), by Country 2024 & 2032
- Figure 22: MEA Nanoporous Membranes Industry Volume Share (%), by Country 2024 & 2032
- Figure 23: Asia Pacific Nanoporous Membranes Industry Revenue (Million), by Material Type 2024 & 2032
- Figure 24: Asia Pacific Nanoporous Membranes Industry Volume (K Units), by Material Type 2024 & 2032
- Figure 25: Asia Pacific Nanoporous Membranes Industry Revenue Share (%), by Material Type 2024 & 2032
- Figure 26: Asia Pacific Nanoporous Membranes Industry Volume Share (%), by Material Type 2024 & 2032
- Figure 27: Asia Pacific Nanoporous Membranes Industry Revenue (Million), by Application 2024 & 2032
- Figure 28: Asia Pacific Nanoporous Membranes Industry Volume (K Units), by Application 2024 & 2032
- Figure 29: Asia Pacific Nanoporous Membranes Industry Revenue Share (%), by Application 2024 & 2032
- Figure 30: Asia Pacific Nanoporous Membranes Industry Volume Share (%), by Application 2024 & 2032
- Figure 31: Asia Pacific Nanoporous Membranes Industry Revenue (Million), by Country 2024 & 2032
- Figure 32: Asia Pacific Nanoporous Membranes Industry Volume (K Units), by Country 2024 & 2032
- Figure 33: Asia Pacific Nanoporous Membranes Industry Revenue Share (%), by Country 2024 & 2032
- Figure 34: Asia Pacific Nanoporous Membranes Industry Volume Share (%), by Country 2024 & 2032
- Figure 35: North America Nanoporous Membranes Industry Revenue (Million), by Material Type 2024 & 2032
- Figure 36: North America Nanoporous Membranes Industry Volume (K Units), by Material Type 2024 & 2032
- Figure 37: North America Nanoporous Membranes Industry Revenue Share (%), by Material Type 2024 & 2032
- Figure 38: North America Nanoporous Membranes Industry Volume Share (%), by Material Type 2024 & 2032
- Figure 39: North America Nanoporous Membranes Industry Revenue (Million), by Application 2024 & 2032
- Figure 40: North America Nanoporous Membranes Industry Volume (K Units), by Application 2024 & 2032
- Figure 41: North America Nanoporous Membranes Industry Revenue Share (%), by Application 2024 & 2032
- Figure 42: North America Nanoporous Membranes Industry Volume Share (%), by Application 2024 & 2032
- Figure 43: North America Nanoporous Membranes Industry Revenue (Million), by Country 2024 & 2032
- Figure 44: North America Nanoporous Membranes Industry Volume (K Units), by Country 2024 & 2032
- Figure 45: North America Nanoporous Membranes Industry Revenue Share (%), by Country 2024 & 2032
- Figure 46: North America Nanoporous Membranes Industry Volume Share (%), by Country 2024 & 2032
- Figure 47: Europe Nanoporous Membranes Industry Revenue (Million), by Material Type 2024 & 2032
- Figure 48: Europe Nanoporous Membranes Industry Volume (K Units), by Material Type 2024 & 2032
- Figure 49: Europe Nanoporous Membranes Industry Revenue Share (%), by Material Type 2024 & 2032
- Figure 50: Europe Nanoporous Membranes Industry Volume Share (%), by Material Type 2024 & 2032
- Figure 51: Europe Nanoporous Membranes Industry Revenue (Million), by Application 2024 & 2032
- Figure 52: Europe Nanoporous Membranes Industry Volume (K Units), by Application 2024 & 2032
- Figure 53: Europe Nanoporous Membranes Industry Revenue Share (%), by Application 2024 & 2032
- Figure 54: Europe Nanoporous Membranes Industry Volume Share (%), by Application 2024 & 2032
- Figure 55: Europe Nanoporous Membranes Industry Revenue (Million), by Country 2024 & 2032
- Figure 56: Europe Nanoporous Membranes Industry Volume (K Units), by Country 2024 & 2032
- Figure 57: Europe Nanoporous Membranes Industry Revenue Share (%), by Country 2024 & 2032
- Figure 58: Europe Nanoporous Membranes Industry Volume Share (%), by Country 2024 & 2032
- Figure 59: South America Nanoporous Membranes Industry Revenue (Million), by Material Type 2024 & 2032
- Figure 60: South America Nanoporous Membranes Industry Volume (K Units), by Material Type 2024 & 2032
- Figure 61: South America Nanoporous Membranes Industry Revenue Share (%), by Material Type 2024 & 2032
- Figure 62: South America Nanoporous Membranes Industry Volume Share (%), by Material Type 2024 & 2032
- Figure 63: South America Nanoporous Membranes Industry Revenue (Million), by Application 2024 & 2032
- Figure 64: South America Nanoporous Membranes Industry Volume (K Units), by Application 2024 & 2032
- Figure 65: South America Nanoporous Membranes Industry Revenue Share (%), by Application 2024 & 2032
- Figure 66: South America Nanoporous Membranes Industry Volume Share (%), by Application 2024 & 2032
- Figure 67: South America Nanoporous Membranes Industry Revenue (Million), by Country 2024 & 2032
- Figure 68: South America Nanoporous Membranes Industry Volume (K Units), by Country 2024 & 2032
- Figure 69: South America Nanoporous Membranes Industry Revenue Share (%), by Country 2024 & 2032
- Figure 70: South America Nanoporous Membranes Industry Volume Share (%), by Country 2024 & 2032
- Figure 71: Middle East Nanoporous Membranes Industry Revenue (Million), by Material Type 2024 & 2032
- Figure 72: Middle East Nanoporous Membranes Industry Volume (K Units), by Material Type 2024 & 2032
- Figure 73: Middle East Nanoporous Membranes Industry Revenue Share (%), by Material Type 2024 & 2032
- Figure 74: Middle East Nanoporous Membranes Industry Volume Share (%), by Material Type 2024 & 2032
- Figure 75: Middle East Nanoporous Membranes Industry Revenue (Million), by Application 2024 & 2032
- Figure 76: Middle East Nanoporous Membranes Industry Volume (K Units), by Application 2024 & 2032
- Figure 77: Middle East Nanoporous Membranes Industry Revenue Share (%), by Application 2024 & 2032
- Figure 78: Middle East Nanoporous Membranes Industry Volume Share (%), by Application 2024 & 2032
- Figure 79: Middle East Nanoporous Membranes Industry Revenue (Million), by Country 2024 & 2032
- Figure 80: Middle East Nanoporous Membranes Industry Volume (K Units), by Country 2024 & 2032
- Figure 81: Middle East Nanoporous Membranes Industry Revenue Share (%), by Country 2024 & 2032
- Figure 82: Middle East Nanoporous Membranes Industry Volume Share (%), by Country 2024 & 2032
- Figure 83: Saudi Arabia Nanoporous Membranes Industry Revenue (Million), by Material Type 2024 & 2032
- Figure 84: Saudi Arabia Nanoporous Membranes Industry Volume (K Units), by Material Type 2024 & 2032
- Figure 85: Saudi Arabia Nanoporous Membranes Industry Revenue Share (%), by Material Type 2024 & 2032
- Figure 86: Saudi Arabia Nanoporous Membranes Industry Volume Share (%), by Material Type 2024 & 2032
- Figure 87: Saudi Arabia Nanoporous Membranes Industry Revenue (Million), by Application 2024 & 2032
- Figure 88: Saudi Arabia Nanoporous Membranes Industry Volume (K Units), by Application 2024 & 2032
- Figure 89: Saudi Arabia Nanoporous Membranes Industry Revenue Share (%), by Application 2024 & 2032
- Figure 90: Saudi Arabia Nanoporous Membranes Industry Volume Share (%), by Application 2024 & 2032
- Figure 91: Saudi Arabia Nanoporous Membranes Industry Revenue (Million), by Country 2024 & 2032
- Figure 92: Saudi Arabia Nanoporous Membranes Industry Volume (K Units), by Country 2024 & 2032
- Figure 93: Saudi Arabia Nanoporous Membranes Industry Revenue Share (%), by Country 2024 & 2032
- Figure 94: Saudi Arabia Nanoporous Membranes Industry Volume Share (%), by Country 2024 & 2032
List of Tables
- Table 1: Global Nanoporous Membranes Industry Revenue Million Forecast, by Region 2019 & 2032
- Table 2: Global Nanoporous Membranes Industry Volume K Units Forecast, by Region 2019 & 2032
- Table 3: Global Nanoporous Membranes Industry Revenue Million Forecast, by Material Type 2019 & 2032
- Table 4: Global Nanoporous Membranes Industry Volume K Units Forecast, by Material Type 2019 & 2032
- Table 5: Global Nanoporous Membranes Industry Revenue Million Forecast, by Application 2019 & 2032
- Table 6: Global Nanoporous Membranes Industry Volume K Units Forecast, by Application 2019 & 2032
- Table 7: Global Nanoporous Membranes Industry Revenue Million Forecast, by Region 2019 & 2032
- Table 8: Global Nanoporous Membranes Industry Volume K Units Forecast, by Region 2019 & 2032
- Table 9: Global Nanoporous Membranes Industry Revenue Million Forecast, by Country 2019 & 2032
- Table 10: Global Nanoporous Membranes Industry Volume K Units Forecast, by Country 2019 & 2032
- Table 11: United States Nanoporous Membranes Industry Revenue (Million) Forecast, by Application 2019 & 2032
- Table 12: United States Nanoporous Membranes Industry Volume (K Units) Forecast, by Application 2019 & 2032
- Table 13: Canada Nanoporous Membranes Industry Revenue (Million) Forecast, by Application 2019 & 2032
- Table 14: Canada Nanoporous Membranes Industry Volume (K Units) Forecast, by Application 2019 & 2032
- Table 15: Global Nanoporous Membranes Industry Revenue Million Forecast, by Country 2019 & 2032
- Table 16: Global Nanoporous Membranes Industry Volume K Units Forecast, by Country 2019 & 2032
- Table 17: Germany Nanoporous Membranes Industry Revenue (Million) Forecast, by Application 2019 & 2032
- Table 18: Germany Nanoporous Membranes Industry Volume (K Units) Forecast, by Application 2019 & 2032
- Table 19: France Nanoporous Membranes Industry Revenue (Million) Forecast, by Application 2019 & 2032
- Table 20: France Nanoporous Membranes Industry Volume (K Units) Forecast, by Application 2019 & 2032
- Table 21: Italy Nanoporous Membranes Industry Revenue (Million) Forecast, by Application 2019 & 2032
- Table 22: Italy Nanoporous Membranes Industry Volume (K Units) Forecast, by Application 2019 & 2032
- Table 23: United Kingdom Nanoporous Membranes Industry Revenue (Million) Forecast, by Application 2019 & 2032
- Table 24: United Kingdom Nanoporous Membranes Industry Volume (K Units) Forecast, by Application 2019 & 2032
- Table 25: Netherlands Nanoporous Membranes Industry Revenue (Million) Forecast, by Application 2019 & 2032
- Table 26: Netherlands Nanoporous Membranes Industry Volume (K Units) Forecast, by Application 2019 & 2032
- Table 27: Rest of Europe Nanoporous Membranes Industry Revenue (Million) Forecast, by Application 2019 & 2032
- Table 28: Rest of Europe Nanoporous Membranes Industry Volume (K Units) Forecast, by Application 2019 & 2032
- Table 29: Global Nanoporous Membranes Industry Revenue Million Forecast, by Country 2019 & 2032
- Table 30: Global Nanoporous Membranes Industry Volume K Units Forecast, by Country 2019 & 2032
- Table 31: China Nanoporous Membranes Industry Revenue (Million) Forecast, by Application 2019 & 2032
- Table 32: China Nanoporous Membranes Industry Volume (K Units) Forecast, by Application 2019 & 2032
- Table 33: Japan Nanoporous Membranes Industry Revenue (Million) Forecast, by Application 2019 & 2032
- Table 34: Japan Nanoporous Membranes Industry Volume (K Units) Forecast, by Application 2019 & 2032
- Table 35: India Nanoporous Membranes Industry Revenue (Million) Forecast, by Application 2019 & 2032
- Table 36: India Nanoporous Membranes Industry Volume (K Units) Forecast, by Application 2019 & 2032
- Table 37: South Korea Nanoporous Membranes Industry Revenue (Million) Forecast, by Application 2019 & 2032
- Table 38: South Korea Nanoporous Membranes Industry Volume (K Units) Forecast, by Application 2019 & 2032
- Table 39: Taiwan Nanoporous Membranes Industry Revenue (Million) Forecast, by Application 2019 & 2032
- Table 40: Taiwan Nanoporous Membranes Industry Volume (K Units) Forecast, by Application 2019 & 2032
- Table 41: Australia Nanoporous Membranes Industry Revenue (Million) Forecast, by Application 2019 & 2032
- Table 42: Australia Nanoporous Membranes Industry Volume (K Units) Forecast, by Application 2019 & 2032
- Table 43: Rest of Asia-Pacific Nanoporous Membranes Industry Revenue (Million) Forecast, by Application 2019 & 2032
- Table 44: Rest of Asia-Pacific Nanoporous Membranes Industry Volume (K Units) Forecast, by Application 2019 & 2032
- Table 45: Global Nanoporous Membranes Industry Revenue Million Forecast, by Country 2019 & 2032
- Table 46: Global Nanoporous Membranes Industry Volume K Units Forecast, by Country 2019 & 2032
- Table 47: Brazil Nanoporous Membranes Industry Revenue (Million) Forecast, by Application 2019 & 2032
- Table 48: Brazil Nanoporous Membranes Industry Volume (K Units) Forecast, by Application 2019 & 2032
- Table 49: Argentina Nanoporous Membranes Industry Revenue (Million) Forecast, by Application 2019 & 2032
- Table 50: Argentina Nanoporous Membranes Industry Volume (K Units) Forecast, by Application 2019 & 2032
- Table 51: Rest of South America Nanoporous Membranes Industry Revenue (Million) Forecast, by Application 2019 & 2032
- Table 52: Rest of South America Nanoporous Membranes Industry Volume (K Units) Forecast, by Application 2019 & 2032
- Table 53: Global Nanoporous Membranes Industry Revenue Million Forecast, by Country 2019 & 2032
- Table 54: Global Nanoporous Membranes Industry Volume K Units Forecast, by Country 2019 & 2032
- Table 55: Middle East Nanoporous Membranes Industry Revenue (Million) Forecast, by Application 2019 & 2032
- Table 56: Middle East Nanoporous Membranes Industry Volume (K Units) Forecast, by Application 2019 & 2032
- Table 57: Africa Nanoporous Membranes Industry Revenue (Million) Forecast, by Application 2019 & 2032
- Table 58: Africa Nanoporous Membranes Industry Volume (K Units) Forecast, by Application 2019 & 2032
- Table 59: Global Nanoporous Membranes Industry Revenue Million Forecast, by Material Type 2019 & 2032
- Table 60: Global Nanoporous Membranes Industry Volume K Units Forecast, by Material Type 2019 & 2032
- Table 61: Global Nanoporous Membranes Industry Revenue Million Forecast, by Application 2019 & 2032
- Table 62: Global Nanoporous Membranes Industry Volume K Units Forecast, by Application 2019 & 2032
- Table 63: Global Nanoporous Membranes Industry Revenue Million Forecast, by Country 2019 & 2032
- Table 64: Global Nanoporous Membranes Industry Volume K Units Forecast, by Country 2019 & 2032
- Table 65: China Nanoporous Membranes Industry Revenue (Million) Forecast, by Application 2019 & 2032
- Table 66: China Nanoporous Membranes Industry Volume (K Units) Forecast, by Application 2019 & 2032
- Table 67: India Nanoporous Membranes Industry Revenue (Million) Forecast, by Application 2019 & 2032
- Table 68: India Nanoporous Membranes Industry Volume (K Units) Forecast, by Application 2019 & 2032
- Table 69: Japan Nanoporous Membranes Industry Revenue (Million) Forecast, by Application 2019 & 2032
- Table 70: Japan Nanoporous Membranes Industry Volume (K Units) Forecast, by Application 2019 & 2032
- Table 71: South Korea Nanoporous Membranes Industry Revenue (Million) Forecast, by Application 2019 & 2032
- Table 72: South Korea Nanoporous Membranes Industry Volume (K Units) Forecast, by Application 2019 & 2032
- Table 73: ASEAN Countries Nanoporous Membranes Industry Revenue (Million) Forecast, by Application 2019 & 2032
- Table 74: ASEAN Countries Nanoporous Membranes Industry Volume (K Units) Forecast, by Application 2019 & 2032
- Table 75: Rest of Asia Pacific Nanoporous Membranes Industry Revenue (Million) Forecast, by Application 2019 & 2032
- Table 76: Rest of Asia Pacific Nanoporous Membranes Industry Volume (K Units) Forecast, by Application 2019 & 2032
- Table 77: Global Nanoporous Membranes Industry Revenue Million Forecast, by Material Type 2019 & 2032
- Table 78: Global Nanoporous Membranes Industry Volume K Units Forecast, by Material Type 2019 & 2032
- Table 79: Global Nanoporous Membranes Industry Revenue Million Forecast, by Application 2019 & 2032
- Table 80: Global Nanoporous Membranes Industry Volume K Units Forecast, by Application 2019 & 2032
- Table 81: Global Nanoporous Membranes Industry Revenue Million Forecast, by Country 2019 & 2032
- Table 82: Global Nanoporous Membranes Industry Volume K Units Forecast, by Country 2019 & 2032
- Table 83: United States Nanoporous Membranes Industry Revenue (Million) Forecast, by Application 2019 & 2032
- Table 84: United States Nanoporous Membranes Industry Volume (K Units) Forecast, by Application 2019 & 2032
- Table 85: Canada Nanoporous Membranes Industry Revenue (Million) Forecast, by Application 2019 & 2032
- Table 86: Canada Nanoporous Membranes Industry Volume (K Units) Forecast, by Application 2019 & 2032
- Table 87: Rest of North America Nanoporous Membranes Industry Revenue (Million) Forecast, by Application 2019 & 2032
- Table 88: Rest of North America Nanoporous Membranes Industry Volume (K Units) Forecast, by Application 2019 & 2032
- Table 89: Global Nanoporous Membranes Industry Revenue Million Forecast, by Material Type 2019 & 2032
- Table 90: Global Nanoporous Membranes Industry Volume K Units Forecast, by Material Type 2019 & 2032
- Table 91: Global Nanoporous Membranes Industry Revenue Million Forecast, by Application 2019 & 2032
- Table 92: Global Nanoporous Membranes Industry Volume K Units Forecast, by Application 2019 & 2032
- Table 93: Global Nanoporous Membranes Industry Revenue Million Forecast, by Country 2019 & 2032
- Table 94: Global Nanoporous Membranes Industry Volume K Units Forecast, by Country 2019 & 2032
- Table 95: Germany Nanoporous Membranes Industry Revenue (Million) Forecast, by Application 2019 & 2032
- Table 96: Germany Nanoporous Membranes Industry Volume (K Units) Forecast, by Application 2019 & 2032
- Table 97: United Kingdom Nanoporous Membranes Industry Revenue (Million) Forecast, by Application 2019 & 2032
- Table 98: United Kingdom Nanoporous Membranes Industry Volume (K Units) Forecast, by Application 2019 & 2032
- Table 99: Italy Nanoporous Membranes Industry Revenue (Million) Forecast, by Application 2019 & 2032
- Table 100: Italy Nanoporous Membranes Industry Volume (K Units) Forecast, by Application 2019 & 2032
- Table 101: France Nanoporous Membranes Industry Revenue (Million) Forecast, by Application 2019 & 2032
- Table 102: France Nanoporous Membranes Industry Volume (K Units) Forecast, by Application 2019 & 2032
- Table 103: Spain Nanoporous Membranes Industry Revenue (Million) Forecast, by Application 2019 & 2032
- Table 104: Spain Nanoporous Membranes Industry Volume (K Units) Forecast, by Application 2019 & 2032
- Table 105: Rest of Europe Nanoporous Membranes Industry Revenue (Million) Forecast, by Application 2019 & 2032
- Table 106: Rest of Europe Nanoporous Membranes Industry Volume (K Units) Forecast, by Application 2019 & 2032
- Table 107: Global Nanoporous Membranes Industry Revenue Million Forecast, by Material Type 2019 & 2032
- Table 108: Global Nanoporous Membranes Industry Volume K Units Forecast, by Material Type 2019 & 2032
- Table 109: Global Nanoporous Membranes Industry Revenue Million Forecast, by Application 2019 & 2032
- Table 110: Global Nanoporous Membranes Industry Volume K Units Forecast, by Application 2019 & 2032
- Table 111: Global Nanoporous Membranes Industry Revenue Million Forecast, by Country 2019 & 2032
- Table 112: Global Nanoporous Membranes Industry Volume K Units Forecast, by Country 2019 & 2032
- Table 113: Brazil Nanoporous Membranes Industry Revenue (Million) Forecast, by Application 2019 & 2032
- Table 114: Brazil Nanoporous Membranes Industry Volume (K Units) Forecast, by Application 2019 & 2032
- Table 115: Argentina Nanoporous Membranes Industry Revenue (Million) Forecast, by Application 2019 & 2032
- Table 116: Argentina Nanoporous Membranes Industry Volume (K Units) Forecast, by Application 2019 & 2032
- Table 117: Rest of South America Nanoporous Membranes Industry Revenue (Million) Forecast, by Application 2019 & 2032
- Table 118: Rest of South America Nanoporous Membranes Industry Volume (K Units) Forecast, by Application 2019 & 2032
- Table 119: Global Nanoporous Membranes Industry Revenue Million Forecast, by Material Type 2019 & 2032
- Table 120: Global Nanoporous Membranes Industry Volume K Units Forecast, by Material Type 2019 & 2032
- Table 121: Global Nanoporous Membranes Industry Revenue Million Forecast, by Application 2019 & 2032
- Table 122: Global Nanoporous Membranes Industry Volume K Units Forecast, by Application 2019 & 2032
- Table 123: Global Nanoporous Membranes Industry Revenue Million Forecast, by Country 2019 & 2032
- Table 124: Global Nanoporous Membranes Industry Volume K Units Forecast, by Country 2019 & 2032
- Table 125: Global Nanoporous Membranes Industry Revenue Million Forecast, by Material Type 2019 & 2032
- Table 126: Global Nanoporous Membranes Industry Volume K Units Forecast, by Material Type 2019 & 2032
- Table 127: Global Nanoporous Membranes Industry Revenue Million Forecast, by Application 2019 & 2032
- Table 128: Global Nanoporous Membranes Industry Volume K Units Forecast, by Application 2019 & 2032
- Table 129: Global Nanoporous Membranes Industry Revenue Million Forecast, by Country 2019 & 2032
- Table 130: Global Nanoporous Membranes Industry Volume K Units Forecast, by Country 2019 & 2032
- Table 131: South Africa Nanoporous Membranes Industry Revenue (Million) Forecast, by Application 2019 & 2032
- Table 132: South Africa Nanoporous Membranes Industry Volume (K Units) Forecast, by Application 2019 & 2032
- Table 133: Rest of Middle East Nanoporous Membranes Industry Revenue (Million) Forecast, by Application 2019 & 2032
- Table 134: Rest of Middle East Nanoporous Membranes Industry Volume (K Units) Forecast, by Application 2019 & 2032
Frequently Asked Questions
1. What is the projected Compound Annual Growth Rate (CAGR) of the Nanoporous Membranes Industry?
The projected CAGR is approximately 6%.
2. Which companies are prominent players in the Nanoporous Membranes Industry?
Key companies in the market include MICRODYN-NADIR GmbH, Hydranautics A Nitto Group Company, SiMPore Inc, InRedox LLC, SUEZ Environnement SA, Osmotech Membranes Pvt Ltd, Hunan Keensen Technology Co Ltd, Synder Filtration Inc, AXEON Water Technologies Inc, inopor GmbH, BASF SE, Toray Chemical Korea Inc, DowDuPont Inc, Koch Membrane Systems Inc, SmartMembranes GmbH, Applied Membranes Inc, Alfa Laval AB, Pure-Pro Water Corporation.
3. What are the main segments of the Nanoporous Membranes Industry?
The market segments include Material Type, Application.
4. Can you provide details about the market size?
The market size is estimated to be USD 871.3 Million as of 2022.
5. What are some drivers contributing to market growth?
; Growing Need to Treat Wastewater; Rising Water Desalination Activities.
6. What are the notable trends driving market growth?
Growing Demand from Water Treatment Application.
7. Are there any restraints impacting market growth?
; Low Adoption in the Developing Countries; Poor Fouling Resistance of Nanoporous Membranes; Supply Deficiency of Nanomaterials.
8. Can you provide examples of recent developments in the market?
N/A
9. What pricing options are available for accessing the report?
Pricing options include single-user, multi-user, and enterprise licenses priced at USD 4750, USD 5250, and USD 8750 respectively.
10. Is the market size provided in terms of value or volume?
The market size is provided in terms of value, measured in Million and volume, measured in K Units.
11. Are there any specific market keywords associated with the report?
Yes, the market keyword associated with the report is "Nanoporous Membranes Industry," which aids in identifying and referencing the specific market segment covered.
12. How do I determine which pricing option suits my needs best?
The pricing options vary based on user requirements and access needs. Individual users may opt for single-user licenses, while businesses requiring broader access may choose multi-user or enterprise licenses for cost-effective access to the report.
13. Are there any additional resources or data provided in the Nanoporous Membranes Industry report?
While the report offers comprehensive insights, it's advisable to review the specific contents or supplementary materials provided to ascertain if additional resources or data are available.
14. How can I stay updated on further developments or reports in the Nanoporous Membranes Industry?
To stay informed about further developments, trends, and reports in the Nanoporous Membranes Industry, consider subscribing to industry newsletters, following relevant companies and organizations, or regularly checking reputable industry news sources and publications.
Methodology
Step 1 - Identification of Relevant Samples Size from Population Database


Step 2 - Approaches for Defining Global Market Size (Value, Volume* & Price*)

Note*: In applicable scenarios
Step 3 - Data Sources
Primary Research
- Web Analytics
- Survey Reports
- Research Institute
- Latest Research Reports
- Opinion Leaders
Secondary Research
- Annual Reports
- White Paper
- Latest Press Release
- Industry Association
- Paid Database
- Investor Presentations

Step 4 - Data Triangulation
Involves using different sources of information in order to increase the validity of a study
These sources are likely to be stakeholders in a program - participants, other researchers, program staff, other community members, and so on.
Then we put all data in single framework & apply various statistical tools to find out the dynamic on the market.
During the analysis stage, feedback from the stakeholder groups would be compared to determine areas of agreement as well as areas of divergence


