Understanding Consumer Behavior in Naval Remote Weapon System Industry Market: 2025-2033

Naval Remote Weapon System Industry by Production Analysis, by Consumption Analysis, by Import Market Analysis (Value & Volume), by Export Market Analysis (Value & Volume), by Price Trend Analysis, by North America (United States, Canada, Mexico), by South America (Brazil, Argentina, Rest of South America), by Europe (United Kingdom, Germany, France, Italy, Spain, Russia, Benelux, Nordics, Rest of Europe), by Middle East & Africa (Turkey, Israel, GCC, North Africa, South Africa, Rest of Middle East & Africa), by Asia Pacific (China, India, Japan, South Korea, ASEAN, Oceania, Rest of Asia Pacific) Forecast 2025-2033

Jul 2 2025
Base Year: 2024

234 Pages
Main Logo

Understanding Consumer Behavior in Naval Remote Weapon System Industry Market: 2025-2033


Home
Industries
Aerospace & Defense
sponsor image
sponsor image
sponsor image
sponsor image

Tailored for you

  • In-depth Analysis Tailored to Specified Regions or Segments
  • Company Profiles Customized to User Preferences
  • Comprehensive Insights Focused on Specific Segments or Regions
  • Customized Evaluation of Competitive Landscape to Meet Your Needs
  • Tailored Customization to Address Other Specific Requirements
Ask for customization


Key Insights

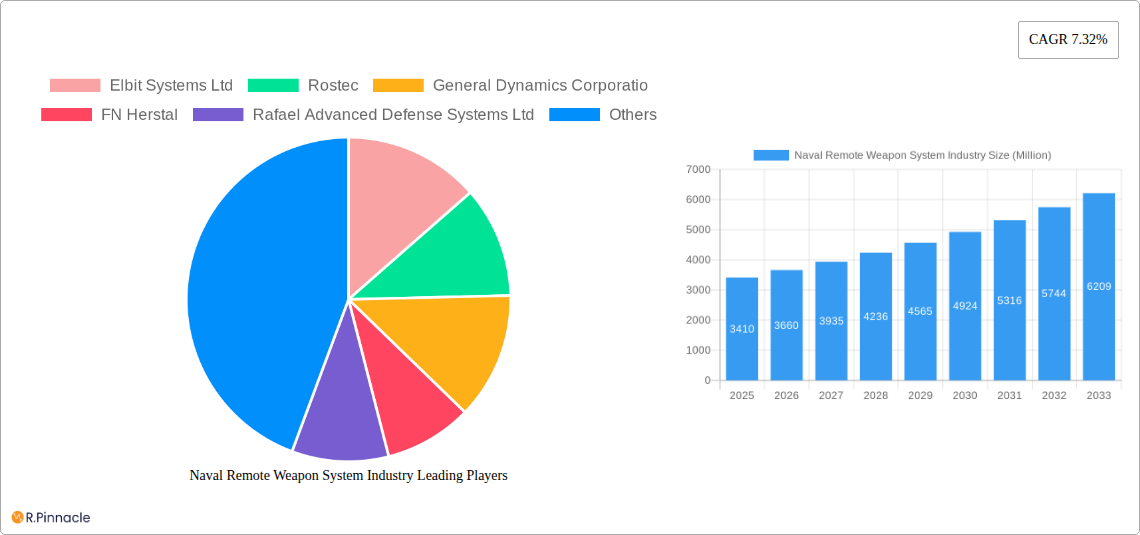
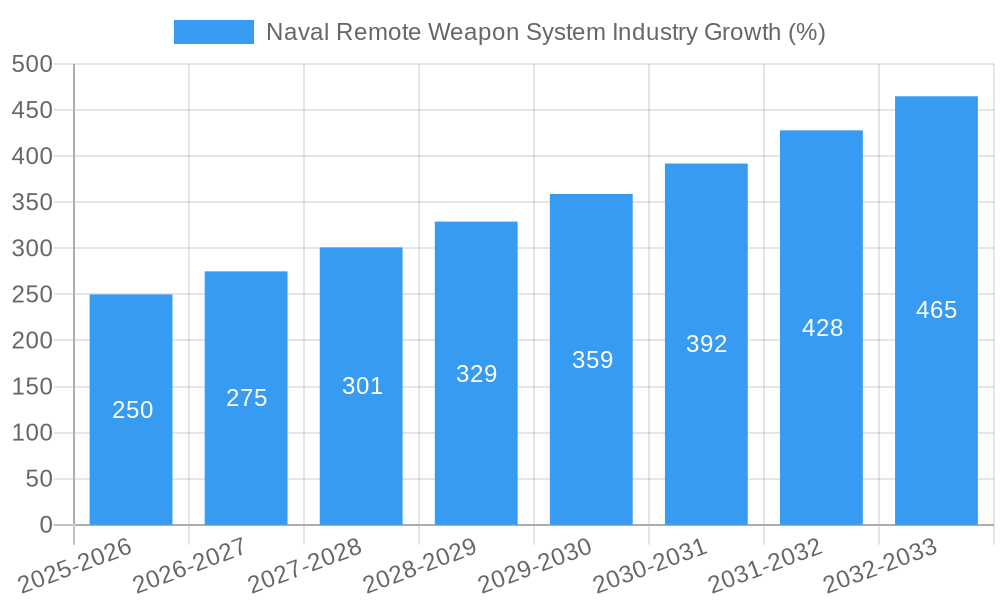
The Naval Remote Weapon System (NRWS) market is experiencing robust growth, projected to reach a value of $3.41 billion in 2025 and maintain a Compound Annual Growth Rate (CAGR) of 7.32% from 2025 to 2033. This expansion is driven by several key factors. Increased geopolitical instability and the growing need for advanced naval defense capabilities are primary drivers. Modernization of existing naval fleets and the integration of increasingly sophisticated remote weapon systems, offering enhanced precision, range, and survivability, are also significant contributors. Furthermore, the ongoing development of autonomous and unmanned naval platforms is creating new avenues for NRWS deployment, significantly impacting market growth. Technological advancements such as improved sensor technology, advanced targeting systems, and more effective communication networks are further fueling market expansion. The market segmentation highlights a diverse landscape with significant demand across various naval vessel types, including destroyers, frigates, submarines, corvettes, aircraft carriers, and other vessels. Competition among leading companies such as Elbit Systems, Rostec, General Dynamics, FN Herstal, Rafael Advanced Defense Systems, RTX Corporation, Leonardo, Hanwha Systems, Kongsberg, Saab, and ASELSAN, is fostering innovation and pushing the technological boundaries of NRWS capabilities.

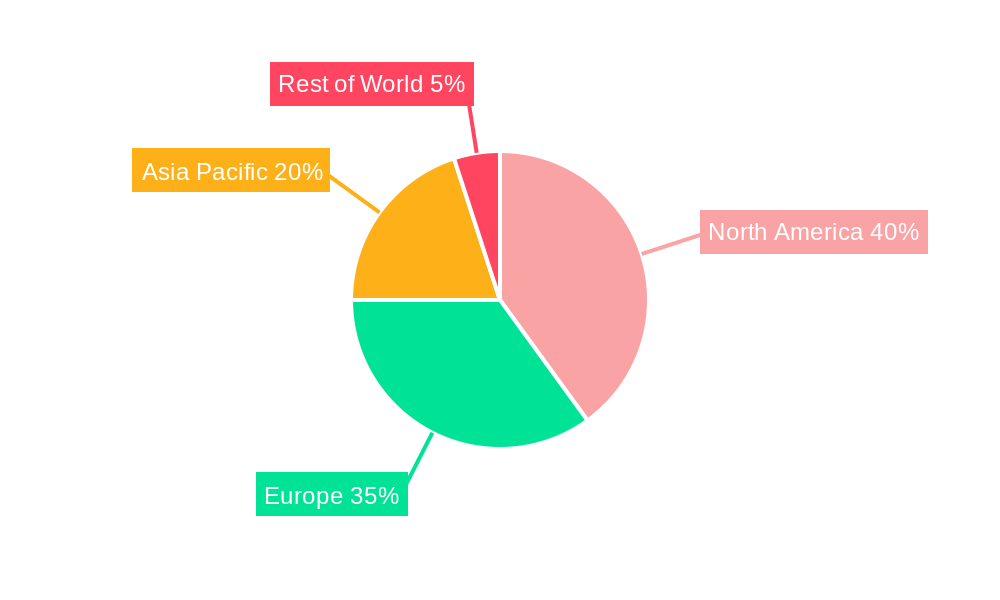
Regional analysis reveals a varied distribution of market share, with North America, Europe, and Asia Pacific expected to be the dominant regions. The considerable defense budgets allocated by nations in these regions, alongside strategic geopolitical considerations, are driving significant demand for NRWS. However, the market also faces certain restraints. High initial investment costs associated with NRWS procurement and integration, alongside the complexities of system maintenance and upgrades, can pose challenges. Despite these potential hurdles, the long-term outlook for the NRWS market remains positive, largely propelled by continuous technological advancements, increasing defense spending globally, and the strategic importance of naval power projection in the modern world. The projected CAGR of 7.32% indicates significant opportunities for growth over the forecast period.

Naval Remote Weapon System Industry: A Comprehensive Market Report (2019-2033)

This in-depth report provides a comprehensive analysis of the Naval Remote Weapon System industry, offering valuable insights for industry professionals, investors, and strategic decision-makers. The report covers the period from 2019 to 2033, with a focus on the 2025-2033 forecast period. The total market value is projected to reach xx Million by 2033, exhibiting a Compound Annual Growth Rate (CAGR) of xx%.

Naval Remote Weapon System Industry Research Report - Market Size, Growth & Forecast

Naval Remote Weapon System Industry Market Structure & Innovation Trends

This section analyzes the competitive landscape, innovation drivers, and regulatory influences shaping the Naval Remote Weapon System market. The industry exhibits a moderately concentrated structure, with key players holding significant market share. Elbit Systems Ltd, Rostec, and General Dynamics Corporation are among the leading players, collectively accounting for an estimated xx% of the global market share in 2025. Innovation is driven by advancements in sensor technology, AI-powered targeting systems, and the integration of unmanned platforms. Regulatory frameworks, including export controls and national security regulations, significantly impact market dynamics. Product substitutes, such as traditional manned weapon systems, exert some competitive pressure, but the demand for enhanced precision and reduced risk is driving adoption of remote weapon systems. M&A activity has been moderate, with recent deal values averaging approximately xx Million.

  • Market Concentration: Moderately concentrated, with top three players holding xx% market share (2025).
  • Innovation Drivers: Advanced sensor technologies, AI-powered targeting, unmanned integration.
  • Regulatory Landscape: Stringent export controls and national security regulations.
  • M&A Activity: Moderate, with average deal values around xx Million.
  • End-User Demographics: Primarily naval forces of developed and developing nations.
Naval Remote Weapon System Industry Growth

Naval Remote Weapon System Industry Market Dynamics & Trends

The Naval Remote Weapon System market is experiencing robust growth, driven by increasing defense budgets globally, modernization of naval fleets, and the demand for improved operational effectiveness. Technological advancements, such as the development of more accurate and reliable remote weapon systems, are also contributing to market expansion. Consumer preferences are shifting towards systems with enhanced precision, reduced collateral damage, and improved survivability for naval personnel. Competitive dynamics are characterized by intense rivalry among established players and the emergence of new entrants, leading to continuous product innovation and price competition. The market penetration of remote weapon systems is increasing steadily, with adoption rates significantly higher in developed nations. The CAGR for the forecast period (2025-2033) is estimated at xx%.

Naval Remote Weapon System Industry Growth

Dominant Regions & Segments in Naval Remote Weapon System Industry

North America currently holds the largest market share, driven by substantial defense spending and a strong technological base. However, the Asia-Pacific region is exhibiting the fastest growth rate, fueled by increasing defense modernization programs in several countries.

  • Leading Region: North America (2025)
  • Fastest-Growing Region: Asia-Pacific (2025-2033)

Dominant Naval Vessel Types:

  • Destroyers: High demand due to their role in fleet defense and offensive operations. Key drivers include the need for enhanced anti-air and anti-missile capabilities.
  • Frigates: Significant market due to their versatility and cost-effectiveness. Economic policies favoring naval modernization programs are crucial.
  • Submarines: Growth driven by increased underwater surveillance and anti-submarine warfare capabilities. Development of specialized remote weapon systems optimized for underwater environments is a key driver.
  • Corvettes: Market growth fueled by their use in coastal defense and patrol operations. Infrastructure development related to naval bases and supporting facilities is important.
  • Aircraft Carriers: High-value segment with specialized remote weapon systems, driven by demand for air defense and offensive strike capabilities.
  • Other Vessel Types: Includes patrol boats, amphibious assault ships, and support vessels.

Naval Remote Weapon System Industry Product Innovations

Recent innovations include the development of AI-powered targeting systems, improved sensor integration, and the miniaturization of remote weapon systems for smaller vessels. These advancements enhance accuracy, reduce collateral damage, and enable deployment on a broader range of naval platforms. The market is seeing a strong push toward increased automation and reduced operator workload, ensuring efficient and effective operation in complex combat scenarios.

Report Scope & Segmentation Analysis

This report segments the Naval Remote Weapon System market by naval vessel type: Destroyers, Frigates, Submarines, Corvettes, Aircraft Carriers, and Other Vessel Types. Each segment's growth projections, market sizes, and competitive dynamics are analyzed, providing a detailed understanding of the specific opportunities and challenges within each area. For example, the Destroyer segment is expected to account for xx Million in revenue by 2033.

Key Drivers of Naval Remote Weapon System Industry Growth

The growth of the Naval Remote Weapon System industry is driven by several factors. Increased defense budgets, particularly in Asia-Pacific and the Middle East, are fueling demand. Technological advancements, such as AI-powered targeting and improved sensor integration, enhance system capabilities and drive adoption. Furthermore, the rising need for enhanced naval capabilities to counter emerging threats is also a significant factor.

Challenges in the Naval Remote Weapon System Industry Sector

The industry faces challenges such as the high cost of development and integration, the complexity of regulatory approvals for new technologies, and supply chain disruptions. Cybersecurity concerns and the potential for system vulnerabilities also pose a significant risk, demanding robust countermeasures. These challenges can impact production timelines and potentially increase overall system costs.

Emerging Opportunities in Naval Remote Weapon System Industry

Emerging opportunities include the integration of unmanned systems, the development of laser-based weapon systems, and the expansion into new markets, such as the integration of advanced electronic warfare capabilities and enhanced countermeasures. The growing adoption of directed energy weapons presents a significant opportunity for future growth.

Leading Players in the Naval Remote Weapon System Industry Market

  • Elbit Systems Ltd
  • Rostec
  • General Dynamics Corporation
  • FN Herstal
  • Rafael Advanced Defense Systems Ltd
  • RTX Corporation
  • Leonardo S.p.A
  • Hanwha Systems Co Ltd
  • Kongsberg Defence & Aerospace (Kongsberg Gruppen ASA)
  • Saab AB
  • ASELSAN A Ş

Key Developments in Naval Remote Weapon System Industry Industry

  • July 2023: Unirobotics announced the expected delivery of four Trakon Targan RCS units to ASFAT for integration onto Hisar-class offshore patrol vessels. This highlights the growing adoption of close-in weapon systems in smaller naval platforms.
  • June 2023: Leonardo S.p.A. launched the LIONFISH 30 naval turret, expanding its small-caliber LIONFISH product line. This signifies the ongoing innovation and diversification of remote weapon system offerings.

Future Outlook for Naval Remote Weapon System Industry Market

The Naval Remote Weapon System market is poised for continued growth, driven by technological advancements, increasing defense budgets, and the growing need for enhanced naval capabilities. Strategic partnerships, investment in R&D, and the development of innovative technologies will be crucial for success in this dynamic market. The integration of autonomous systems and the development of next-generation weapons technologies will shape the industry’s future trajectory.

Naval Remote Weapon System Industry Segmentation

  • 1. Production Analysis
  • 2. Consumption Analysis
  • 3. Import Market Analysis (Value & Volume)
  • 4. Export Market Analysis (Value & Volume)
  • 5. Price Trend Analysis

Naval Remote Weapon System Industry Segmentation By Geography

  • 1. North America
    • 1.1. United States
    • 1.2. Canada
    • 1.3. Mexico
  • 2. South America
    • 2.1. Brazil
    • 2.2. Argentina
    • 2.3. Rest of South America
  • 3. Europe
    • 3.1. United Kingdom
    • 3.2. Germany
    • 3.3. France
    • 3.4. Italy
    • 3.5. Spain
    • 3.6. Russia
    • 3.7. Benelux
    • 3.8. Nordics
    • 3.9. Rest of Europe
  • 4. Middle East & Africa
    • 4.1. Turkey
    • 4.2. Israel
    • 4.3. GCC
    • 4.4. North Africa
    • 4.5. South Africa
    • 4.6. Rest of Middle East & Africa
  • 5. Asia Pacific
    • 5.1. China
    • 5.2. India
    • 5.3. Japan
    • 5.4. South Korea
    • 5.5. ASEAN
    • 5.6. Oceania
    • 5.7. Rest of Asia Pacific
Naval Remote Weapon System Industry Regional Share


Naval Remote Weapon System Industry REPORT HIGHLIGHTS

AspectsDetails
Study Period 2019-2033
Base Year 2024
Estimated Year 2025
Forecast Period2025-2033
Historical Period2019-2024
Growth RateCAGR of 7.32% from 2019-2033
Segmentation
    • By Production Analysis
    • By Consumption Analysis
    • By Import Market Analysis (Value & Volume)
    • By Export Market Analysis (Value & Volume)
    • By Price Trend Analysis
  • By Geography
    • North America
      • United States
      • Canada
      • Mexico
    • South America
      • Brazil
      • Argentina
      • Rest of South America
    • Europe
      • United Kingdom
      • Germany
      • France
      • Italy
      • Spain
      • Russia
      • Benelux
      • Nordics
      • Rest of Europe
    • Middle East & Africa
      • Turkey
      • Israel
      • GCC
      • North Africa
      • South Africa
      • Rest of Middle East & Africa
    • Asia Pacific
      • China
      • India
      • Japan
      • South Korea
      • ASEAN
      • Oceania
      • Rest of Asia Pacific


Table of Contents

  1. 1. Introduction
    • 1.1. Research Scope
    • 1.2. Market Segmentation
    • 1.3. Research Methodology
    • 1.4. Definitions and Assumptions
  2. 2. Executive Summary
    • 2.1. Introduction
  3. 3. Market Dynamics
    • 3.1. Introduction
      • 3.2. Market Drivers
        • 3.2.1. ; Increased Seaborne Threats And Ambiguous Maritime Security Policies; Increasing Adoption Of Security Technologies In Bric Countries
      • 3.3. Market Restrains
        • 3.3.1. ; High Risk Rate In Ungoverned Zones; Unstructured Security Standards And Technologies
      • 3.4. Market Trends
        • 3.4.1. Destroyers to Account for Largest Market Share During the Forecast Period
  4. 4. Market Factor Analysis
    • 4.1. Porters Five Forces
    • 4.2. Supply/Value Chain
    • 4.3. PESTEL analysis
    • 4.4. Market Entropy
    • 4.5. Patent/Trademark Analysis
  5. 5. Global Naval Remote Weapon System Industry Analysis, Insights and Forecast, 2019-2031
    • 5.1. Market Analysis, Insights and Forecast - by Production Analysis
      • 5.2. Market Analysis, Insights and Forecast - by Consumption Analysis
        • 5.3. Market Analysis, Insights and Forecast - by Import Market Analysis (Value & Volume)
          • 5.4. Market Analysis, Insights and Forecast - by Export Market Analysis (Value & Volume)
            • 5.5. Market Analysis, Insights and Forecast - by Price Trend Analysis
              • 5.6. Market Analysis, Insights and Forecast - by Region
                • 5.6.1. North America
                • 5.6.2. South America
                • 5.6.3. Europe
                • 5.6.4. Middle East & Africa
                • 5.6.5. Asia Pacific
            • 6. North America Naval Remote Weapon System Industry Analysis, Insights and Forecast, 2019-2031
              • 6.1. Market Analysis, Insights and Forecast - by Production Analysis
                • 6.2. Market Analysis, Insights and Forecast - by Consumption Analysis
                  • 6.3. Market Analysis, Insights and Forecast - by Import Market Analysis (Value & Volume)
                    • 6.4. Market Analysis, Insights and Forecast - by Export Market Analysis (Value & Volume)
                      • 6.5. Market Analysis, Insights and Forecast - by Price Trend Analysis
                      • 7. South America Naval Remote Weapon System Industry Analysis, Insights and Forecast, 2019-2031
                        • 7.1. Market Analysis, Insights and Forecast - by Production Analysis
                          • 7.2. Market Analysis, Insights and Forecast - by Consumption Analysis
                            • 7.3. Market Analysis, Insights and Forecast - by Import Market Analysis (Value & Volume)
                              • 7.4. Market Analysis, Insights and Forecast - by Export Market Analysis (Value & Volume)
                                • 7.5. Market Analysis, Insights and Forecast - by Price Trend Analysis
                                • 8. Europe Naval Remote Weapon System Industry Analysis, Insights and Forecast, 2019-2031
                                  • 8.1. Market Analysis, Insights and Forecast - by Production Analysis
                                    • 8.2. Market Analysis, Insights and Forecast - by Consumption Analysis
                                      • 8.3. Market Analysis, Insights and Forecast - by Import Market Analysis (Value & Volume)
                                        • 8.4. Market Analysis, Insights and Forecast - by Export Market Analysis (Value & Volume)
                                          • 8.5. Market Analysis, Insights and Forecast - by Price Trend Analysis
                                          • 9. Middle East & Africa Naval Remote Weapon System Industry Analysis, Insights and Forecast, 2019-2031
                                            • 9.1. Market Analysis, Insights and Forecast - by Production Analysis
                                              • 9.2. Market Analysis, Insights and Forecast - by Consumption Analysis
                                                • 9.3. Market Analysis, Insights and Forecast - by Import Market Analysis (Value & Volume)
                                                  • 9.4. Market Analysis, Insights and Forecast - by Export Market Analysis (Value & Volume)
                                                    • 9.5. Market Analysis, Insights and Forecast - by Price Trend Analysis
                                                    • 10. Asia Pacific Naval Remote Weapon System Industry Analysis, Insights and Forecast, 2019-2031
                                                      • 10.1. Market Analysis, Insights and Forecast - by Production Analysis
                                                        • 10.2. Market Analysis, Insights and Forecast - by Consumption Analysis
                                                          • 10.3. Market Analysis, Insights and Forecast - by Import Market Analysis (Value & Volume)
                                                            • 10.4. Market Analysis, Insights and Forecast - by Export Market Analysis (Value & Volume)
                                                              • 10.5. Market Analysis, Insights and Forecast - by Price Trend Analysis
                                                              • 11. North America Naval Remote Weapon System Industry Analysis, Insights and Forecast, 2019-2031
                                                                  • 11.1. Market Analysis, Insights and Forecast - By Country/Sub-region
                                                                    • 11.1.1 United States
                                                                    • 11.1.2 Canada
                                                              • 12. Europe Naval Remote Weapon System Industry Analysis, Insights and Forecast, 2019-2031
                                                                  • 12.1. Market Analysis, Insights and Forecast - By Country/Sub-region
                                                                    • 12.1.1 United Kingdom
                                                                    • 12.1.2 France
                                                                    • 12.1.3 Germany
                                                                    • 12.1.4 Russia
                                                                    • 12.1.5 Rest of Europe
                                                              • 13. Asia Pacific Naval Remote Weapon System Industry Analysis, Insights and Forecast, 2019-2031
                                                                  • 13.1. Market Analysis, Insights and Forecast - By Country/Sub-region
                                                                    • 13.1.1 China
                                                                    • 13.1.2 India
                                                                    • 13.1.3 Japan
                                                                    • 13.1.4 South Korea
                                                                    • 13.1.5 Rest of Asia Pacific
                                                              • 14. Rest of the World Naval Remote Weapon System Industry Analysis, Insights and Forecast, 2019-2031
                                                                  • 14.1. Market Analysis, Insights and Forecast - By Country/Sub-region
                                                                    • 14.1.1.
                                                              • 15. Competitive Analysis
                                                                • 15.1. Global Market Share Analysis 2024
                                                                  • 15.2. Company Profiles
                                                                    • 15.2.1 Elbit Systems Ltd
                                                                      • 15.2.1.1. Overview
                                                                      • 15.2.1.2. Products
                                                                      • 15.2.1.3. SWOT Analysis
                                                                      • 15.2.1.4. Recent Developments
                                                                      • 15.2.1.5. Financials (Based on Availability)
                                                                    • 15.2.2 Rostec
                                                                      • 15.2.2.1. Overview
                                                                      • 15.2.2.2. Products
                                                                      • 15.2.2.3. SWOT Analysis
                                                                      • 15.2.2.4. Recent Developments
                                                                      • 15.2.2.5. Financials (Based on Availability)
                                                                    • 15.2.3 General Dynamics Corporatio
                                                                      • 15.2.3.1. Overview
                                                                      • 15.2.3.2. Products
                                                                      • 15.2.3.3. SWOT Analysis
                                                                      • 15.2.3.4. Recent Developments
                                                                      • 15.2.3.5. Financials (Based on Availability)
                                                                    • 15.2.4 FN Herstal
                                                                      • 15.2.4.1. Overview
                                                                      • 15.2.4.2. Products
                                                                      • 15.2.4.3. SWOT Analysis
                                                                      • 15.2.4.4. Recent Developments
                                                                      • 15.2.4.5. Financials (Based on Availability)
                                                                    • 15.2.5 Rafael Advanced Defense Systems Ltd
                                                                      • 15.2.5.1. Overview
                                                                      • 15.2.5.2. Products
                                                                      • 15.2.5.3. SWOT Analysis
                                                                      • 15.2.5.4. Recent Developments
                                                                      • 15.2.5.5. Financials (Based on Availability)
                                                                    • 15.2.6 RTX Corporation
                                                                      • 15.2.6.1. Overview
                                                                      • 15.2.6.2. Products
                                                                      • 15.2.6.3. SWOT Analysis
                                                                      • 15.2.6.4. Recent Developments
                                                                      • 15.2.6.5. Financials (Based on Availability)
                                                                    • 15.2.7 Leonardo S p A
                                                                      • 15.2.7.1. Overview
                                                                      • 15.2.7.2. Products
                                                                      • 15.2.7.3. SWOT Analysis
                                                                      • 15.2.7.4. Recent Developments
                                                                      • 15.2.7.5. Financials (Based on Availability)
                                                                    • 15.2.8 Hanwha Systems Co Ltd
                                                                      • 15.2.8.1. Overview
                                                                      • 15.2.8.2. Products
                                                                      • 15.2.8.3. SWOT Analysis
                                                                      • 15.2.8.4. Recent Developments
                                                                      • 15.2.8.5. Financials (Based on Availability)
                                                                    • 15.2.9 Kongsberg Defence & Aerospace (Kongsberg Gruppen ASA)
                                                                      • 15.2.9.1. Overview
                                                                      • 15.2.9.2. Products
                                                                      • 15.2.9.3. SWOT Analysis
                                                                      • 15.2.9.4. Recent Developments
                                                                      • 15.2.9.5. Financials (Based on Availability)
                                                                    • 15.2.10 Saab AB
                                                                      • 15.2.10.1. Overview
                                                                      • 15.2.10.2. Products
                                                                      • 15.2.10.3. SWOT Analysis
                                                                      • 15.2.10.4. Recent Developments
                                                                      • 15.2.10.5. Financials (Based on Availability)
                                                                    • 15.2.11 ASELSAN A Ş
                                                                      • 15.2.11.1. Overview
                                                                      • 15.2.11.2. Products
                                                                      • 15.2.11.3. SWOT Analysis
                                                                      • 15.2.11.4. Recent Developments
                                                                      • 15.2.11.5. Financials (Based on Availability)

                                                              List of Figures

                                                              1. Figure 1: Global Naval Remote Weapon System Industry Revenue Breakdown (Million, %) by Region 2024 & 2032
                                                              2. Figure 2: North America Naval Remote Weapon System Industry Revenue (Million), by Country 2024 & 2032
                                                              3. Figure 3: North America Naval Remote Weapon System Industry Revenue Share (%), by Country 2024 & 2032
                                                              4. Figure 4: Europe Naval Remote Weapon System Industry Revenue (Million), by Country 2024 & 2032
                                                              5. Figure 5: Europe Naval Remote Weapon System Industry Revenue Share (%), by Country 2024 & 2032
                                                              6. Figure 6: Asia Pacific Naval Remote Weapon System Industry Revenue (Million), by Country 2024 & 2032
                                                              7. Figure 7: Asia Pacific Naval Remote Weapon System Industry Revenue Share (%), by Country 2024 & 2032
                                                              8. Figure 8: Rest of the World Naval Remote Weapon System Industry Revenue (Million), by Country 2024 & 2032
                                                              9. Figure 9: Rest of the World Naval Remote Weapon System Industry Revenue Share (%), by Country 2024 & 2032
                                                              10. Figure 10: North America Naval Remote Weapon System Industry Revenue (Million), by Production Analysis 2024 & 2032
                                                              11. Figure 11: North America Naval Remote Weapon System Industry Revenue Share (%), by Production Analysis 2024 & 2032
                                                              12. Figure 12: North America Naval Remote Weapon System Industry Revenue (Million), by Consumption Analysis 2024 & 2032
                                                              13. Figure 13: North America Naval Remote Weapon System Industry Revenue Share (%), by Consumption Analysis 2024 & 2032
                                                              14. Figure 14: North America Naval Remote Weapon System Industry Revenue (Million), by Import Market Analysis (Value & Volume) 2024 & 2032
                                                              15. Figure 15: North America Naval Remote Weapon System Industry Revenue Share (%), by Import Market Analysis (Value & Volume) 2024 & 2032
                                                              16. Figure 16: North America Naval Remote Weapon System Industry Revenue (Million), by Export Market Analysis (Value & Volume) 2024 & 2032
                                                              17. Figure 17: North America Naval Remote Weapon System Industry Revenue Share (%), by Export Market Analysis (Value & Volume) 2024 & 2032
                                                              18. Figure 18: North America Naval Remote Weapon System Industry Revenue (Million), by Price Trend Analysis 2024 & 2032
                                                              19. Figure 19: North America Naval Remote Weapon System Industry Revenue Share (%), by Price Trend Analysis 2024 & 2032
                                                              20. Figure 20: North America Naval Remote Weapon System Industry Revenue (Million), by Country 2024 & 2032
                                                              21. Figure 21: North America Naval Remote Weapon System Industry Revenue Share (%), by Country 2024 & 2032
                                                              22. Figure 22: South America Naval Remote Weapon System Industry Revenue (Million), by Production Analysis 2024 & 2032
                                                              23. Figure 23: South America Naval Remote Weapon System Industry Revenue Share (%), by Production Analysis 2024 & 2032
                                                              24. Figure 24: South America Naval Remote Weapon System Industry Revenue (Million), by Consumption Analysis 2024 & 2032
                                                              25. Figure 25: South America Naval Remote Weapon System Industry Revenue Share (%), by Consumption Analysis 2024 & 2032
                                                              26. Figure 26: South America Naval Remote Weapon System Industry Revenue (Million), by Import Market Analysis (Value & Volume) 2024 & 2032
                                                              27. Figure 27: South America Naval Remote Weapon System Industry Revenue Share (%), by Import Market Analysis (Value & Volume) 2024 & 2032
                                                              28. Figure 28: South America Naval Remote Weapon System Industry Revenue (Million), by Export Market Analysis (Value & Volume) 2024 & 2032
                                                              29. Figure 29: South America Naval Remote Weapon System Industry Revenue Share (%), by Export Market Analysis (Value & Volume) 2024 & 2032
                                                              30. Figure 30: South America Naval Remote Weapon System Industry Revenue (Million), by Price Trend Analysis 2024 & 2032
                                                              31. Figure 31: South America Naval Remote Weapon System Industry Revenue Share (%), by Price Trend Analysis 2024 & 2032
                                                              32. Figure 32: South America Naval Remote Weapon System Industry Revenue (Million), by Country 2024 & 2032
                                                              33. Figure 33: South America Naval Remote Weapon System Industry Revenue Share (%), by Country 2024 & 2032
                                                              34. Figure 34: Europe Naval Remote Weapon System Industry Revenue (Million), by Production Analysis 2024 & 2032
                                                              35. Figure 35: Europe Naval Remote Weapon System Industry Revenue Share (%), by Production Analysis 2024 & 2032
                                                              36. Figure 36: Europe Naval Remote Weapon System Industry Revenue (Million), by Consumption Analysis 2024 & 2032
                                                              37. Figure 37: Europe Naval Remote Weapon System Industry Revenue Share (%), by Consumption Analysis 2024 & 2032
                                                              38. Figure 38: Europe Naval Remote Weapon System Industry Revenue (Million), by Import Market Analysis (Value & Volume) 2024 & 2032
                                                              39. Figure 39: Europe Naval Remote Weapon System Industry Revenue Share (%), by Import Market Analysis (Value & Volume) 2024 & 2032
                                                              40. Figure 40: Europe Naval Remote Weapon System Industry Revenue (Million), by Export Market Analysis (Value & Volume) 2024 & 2032
                                                              41. Figure 41: Europe Naval Remote Weapon System Industry Revenue Share (%), by Export Market Analysis (Value & Volume) 2024 & 2032
                                                              42. Figure 42: Europe Naval Remote Weapon System Industry Revenue (Million), by Price Trend Analysis 2024 & 2032
                                                              43. Figure 43: Europe Naval Remote Weapon System Industry Revenue Share (%), by Price Trend Analysis 2024 & 2032
                                                              44. Figure 44: Europe Naval Remote Weapon System Industry Revenue (Million), by Country 2024 & 2032
                                                              45. Figure 45: Europe Naval Remote Weapon System Industry Revenue Share (%), by Country 2024 & 2032
                                                              46. Figure 46: Middle East & Africa Naval Remote Weapon System Industry Revenue (Million), by Production Analysis 2024 & 2032
                                                              47. Figure 47: Middle East & Africa Naval Remote Weapon System Industry Revenue Share (%), by Production Analysis 2024 & 2032
                                                              48. Figure 48: Middle East & Africa Naval Remote Weapon System Industry Revenue (Million), by Consumption Analysis 2024 & 2032
                                                              49. Figure 49: Middle East & Africa Naval Remote Weapon System Industry Revenue Share (%), by Consumption Analysis 2024 & 2032
                                                              50. Figure 50: Middle East & Africa Naval Remote Weapon System Industry Revenue (Million), by Import Market Analysis (Value & Volume) 2024 & 2032
                                                              51. Figure 51: Middle East & Africa Naval Remote Weapon System Industry Revenue Share (%), by Import Market Analysis (Value & Volume) 2024 & 2032
                                                              52. Figure 52: Middle East & Africa Naval Remote Weapon System Industry Revenue (Million), by Export Market Analysis (Value & Volume) 2024 & 2032
                                                              53. Figure 53: Middle East & Africa Naval Remote Weapon System Industry Revenue Share (%), by Export Market Analysis (Value & Volume) 2024 & 2032
                                                              54. Figure 54: Middle East & Africa Naval Remote Weapon System Industry Revenue (Million), by Price Trend Analysis 2024 & 2032
                                                              55. Figure 55: Middle East & Africa Naval Remote Weapon System Industry Revenue Share (%), by Price Trend Analysis 2024 & 2032
                                                              56. Figure 56: Middle East & Africa Naval Remote Weapon System Industry Revenue (Million), by Country 2024 & 2032
                                                              57. Figure 57: Middle East & Africa Naval Remote Weapon System Industry Revenue Share (%), by Country 2024 & 2032
                                                              58. Figure 58: Asia Pacific Naval Remote Weapon System Industry Revenue (Million), by Production Analysis 2024 & 2032
                                                              59. Figure 59: Asia Pacific Naval Remote Weapon System Industry Revenue Share (%), by Production Analysis 2024 & 2032
                                                              60. Figure 60: Asia Pacific Naval Remote Weapon System Industry Revenue (Million), by Consumption Analysis 2024 & 2032
                                                              61. Figure 61: Asia Pacific Naval Remote Weapon System Industry Revenue Share (%), by Consumption Analysis 2024 & 2032
                                                              62. Figure 62: Asia Pacific Naval Remote Weapon System Industry Revenue (Million), by Import Market Analysis (Value & Volume) 2024 & 2032
                                                              63. Figure 63: Asia Pacific Naval Remote Weapon System Industry Revenue Share (%), by Import Market Analysis (Value & Volume) 2024 & 2032
                                                              64. Figure 64: Asia Pacific Naval Remote Weapon System Industry Revenue (Million), by Export Market Analysis (Value & Volume) 2024 & 2032
                                                              65. Figure 65: Asia Pacific Naval Remote Weapon System Industry Revenue Share (%), by Export Market Analysis (Value & Volume) 2024 & 2032
                                                              66. Figure 66: Asia Pacific Naval Remote Weapon System Industry Revenue (Million), by Price Trend Analysis 2024 & 2032
                                                              67. Figure 67: Asia Pacific Naval Remote Weapon System Industry Revenue Share (%), by Price Trend Analysis 2024 & 2032
                                                              68. Figure 68: Asia Pacific Naval Remote Weapon System Industry Revenue (Million), by Country 2024 & 2032
                                                              69. Figure 69: Asia Pacific Naval Remote Weapon System Industry Revenue Share (%), by Country 2024 & 2032

                                                              List of Tables

                                                              1. Table 1: Global Naval Remote Weapon System Industry Revenue Million Forecast, by Region 2019 & 2032
                                                              2. Table 2: Global Naval Remote Weapon System Industry Revenue Million Forecast, by Production Analysis 2019 & 2032
                                                              3. Table 3: Global Naval Remote Weapon System Industry Revenue Million Forecast, by Consumption Analysis 2019 & 2032
                                                              4. Table 4: Global Naval Remote Weapon System Industry Revenue Million Forecast, by Import Market Analysis (Value & Volume) 2019 & 2032
                                                              5. Table 5: Global Naval Remote Weapon System Industry Revenue Million Forecast, by Export Market Analysis (Value & Volume) 2019 & 2032
                                                              6. Table 6: Global Naval Remote Weapon System Industry Revenue Million Forecast, by Price Trend Analysis 2019 & 2032
                                                              7. Table 7: Global Naval Remote Weapon System Industry Revenue Million Forecast, by Region 2019 & 2032
                                                              8. Table 8: Global Naval Remote Weapon System Industry Revenue Million Forecast, by Country 2019 & 2032
                                                              9. Table 9: United States Naval Remote Weapon System Industry Revenue (Million) Forecast, by Application 2019 & 2032
                                                              10. Table 10: Canada Naval Remote Weapon System Industry Revenue (Million) Forecast, by Application 2019 & 2032
                                                              11. Table 11: Global Naval Remote Weapon System Industry Revenue Million Forecast, by Country 2019 & 2032
                                                              12. Table 12: United Kingdom Naval Remote Weapon System Industry Revenue (Million) Forecast, by Application 2019 & 2032
                                                              13. Table 13: France Naval Remote Weapon System Industry Revenue (Million) Forecast, by Application 2019 & 2032
                                                              14. Table 14: Germany Naval Remote Weapon System Industry Revenue (Million) Forecast, by Application 2019 & 2032
                                                              15. Table 15: Russia Naval Remote Weapon System Industry Revenue (Million) Forecast, by Application 2019 & 2032
                                                              16. Table 16: Rest of Europe Naval Remote Weapon System Industry Revenue (Million) Forecast, by Application 2019 & 2032
                                                              17. Table 17: Global Naval Remote Weapon System Industry Revenue Million Forecast, by Country 2019 & 2032
                                                              18. Table 18: China Naval Remote Weapon System Industry Revenue (Million) Forecast, by Application 2019 & 2032
                                                              19. Table 19: India Naval Remote Weapon System Industry Revenue (Million) Forecast, by Application 2019 & 2032
                                                              20. Table 20: Japan Naval Remote Weapon System Industry Revenue (Million) Forecast, by Application 2019 & 2032
                                                              21. Table 21: South Korea Naval Remote Weapon System Industry Revenue (Million) Forecast, by Application 2019 & 2032
                                                              22. Table 22: Rest of Asia Pacific Naval Remote Weapon System Industry Revenue (Million) Forecast, by Application 2019 & 2032
                                                              23. Table 23: Global Naval Remote Weapon System Industry Revenue Million Forecast, by Country 2019 & 2032
                                                              24. Table 24: Naval Remote Weapon System Industry Revenue (Million) Forecast, by Application 2019 & 2032
                                                              25. Table 25: Global Naval Remote Weapon System Industry Revenue Million Forecast, by Production Analysis 2019 & 2032
                                                              26. Table 26: Global Naval Remote Weapon System Industry Revenue Million Forecast, by Consumption Analysis 2019 & 2032
                                                              27. Table 27: Global Naval Remote Weapon System Industry Revenue Million Forecast, by Import Market Analysis (Value & Volume) 2019 & 2032
                                                              28. Table 28: Global Naval Remote Weapon System Industry Revenue Million Forecast, by Export Market Analysis (Value & Volume) 2019 & 2032
                                                              29. Table 29: Global Naval Remote Weapon System Industry Revenue Million Forecast, by Price Trend Analysis 2019 & 2032
                                                              30. Table 30: Global Naval Remote Weapon System Industry Revenue Million Forecast, by Country 2019 & 2032
                                                              31. Table 31: United States Naval Remote Weapon System Industry Revenue (Million) Forecast, by Application 2019 & 2032
                                                              32. Table 32: Canada Naval Remote Weapon System Industry Revenue (Million) Forecast, by Application 2019 & 2032
                                                              33. Table 33: Mexico Naval Remote Weapon System Industry Revenue (Million) Forecast, by Application 2019 & 2032
                                                              34. Table 34: Global Naval Remote Weapon System Industry Revenue Million Forecast, by Production Analysis 2019 & 2032
                                                              35. Table 35: Global Naval Remote Weapon System Industry Revenue Million Forecast, by Consumption Analysis 2019 & 2032
                                                              36. Table 36: Global Naval Remote Weapon System Industry Revenue Million Forecast, by Import Market Analysis (Value & Volume) 2019 & 2032
                                                              37. Table 37: Global Naval Remote Weapon System Industry Revenue Million Forecast, by Export Market Analysis (Value & Volume) 2019 & 2032
                                                              38. Table 38: Global Naval Remote Weapon System Industry Revenue Million Forecast, by Price Trend Analysis 2019 & 2032
                                                              39. Table 39: Global Naval Remote Weapon System Industry Revenue Million Forecast, by Country 2019 & 2032
                                                              40. Table 40: Brazil Naval Remote Weapon System Industry Revenue (Million) Forecast, by Application 2019 & 2032
                                                              41. Table 41: Argentina Naval Remote Weapon System Industry Revenue (Million) Forecast, by Application 2019 & 2032
                                                              42. Table 42: Rest of South America Naval Remote Weapon System Industry Revenue (Million) Forecast, by Application 2019 & 2032
                                                              43. Table 43: Global Naval Remote Weapon System Industry Revenue Million Forecast, by Production Analysis 2019 & 2032
                                                              44. Table 44: Global Naval Remote Weapon System Industry Revenue Million Forecast, by Consumption Analysis 2019 & 2032
                                                              45. Table 45: Global Naval Remote Weapon System Industry Revenue Million Forecast, by Import Market Analysis (Value & Volume) 2019 & 2032
                                                              46. Table 46: Global Naval Remote Weapon System Industry Revenue Million Forecast, by Export Market Analysis (Value & Volume) 2019 & 2032
                                                              47. Table 47: Global Naval Remote Weapon System Industry Revenue Million Forecast, by Price Trend Analysis 2019 & 2032
                                                              48. Table 48: Global Naval Remote Weapon System Industry Revenue Million Forecast, by Country 2019 & 2032
                                                              49. Table 49: United Kingdom Naval Remote Weapon System Industry Revenue (Million) Forecast, by Application 2019 & 2032
                                                              50. Table 50: Germany Naval Remote Weapon System Industry Revenue (Million) Forecast, by Application 2019 & 2032
                                                              51. Table 51: France Naval Remote Weapon System Industry Revenue (Million) Forecast, by Application 2019 & 2032
                                                              52. Table 52: Italy Naval Remote Weapon System Industry Revenue (Million) Forecast, by Application 2019 & 2032
                                                              53. Table 53: Spain Naval Remote Weapon System Industry Revenue (Million) Forecast, by Application 2019 & 2032
                                                              54. Table 54: Russia Naval Remote Weapon System Industry Revenue (Million) Forecast, by Application 2019 & 2032
                                                              55. Table 55: Benelux Naval Remote Weapon System Industry Revenue (Million) Forecast, by Application 2019 & 2032
                                                              56. Table 56: Nordics Naval Remote Weapon System Industry Revenue (Million) Forecast, by Application 2019 & 2032
                                                              57. Table 57: Rest of Europe Naval Remote Weapon System Industry Revenue (Million) Forecast, by Application 2019 & 2032
                                                              58. Table 58: Global Naval Remote Weapon System Industry Revenue Million Forecast, by Production Analysis 2019 & 2032
                                                              59. Table 59: Global Naval Remote Weapon System Industry Revenue Million Forecast, by Consumption Analysis 2019 & 2032
                                                              60. Table 60: Global Naval Remote Weapon System Industry Revenue Million Forecast, by Import Market Analysis (Value & Volume) 2019 & 2032
                                                              61. Table 61: Global Naval Remote Weapon System Industry Revenue Million Forecast, by Export Market Analysis (Value & Volume) 2019 & 2032
                                                              62. Table 62: Global Naval Remote Weapon System Industry Revenue Million Forecast, by Price Trend Analysis 2019 & 2032
                                                              63. Table 63: Global Naval Remote Weapon System Industry Revenue Million Forecast, by Country 2019 & 2032
                                                              64. Table 64: Turkey Naval Remote Weapon System Industry Revenue (Million) Forecast, by Application 2019 & 2032
                                                              65. Table 65: Israel Naval Remote Weapon System Industry Revenue (Million) Forecast, by Application 2019 & 2032
                                                              66. Table 66: GCC Naval Remote Weapon System Industry Revenue (Million) Forecast, by Application 2019 & 2032
                                                              67. Table 67: North Africa Naval Remote Weapon System Industry Revenue (Million) Forecast, by Application 2019 & 2032
                                                              68. Table 68: South Africa Naval Remote Weapon System Industry Revenue (Million) Forecast, by Application 2019 & 2032
                                                              69. Table 69: Rest of Middle East & Africa Naval Remote Weapon System Industry Revenue (Million) Forecast, by Application 2019 & 2032
                                                              70. Table 70: Global Naval Remote Weapon System Industry Revenue Million Forecast, by Production Analysis 2019 & 2032
                                                              71. Table 71: Global Naval Remote Weapon System Industry Revenue Million Forecast, by Consumption Analysis 2019 & 2032
                                                              72. Table 72: Global Naval Remote Weapon System Industry Revenue Million Forecast, by Import Market Analysis (Value & Volume) 2019 & 2032
                                                              73. Table 73: Global Naval Remote Weapon System Industry Revenue Million Forecast, by Export Market Analysis (Value & Volume) 2019 & 2032
                                                              74. Table 74: Global Naval Remote Weapon System Industry Revenue Million Forecast, by Price Trend Analysis 2019 & 2032
                                                              75. Table 75: Global Naval Remote Weapon System Industry Revenue Million Forecast, by Country 2019 & 2032
                                                              76. Table 76: China Naval Remote Weapon System Industry Revenue (Million) Forecast, by Application 2019 & 2032
                                                              77. Table 77: India Naval Remote Weapon System Industry Revenue (Million) Forecast, by Application 2019 & 2032
                                                              78. Table 78: Japan Naval Remote Weapon System Industry Revenue (Million) Forecast, by Application 2019 & 2032
                                                              79. Table 79: South Korea Naval Remote Weapon System Industry Revenue (Million) Forecast, by Application 2019 & 2032
                                                              80. Table 80: ASEAN Naval Remote Weapon System Industry Revenue (Million) Forecast, by Application 2019 & 2032
                                                              81. Table 81: Oceania Naval Remote Weapon System Industry Revenue (Million) Forecast, by Application 2019 & 2032
                                                              82. Table 82: Rest of Asia Pacific Naval Remote Weapon System Industry Revenue (Million) Forecast, by Application 2019 & 2032


                                                              Frequently Asked Questions

                                                              1. What is the projected Compound Annual Growth Rate (CAGR) of the Naval Remote Weapon System Industry?

                                                              The projected CAGR is approximately 7.32%.

                                                              2. Which companies are prominent players in the Naval Remote Weapon System Industry?

                                                              Key companies in the market include Elbit Systems Ltd, Rostec, General Dynamics Corporatio, FN Herstal, Rafael Advanced Defense Systems Ltd, RTX Corporation, Leonardo S p A, Hanwha Systems Co Ltd, Kongsberg Defence & Aerospace (Kongsberg Gruppen ASA), Saab AB, ASELSAN A Ş.

                                                              3. What are the main segments of the Naval Remote Weapon System Industry?

                                                              The market segments include Production Analysis, Consumption Analysis, Import Market Analysis (Value & Volume), Export Market Analysis (Value & Volume), Price Trend Analysis.

                                                              4. Can you provide details about the market size?

                                                              The market size is estimated to be USD 3.41 Million as of 2022.

                                                              5. What are some drivers contributing to market growth?

                                                              ; Increased Seaborne Threats And Ambiguous Maritime Security Policies; Increasing Adoption Of Security Technologies In Bric Countries.

                                                              6. What are the notable trends driving market growth?

                                                              Destroyers to Account for Largest Market Share During the Forecast Period.

                                                              7. Are there any restraints impacting market growth?

                                                              ; High Risk Rate In Ungoverned Zones; Unstructured Security Standards And Technologies.

                                                              8. Can you provide examples of recent developments in the market?

                                                              July 2023: Unirobotics, a Turkish defense company, announced that it is expected to deliver four units of its Trakon Targan RCS to ASFAT to be fitted on board two Hisar-class offshore patrol vessels. Trakon Targan is designed as a close-in weapon system onboard naval vessels to engage air and surface targets.

                                                              9. What pricing options are available for accessing the report?

                                                              Pricing options include single-user, multi-user, and enterprise licenses priced at USD 4750, USD 5250, and USD 8750 respectively.

                                                              10. Is the market size provided in terms of value or volume?

                                                              The market size is provided in terms of value, measured in Million.

                                                              11. Are there any specific market keywords associated with the report?

                                                              Yes, the market keyword associated with the report is "Naval Remote Weapon System Industry," which aids in identifying and referencing the specific market segment covered.

                                                              12. How do I determine which pricing option suits my needs best?

                                                              The pricing options vary based on user requirements and access needs. Individual users may opt for single-user licenses, while businesses requiring broader access may choose multi-user or enterprise licenses for cost-effective access to the report.

                                                              13. Are there any additional resources or data provided in the Naval Remote Weapon System Industry report?

                                                              While the report offers comprehensive insights, it's advisable to review the specific contents or supplementary materials provided to ascertain if additional resources or data are available.

                                                              14. How can I stay updated on further developments or reports in the Naval Remote Weapon System Industry?

                                                              To stay informed about further developments, trends, and reports in the Naval Remote Weapon System Industry, consider subscribing to industry newsletters, following relevant companies and organizations, or regularly checking reputable industry news sources and publications.


                                                              Methodology

                                                              Step 1 - Identification of Relevant Samples Size from Population Database

                                                              Step Chart
                                                              Bar Chart
                                                              Method Chart

                                                              Step 2 - Approaches for Defining Global Market Size (Value, Volume* & Price*)

                                                              Approach Chart
                                                              Top-down and bottom-up approaches are used to validate the global market size and estimate the market size for manufactures, regional segments, product, and application.

                                                              Note*: In applicable scenarios

                                                              Step 3 - Data Sources

                                                              Primary Research

                                                              • Web Analytics
                                                              • Survey Reports
                                                              • Research Institute
                                                              • Latest Research Reports
                                                              • Opinion Leaders

                                                              Secondary Research

                                                              • Annual Reports
                                                              • White Paper
                                                              • Latest Press Release
                                                              • Industry Association
                                                              • Paid Database
                                                              • Investor Presentations
                                                              Analyst Chart

                                                              Step 4 - Data Triangulation

                                                              Involves using different sources of information in order to increase the validity of a study

                                                              These sources are likely to be stakeholders in a program - participants, other researchers, program staff, other community members, and so on.

                                                              Then we put all data in single framework & apply various statistical tools to find out the dynamic on the market.

                                                              During the analysis stage, feedback from the stakeholder groups would be compared to determine areas of agreement as well as areas of divergence

                                                              Additionally, after gathering mixed and scattered data from a wide range of sources, data is triangulated and correlated to come up with estimated figures which are further validated through primary mediums or industry experts, opinion leaders.

                                                              About Report Pinnacle

                                                              Report Pinnacle provides top-tier market research, industry intelligence, and actionable insights for finance, technology, healthcare, and consumer sectors. Our reports empower you to make informed decisions and achieve business success.

                                                              Our expert team combines primary research, data analytics, and industry knowledge to deliver insights you can trust. We offer syndicated reports, custom research, and consulting services tailored to your unique business needs.

                                                              At Report Pinnacle, we are committed to quality, transparency, and client satisfaction. Every report is rigorously validated to ensure accuracy and relevance. Our global perspective and local expertise help you understand both broad trends and detailed market shifts.

                                                              Stay ahead with Report Pinnacle. Subscribe to our newsletter for the latest insights and research highlights, and follow us on social media for real-time updates.

                                                              Report Pinnacle – Your Partner for Reaching the Top in Market Intelligence.

                                                              artwork spiralartwork spiralRelated Reports
                                                              artwork underline

                                                              Strategic Insights for Military Electro-optical and Infrared Systems Market Market Expansion

                                                              The Military Electro-optical and Infrared (EO/IR) Systems market is booming, projected to reach [estimated 2033 value based on CAGR] by 2033. Driven by geopolitical tensions and technological advancements, this report analyzes market size, growth, key players (L3Harris, Raytheon, Thales), and regional trends. Discover insights into the future of EO/IR systems in defense.

                                                              July 2025
                                                              Base Year: 2024
                                                              No Of Pages: 234
                                                              Price: $4750

                                                              Analyzing Drone Camera Market: Opportunities and Growth Patterns 2025-2033

                                                              The drone camera market is booming, projected to reach \$10.96 billion in 2025, with a CAGR of 18.28% through 2033. Explore market drivers, trends, restraints, and key players in this explosive sector. Discover insights into regional market share and future growth projections for high-resolution drone cameras.

                                                              July 2025
                                                              Base Year: 2024
                                                              No Of Pages: 234
                                                              Price: $4750

                                                              Commercial Aircraft Windows and Windshields Industry and Emerging Technologies: Growth Insights 2025-2033

                                                              Discover the booming commercial aircraft windows and windshields market! This in-depth analysis reveals a CAGR exceeding 3%, driven by surging air travel and technological advancements. Explore key players, regional trends, and future growth projections for 2025-2033.

                                                              July 2025
                                                              Base Year: 2024
                                                              No Of Pages: 234
                                                              Price: $4750

                                                              North America Commercial Aviation Market Industry’s Growth Dynamics and Insights

                                                              Discover the North American commercial aviation market's growth trajectory and key players. This in-depth analysis reveals market size, CAGR, and regional breakdowns, highlighting trends and challenges for passenger and freighter aircraft through 2033. Explore market segmentation, competitive landscapes, and future projections.

                                                              July 2025
                                                              Base Year: 2024
                                                              No Of Pages: 197
                                                              Price: $3800

                                                              Future Prospects for Asia-Pacific Commercial Aircraft Cabin Seating Market Growth

                                                              The Asia-Pacific commercial aircraft cabin seating market is booming, projected to reach $XX million by 2033 with a 7.32% CAGR. Driven by rising air travel and economic growth in key nations like China and India, this report analyzes market trends, key players (Safran, Recaro, Expliseat), and regional segmentation. Discover growth opportunities and challenges in this dynamic industry.

                                                              July 2025
                                                              Base Year: 2024
                                                              No Of Pages: 197
                                                              Price: $3800

                                                              Aircraft Health Monitoring Systems Industry 2025-2033 Market Analysis: Trends, Dynamics, and Growth Opportunities

                                                              Discover the booming Aircraft Health Monitoring Systems market! This in-depth analysis reveals a CAGR of 6% through 2033, driven by predictive maintenance, safety regulations, and technological advancements. Explore key players, regional trends, and future growth projections for this dynamic sector.

                                                              July 2025
                                                              Base Year: 2024
                                                              No Of Pages: 234
                                                              Price: $4750

                                                              Aircraft Exhaust Systems Market Industry’s Future Growth Prospects

                                                              The Aircraft Exhaust Systems Market is booming, projected to reach \$1.78 Billion by 2033 with a 6.49% CAGR. Driven by rising air travel and stringent emission regulations, this report analyzes market trends, key players (Safran, Triumph Group, GKN Aerospace), and regional growth (North America, Europe, Asia-Pacific). Discover key insights and future projections for this expanding sector.

                                                              July 2025
                                                              Base Year: 2024
                                                              No Of Pages: 234
                                                              Price: $4750

                                                              Active Protection Systems Market Market’s Growth Catalysts

                                                              The Active Protection Systems (APS) market is booming, projected to reach $7 billion by 2033 with a 6.06% CAGR. This in-depth analysis explores market drivers, trends, restraints, key players (Thales, General Dynamics, Rheinmetall), and regional breakdowns (North America, Europe, Asia-Pacific). Discover the future of military vehicle protection.

                                                              July 2025
                                                              Base Year: 2024
                                                              No Of Pages: 234
                                                              Price: $4750

                                                              Consumer-Centric Trends in Middle-East and Africa Aircraft MRO Industry Industry

                                                              The Middle East & Africa Aircraft MRO market is booming, with a CAGR exceeding 4% through 2033. Driven by rising air travel and fleet expansion, this report analyzes market size, key players (Ethiopian Airlines, Lufthansa Technik AG, etc.), regional trends, and growth opportunities in commercial, military, and general aviation sectors. Discover the challenges and potential within this dynamic industry.

                                                              July 2025
                                                              Base Year: 2024
                                                              No Of Pages: 234
                                                              Price: $4750

                                                              Southeast Asia Commercial Aircraft MRO Market Future-Proof Strategies: Market Trends 2025-2033

                                                              The Southeast Asia Commercial Aircraft MRO market is booming, projected to reach $3.77 billion by 2025, with a CAGR of 11.47%. Discover key drivers, trends, and challenges shaping this dynamic industry, including insights into leading companies and regional market share. Explore growth opportunities in airframe, engine, and component MRO across narrowbody and widebody aircraft.

                                                              July 2025
                                                              Base Year: 2024
                                                              No Of Pages: 234
                                                              Price: $4750

                                                              Turboprop Engine Market Trends and Forecast 2025-2033

                                                              The turboprop engine market is booming, projected to reach \$31.89 billion by 2033 with a CAGR of 3.71%. Explore key drivers, trends, and regional market shares for this high-growth sector, dominated by Honeywell, Safran, and others. Discover the impact of technological advancements and increasing demand for fuel-efficient aircraft.

                                                              July 2025
                                                              Base Year: 2024
                                                              No Of Pages: 234
                                                              Price: $4750

                                                              Unveiling Low Cost Carrier Market Growth Patterns: CAGR Analysis and Forecasts 2025-2033

                                                              Discover the booming low-cost carrier market! Explore its 10% CAGR, key drivers, regional trends, leading companies like Ryanair & Southwest, and future projections to 2033. Get insights into market segmentation, challenges, and opportunities in this dynamic industry.

                                                              July 2025
                                                              Base Year: 2024
                                                              No Of Pages: 234
                                                              Price: $4750

                                                              Commercial Aircraft Floor Panels Market 2025-2033 Analysis: Trends, Competitor Dynamics, and Growth Opportunities

                                                              The global commercial aircraft floor panels market is booming, projected to reach \$392.64 million by 2025 and grow at a CAGR of 4.67% until 2033. Driven by increasing air travel and demand for lightweight, durable materials, key players like Airbus and Boeing are shaping this lucrative sector. Explore market trends, segment analysis, and regional insights.

                                                              July 2025
                                                              Base Year: 2024
                                                              No Of Pages: 234
                                                              Price: $4750

                                                              Electronically Scanned Array Radar Market 2025-2033 Analysis: Trends, Competitor Dynamics, and Growth Opportunities

                                                              The Electronically Scanned Array (ESA) Radar Market is booming, with a CAGR of 6.45%! Discover key trends, leading companies like Raytheon and Thales, and regional market insights in this comprehensive analysis projecting growth to 2033. Learn about active vs. passive ESA, land, air, and sea applications, and the impact of AI and autonomous systems.

                                                              July 2025
                                                              Base Year: 2024
                                                              No Of Pages: 234
                                                              Price: $4750

                                                              Decoding Aircraft Engine Blades Market’s Market Size Potential by 2033

                                                              Discover the booming Aircraft Engine Blades market, projected to surpass $XX million by 2033 with a CAGR exceeding 5.5%! This in-depth analysis explores market drivers, trends, restraints, and key players like Raytheon, GE, and Safran, covering segments like blade type, application, and materials. Get insights into regional market shares and future growth predictions.

                                                              July 2025
                                                              Base Year: 2024
                                                              No Of Pages: 234
                                                              Price: $4750

                                                              Flight Data Monitoring Industry 2025-2033 Market Analysis: Trends, Dynamics, and Growth Opportunities

                                                              The Flight Data Monitoring (FDM) market is booming, exceeding a $1.5 Billion valuation in 2025 and projected for significant growth through 2033. Discover key drivers, trends, and regional market shares in this in-depth analysis covering major players and technological advancements in flight safety and operational efficiency.

                                                              July 2025
                                                              Base Year: 2024
                                                              No Of Pages: 234
                                                              Price: $4750

                                                              Military Transport Aircraft Market Market Expansion: Growth Outlook 2025-2033

                                                              The Military Transport Aircraft Market is booming, projected to reach $43.56 billion by 2033 with a 7.09% CAGR. Discover key drivers, trends, and regional insights, including major players like Boeing and Lockheed Martin. Analyze market segmentation and future growth projections in this comprehensive report.

                                                              July 2025
                                                              Base Year: 2024
                                                              No Of Pages: 234
                                                              Price: $4750

                                                              Analyzing Competitor Moves: Eastern Europe Defense Market Growth Outlook 2025-2033

                                                              The Eastern European defense market is booming, projected to reach [estimated 2033 value] by 2033, driven by geopolitical tensions and modernization efforts. Discover key trends, growth drivers, and leading companies shaping this dynamic sector.

                                                              July 2025
                                                              Base Year: 2024
                                                              No Of Pages: 210
                                                              Price: $4750

                                                              LEO Satellite Market Analysis 2025 and Forecasts 2033: Unveiling Growth Opportunities

                                                              Discover the booming LEO Satellite market! This in-depth analysis reveals a 3.52% CAGR, key drivers, trends, and restraints, examining segments by application (communication, Earth observation), satellite mass, end-user, and propulsion technology. Explore leading companies like SpaceX and Airbus and regional market shares. Project your strategic moves with our comprehensive forecast to 2033.

                                                              July 2025
                                                              Base Year: 2024
                                                              No Of Pages: 197
                                                              Price: $3800

                                                              Space Sensors And Actuators Market Soars to XXX Million, witnessing a CAGR of XX during the forecast period 2025-2033

                                                              The Space Sensors and Actuators market is booming, projected to reach $8.84 billion by 2033 with a 13.40% CAGR. Explore key drivers, trends, and regional insights in this comprehensive market analysis, featuring leading companies like Honeywell and Moog. Discover the growth potential across segments like satellites, rovers, and launch vehicles.

                                                              July 2025
                                                              Base Year: 2024
                                                              No Of Pages: 234
                                                              Price: $4750
                                                              • Home
                                                              • About Us
                                                              • Industries
                                                                • Aerospace & Defense
                                                                • Agriculture
                                                                • Animal Nutrition & Wellness
                                                                • Automotive
                                                                • Chemicals & Materials
                                                                • Consumer Goods and Services
                                                                • Energy & Power
                                                                • Financial Services and Investment Intelligence
                                                                • Food & Beverage
                                                                • Home and Property Improvement
                                                                • Hospitality and Tourism
                                                                • Logistics
                                                                • Manufacturing Products and Services
                                                                • Packaging
                                                                • Professional and Commercial Services
                                                                • Real Estate and Construction
                                                                • Retail
                                                                • Technology, Media and Telecom
                                                                • Healthcare
                                                              • Services
                                                              • Contact
                                                              Main Logo
                                                              • Home
                                                              • About Us
                                                              • Industries
                                                                • Aerospace & Defense
                                                                • Agriculture
                                                                • Animal Nutrition & Wellness
                                                                • Automotive
                                                                • Chemicals & Materials
                                                                • Consumer Goods and Services
                                                                • Energy & Power
                                                                • Financial Services and Investment Intelligence
                                                                • Food & Beverage
                                                                • Home and Property Improvement
                                                                • Hospitality and Tourism
                                                                • Logistics
                                                                • Manufacturing Products and Services
                                                                • Packaging
                                                                • Professional and Commercial Services
                                                                • Real Estate and Construction
                                                                • Retail
                                                                • Technology, Media and Telecom
                                                                • Healthcare
                                                              • Services
                                                              • Contact
                                                              +17162654855
                                                              [email protected]

                                                              +17162654855

                                                              [email protected]

                                                              Business Address

                                                              Head Office

                                                              Office no. A 5010, fifth floor, Solitaire Business Hub, Near Phoenix mall, Pune, Maharashtra 411014

                                                              Contact Information

                                                              Craig Francis

                                                              Business Development Head

                                                              +17162654855

                                                              [email protected]

                                                              Connect With Us

                                                              Secure Payment Partners

                                                              payment image
                                                              RetailLogisticsPackagingAutomotiveHealthcareAgricultureEnergy & PowerFood & BeverageAerospace & DefenseChemicals & MaterialsHospitality and TourismAnimal Nutrition & WellnessConsumer Goods and ServicesReal Estate and ConstructionHome and Property ImprovementTechnology, Media and TelecomManufacturing Products and ServicesFinancial Services and Investment Intelligence

                                                              © 2025 All rights reserved


                                                              Privacy Policy
                                                              Terms and Conditions
                                                              FAQ