
Key Insights
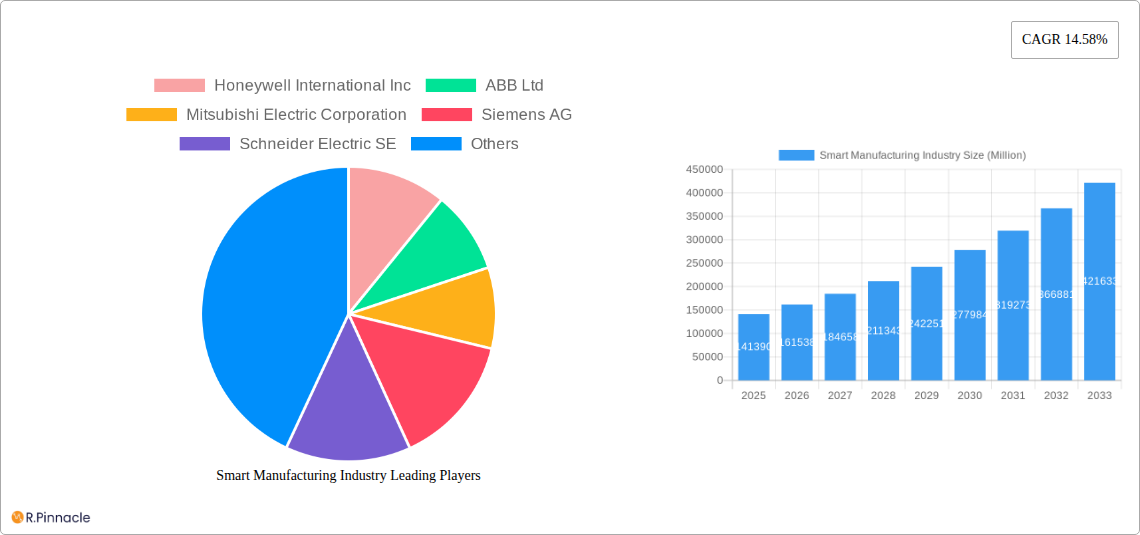
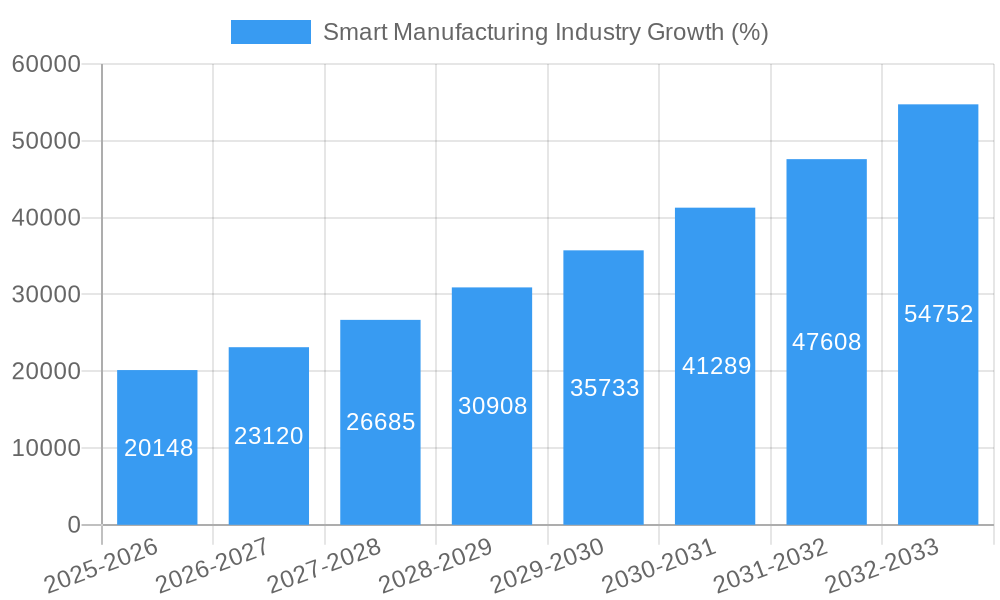
The global smart manufacturing market, valued at $141.39 billion in 2025, is experiencing robust growth, projected to expand at a Compound Annual Growth Rate (CAGR) of 14.58% from 2025 to 2033. This surge is driven by several key factors. Increased automation, fueled by advancements in robotics, machine vision systems, and sophisticated control devices, is boosting productivity and efficiency across diverse manufacturing sectors. The adoption of Industrial Internet of Things (IIoT) technologies, including PLCs, SCADA systems, and MES solutions, enables real-time data analysis and predictive maintenance, minimizing downtime and optimizing resource allocation. Furthermore, the growing demand for enhanced product quality, traceability, and customization is pushing manufacturers towards smart manufacturing solutions. The automotive, semiconductor, and oil & gas industries are leading the adoption curve, followed by pharmaceuticals, aerospace, and food & beverage. However, high initial investment costs and the need for skilled workforce remain key restraints to widespread adoption, particularly in smaller enterprises. Overcoming these hurdles through strategic partnerships, government incentives, and skill development programs will be crucial for accelerating the market's growth trajectory.
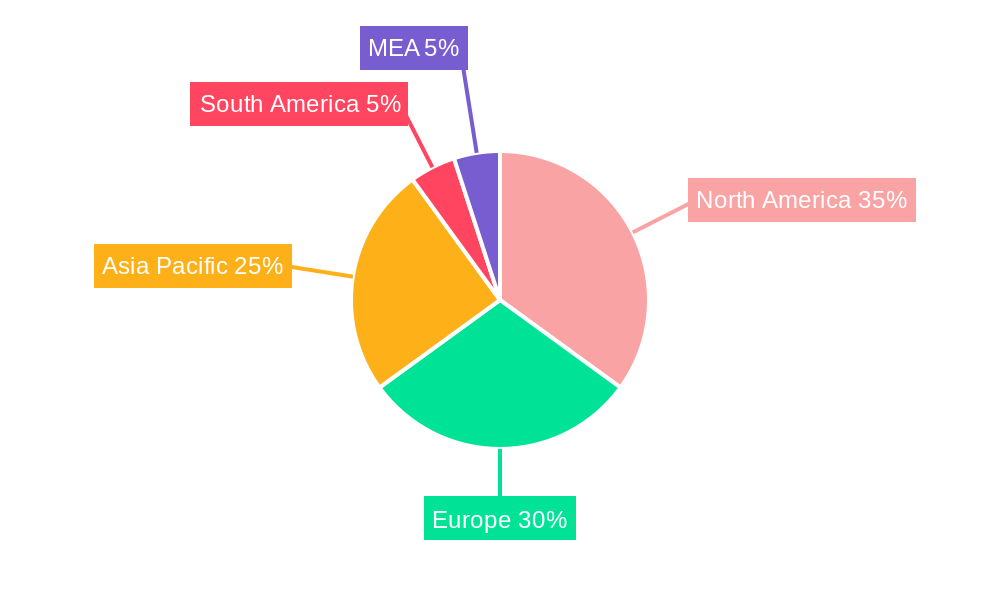
The geographical distribution of the market reveals significant regional variations. North America and Europe currently hold substantial market shares due to established technological infrastructure and early adoption. However, the Asia-Pacific region, driven by rapid industrialization and technological advancements in countries like China, India, and South Korea, is poised for the fastest growth in the coming years. Competition is intense, with established players like Honeywell, ABB, Siemens, and Rockwell Automation vying for market leadership alongside emerging technology providers. The future of smart manufacturing will likely be shaped by the convergence of Artificial Intelligence (AI), machine learning, and cloud computing, creating even more intelligent and adaptable manufacturing environments. This will further drive the need for advanced cybersecurity measures and data management strategies to protect sensitive operational data and intellectual property.
This comprehensive report provides a detailed analysis of the Smart Manufacturing industry, encompassing market size, segmentation, growth drivers, challenges, and future outlook. The report covers the period from 2019 to 2033, with a focus on the estimated year 2025 and forecast period 2025-2033. The study includes in-depth analysis of key players like Honeywell International Inc, ABB Ltd, Mitsubishi Electric Corporation, Siemens AG, Schneider Electric SE, Fanuc Corporation, Robert Bosch GmbH, Texas Instruments Incorporated, Rockwell Automation Inc, Yokogawa Electric Corporation, General Electric Company, and Emerson Electric Company, and examines various technology and component segments across diverse end-user industries. The market is projected to reach $XX Million by 2033.
Smart Manufacturing Industry Market Structure & Innovation Trends
The smart manufacturing market exhibits a moderately concentrated structure, with a few major players holding significant market share. Honeywell, ABB, and Siemens, for example, collectively control an estimated xx% of the global market in 2025. Innovation is driven by the need for increased efficiency, reduced costs, improved product quality, and enhanced supply chain resilience. Stringent regulatory frameworks related to environmental sustainability and data security are also shaping industry practices. Product substitutes, such as traditional manufacturing methods, face increasing competition due to the superior efficiency and flexibility offered by smart manufacturing solutions. The end-user demographics are diverse, spanning across various industries, with automotive, semiconductors, and oil & gas being prominent sectors. Mergers and acquisitions (M&A) are frequent, with deal values exceeding $XX Million in recent years, reflecting the consolidation trend within the industry. For instance, the combined market capitalization of the top five players in 2024 is estimated to be over $XX Million.
- Market Share: Top 5 players hold approximately xx% of the market (2025 estimate).
- M&A Activity: Significant M&A activity observed, with deal values exceeding $XX Million annually in the historical period.
- Regulatory Landscape: Stringent regulations drive innovation in areas such as sustainability and data security.
- Innovation Drivers: Efficiency gains, cost reduction, enhanced product quality, and supply chain resilience are key drivers.
Smart Manufacturing Industry Market Dynamics & Trends
The smart manufacturing market is experiencing robust growth, driven by the increasing adoption of Industry 4.0 technologies across various sectors. The compound annual growth rate (CAGR) is projected to be xx% during the forecast period (2025-2033). Key growth drivers include the rising demand for automation, the proliferation of IoT devices and data analytics capabilities, and the increasing need for real-time visibility across the supply chain. Technological disruptions, such as the advancements in artificial intelligence (AI), machine learning (ML), and cloud computing are further accelerating market growth. Consumer preferences are shifting towards customized products with shorter lead times, which smart manufacturing excels at delivering. The competitive landscape is dynamic, with both established players and emerging technology companies vying for market share. Market penetration of smart manufacturing solutions remains relatively low in certain sectors, presenting significant untapped potential.
Dominant Regions & Segments in Smart Manufacturing Industry
The North American and European regions currently dominate the smart manufacturing market, driven by high technology adoption rates, robust industrial infrastructure, and supportive government policies. However, the Asia-Pacific region is witnessing rapid growth due to its massive manufacturing base and increasing investments in automation technologies.
Key Drivers by Region:
- North America: Strong government support, mature industrial base, and high technological advancements.
- Europe: Focus on Industry 4.0 initiatives and a skilled workforce.
- Asia-Pacific: Large manufacturing base, rising investments in automation, and growing industrialization.
Dominant Segments:
- Technology: PLC, SCADA, and MES segments show high growth potential due to their critical role in automation and data management.
- Components: Machine vision systems and robotics are witnessing significant demand driven by applications in quality control and automated production processes.
- End-user Industry: The automotive, semiconductor, and chemical & petrochemical industries are leading adopters of smart manufacturing technologies.
Detailed Dominance Analysis: The PLC segment holds the largest market share among technologies, while the automotive industry is the largest end-user segment, contributing to xx% of the total market revenue. This is due to the high level of automation in vehicle manufacturing and the strong need for efficient production processes.
Smart Manufacturing Industry Product Innovations
Recent product innovations focus on integrating AI and ML for predictive maintenance, advanced analytics for process optimization, and improved Human-Machine Interface (HMI) for enhanced user experience. The key competitive advantage lies in offering integrated and scalable solutions that address the specific needs of diverse industries. These innovations improve operational efficiency, reduce downtime, and enhance overall product quality. The market is witnessing a shift towards cloud-based solutions, providing manufacturers with cost-effective and accessible technologies.
Report Scope & Segmentation Analysis
This report segments the smart manufacturing market by technology (PLC, SCADA, ERP, DCS, HMI, PLM, MES, Other), component (Machine Vision Systems, Control Devices, Robotics, Communication Segment, Sensors, Other Components), and end-user industry (Automotive, Semiconductors, Oil & Gas, Chemical & Petrochemical, Pharmaceutical, Aerospace & Defense, Food & Beverage, Metals & Mining, Other). Each segment's growth projections, market size, and competitive dynamics are analyzed in detail. The market is expected to show significant growth across all segments, with the highest growth projected for the MES and robotics segments. Competitive intensity varies across segments, with higher competition observed in mature technology segments like PLC and SCADA.
Key Drivers of Smart Manufacturing Industry Growth
Technological advancements, including AI, IoT, and cloud computing, are primary growth drivers. Government initiatives promoting Industry 4.0 and digital transformation are also crucial. Economic factors, such as the need for increased productivity and cost reduction, are further fueling market expansion. Regulatory pressure to improve environmental sustainability and operational safety is driving adoption of smart manufacturing solutions.
Challenges in the Smart Manufacturing Industry Sector
High initial investment costs, complex implementation processes, and cybersecurity concerns pose significant challenges. Skill gaps in the workforce and integration complexities across different systems can hinder adoption. Supply chain disruptions and the volatile price of raw materials also create uncertainty. The impact of these challenges can reduce the market growth by an estimated xx% annually.
Emerging Opportunities in Smart Manufacturing Industry
The integration of digital twins, the growing adoption of additive manufacturing, and the expansion of smart factories across developing economies present significant opportunities. New technologies, such as blockchain for supply chain transparency and augmented reality for enhanced maintenance, are creating new market niches. The focus on sustainable and circular manufacturing practices is opening up new avenues for growth.
Leading Players in the Smart Manufacturing Industry Market
- Honeywell International Inc
- ABB Ltd
- Mitsubishi Electric Corporation
- Siemens AG
- Schneider Electric SE
- Fanuc Corporation
- Robert Bosch GmbH
- Texas Instruments Incorporated
- Rockwell Automation Inc
- Yokogawa Electric Corporation
- General Electric Company
- Emerson Electric Company
Key Developments in Smart Manufacturing Industry
- December 2023: TeamViewer's strategic investments in Sight Machine and Cybus strengthen its position in smart factory solutions, driving market consolidation.
- February 2023: General Electric's enhanced cloud-based MES improves efficiency and security for manufacturers of all sizes.
- July 2022: ABB and SKF's MoU signifies collaboration towards enhanced manufacturing automation capabilities, impacting the market’s productivity.
Future Outlook for Smart Manufacturing Industry Market
The smart manufacturing market is poised for continued strong growth, driven by ongoing technological advancements, increasing digitalization across various sectors, and rising demand for efficient and sustainable manufacturing practices. Strategic partnerships, investments in R&D, and the focus on developing integrated solutions will shape the future of the industry. The market is expected to experience accelerated growth in emerging markets, creating lucrative opportunities for both established and new players.
Smart Manufacturing Industry Segmentation
-
1. Technology
- 1.1. Programmable Logic Controller (PLC)
- 1.2. Supervis
- 1.3. Enterprise Resource and Planning (ERP)
- 1.4. Distributed Control System (DCS)
- 1.5. Human Machine Interface (HMI)
- 1.6. Product Lifecycle Management (PLM)
- 1.7. Manufacturing Execution System (MES)
- 1.8. Other Technologies
-
2. Component
- 2.1. Machine Vision Systems
- 2.2. Control Device
- 2.3. Robotics
- 2.4. Communication Segment
- 2.5. Sensor
- 2.6. Other Components
-
3. End-user Industry
- 3.1. Automotive
- 3.2. Semiconductors
- 3.3. Oil and Gas
- 3.4. Chemical and Petrochemical
- 3.5. Pharmaceutical
- 3.6. Aerospace and Defense
- 3.7. Food and Beverage
- 3.8. Metals and Mining
- 3.9. Other End-user Industries
Smart Manufacturing Industry Segmentation By Geography
-
1. North America
- 1.1. United States
- 1.2. Canada
-
2. Europe
- 2.1. Germany
- 2.2. United Kingdom
- 2.3. France
- 2.4. Rest of Europe
-
3. Asia Pacific
- 3.1. China
- 3.2. India
- 3.3. Japan
- 3.4. Rest of Asia Pacific
-
4. Latin America
- 4.1. Brazil
- 4.2. Mexico
- 4.3. Rest of Latin America
- 5. Middle East and Africa
Smart Manufacturing Industry REPORT HIGHLIGHTS
| Aspects | Details |
|---|---|
| Study Period | 2019-2033 |
| Base Year | 2024 |
| Estimated Year | 2025 |
| Forecast Period | 2025-2033 |
| Historical Period | 2019-2024 |
| Growth Rate | CAGR of 14.58% from 2019-2033 |
| Segmentation |
|
Table of Contents
- 1. Introduction
- 1.1. Research Scope
- 1.2. Market Segmentation
- 1.3. Research Methodology
- 1.4. Definitions and Assumptions
- 2. Executive Summary
- 2.1. Introduction
- 3. Market Dynamics
- 3.1. Introduction
- 3.2. Market Drivers
- 3.2.1. Increasing Demand for Automation to Achieve Efficiency and Quality; Need for Compliance and Government Support for Digitization; Proliferation of Internet of Things
- 3.3. Market Restrains
- 3.3.1. Concerns Regarding Data Security; High Initial Installation Costs and Lack of Skilled Workforce Preventing Enterprises from Full-scale Adoption
- 3.4. Market Trends
- 3.4.1. Automotive Industry is Expected to Drive the Market Growth
- 4. Market Factor Analysis
- 4.1. Porters Five Forces
- 4.2. Supply/Value Chain
- 4.3. PESTEL analysis
- 4.4. Market Entropy
- 4.5. Patent/Trademark Analysis
- 5. Global Smart Manufacturing Industry Analysis, Insights and Forecast, 2019-2031
- 5.1. Market Analysis, Insights and Forecast - by Technology
- 5.1.1. Programmable Logic Controller (PLC)
- 5.1.2. Supervis
- 5.1.3. Enterprise Resource and Planning (ERP)
- 5.1.4. Distributed Control System (DCS)
- 5.1.5. Human Machine Interface (HMI)
- 5.1.6. Product Lifecycle Management (PLM)
- 5.1.7. Manufacturing Execution System (MES)
- 5.1.8. Other Technologies
- 5.2. Market Analysis, Insights and Forecast - by Component
- 5.2.1. Machine Vision Systems
- 5.2.2. Control Device
- 5.2.3. Robotics
- 5.2.4. Communication Segment
- 5.2.5. Sensor
- 5.2.6. Other Components
- 5.3. Market Analysis, Insights and Forecast - by End-user Industry
- 5.3.1. Automotive
- 5.3.2. Semiconductors
- 5.3.3. Oil and Gas
- 5.3.4. Chemical and Petrochemical
- 5.3.5. Pharmaceutical
- 5.3.6. Aerospace and Defense
- 5.3.7. Food and Beverage
- 5.3.8. Metals and Mining
- 5.3.9. Other End-user Industries
- 5.4. Market Analysis, Insights and Forecast - by Region
- 5.4.1. North America
- 5.4.2. Europe
- 5.4.3. Asia Pacific
- 5.4.4. Latin America
- 5.4.5. Middle East and Africa
- 5.1. Market Analysis, Insights and Forecast - by Technology
- 6. North America Smart Manufacturing Industry Analysis, Insights and Forecast, 2019-2031
- 6.1. Market Analysis, Insights and Forecast - by Technology
- 6.1.1. Programmable Logic Controller (PLC)
- 6.1.2. Supervis
- 6.1.3. Enterprise Resource and Planning (ERP)
- 6.1.4. Distributed Control System (DCS)
- 6.1.5. Human Machine Interface (HMI)
- 6.1.6. Product Lifecycle Management (PLM)
- 6.1.7. Manufacturing Execution System (MES)
- 6.1.8. Other Technologies
- 6.2. Market Analysis, Insights and Forecast - by Component
- 6.2.1. Machine Vision Systems
- 6.2.2. Control Device
- 6.2.3. Robotics
- 6.2.4. Communication Segment
- 6.2.5. Sensor
- 6.2.6. Other Components
- 6.3. Market Analysis, Insights and Forecast - by End-user Industry
- 6.3.1. Automotive
- 6.3.2. Semiconductors
- 6.3.3. Oil and Gas
- 6.3.4. Chemical and Petrochemical
- 6.3.5. Pharmaceutical
- 6.3.6. Aerospace and Defense
- 6.3.7. Food and Beverage
- 6.3.8. Metals and Mining
- 6.3.9. Other End-user Industries
- 6.1. Market Analysis, Insights and Forecast - by Technology
- 7. Europe Smart Manufacturing Industry Analysis, Insights and Forecast, 2019-2031
- 7.1. Market Analysis, Insights and Forecast - by Technology
- 7.1.1. Programmable Logic Controller (PLC)
- 7.1.2. Supervis
- 7.1.3. Enterprise Resource and Planning (ERP)
- 7.1.4. Distributed Control System (DCS)
- 7.1.5. Human Machine Interface (HMI)
- 7.1.6. Product Lifecycle Management (PLM)
- 7.1.7. Manufacturing Execution System (MES)
- 7.1.8. Other Technologies
- 7.2. Market Analysis, Insights and Forecast - by Component
- 7.2.1. Machine Vision Systems
- 7.2.2. Control Device
- 7.2.3. Robotics
- 7.2.4. Communication Segment
- 7.2.5. Sensor
- 7.2.6. Other Components
- 7.3. Market Analysis, Insights and Forecast - by End-user Industry
- 7.3.1. Automotive
- 7.3.2. Semiconductors
- 7.3.3. Oil and Gas
- 7.3.4. Chemical and Petrochemical
- 7.3.5. Pharmaceutical
- 7.3.6. Aerospace and Defense
- 7.3.7. Food and Beverage
- 7.3.8. Metals and Mining
- 7.3.9. Other End-user Industries
- 7.1. Market Analysis, Insights and Forecast - by Technology
- 8. Asia Pacific Smart Manufacturing Industry Analysis, Insights and Forecast, 2019-2031
- 8.1. Market Analysis, Insights and Forecast - by Technology
- 8.1.1. Programmable Logic Controller (PLC)
- 8.1.2. Supervis
- 8.1.3. Enterprise Resource and Planning (ERP)
- 8.1.4. Distributed Control System (DCS)
- 8.1.5. Human Machine Interface (HMI)
- 8.1.6. Product Lifecycle Management (PLM)
- 8.1.7. Manufacturing Execution System (MES)
- 8.1.8. Other Technologies
- 8.2. Market Analysis, Insights and Forecast - by Component
- 8.2.1. Machine Vision Systems
- 8.2.2. Control Device
- 8.2.3. Robotics
- 8.2.4. Communication Segment
- 8.2.5. Sensor
- 8.2.6. Other Components
- 8.3. Market Analysis, Insights and Forecast - by End-user Industry
- 8.3.1. Automotive
- 8.3.2. Semiconductors
- 8.3.3. Oil and Gas
- 8.3.4. Chemical and Petrochemical
- 8.3.5. Pharmaceutical
- 8.3.6. Aerospace and Defense
- 8.3.7. Food and Beverage
- 8.3.8. Metals and Mining
- 8.3.9. Other End-user Industries
- 8.1. Market Analysis, Insights and Forecast - by Technology
- 9. Latin America Smart Manufacturing Industry Analysis, Insights and Forecast, 2019-2031
- 9.1. Market Analysis, Insights and Forecast - by Technology
- 9.1.1. Programmable Logic Controller (PLC)
- 9.1.2. Supervis
- 9.1.3. Enterprise Resource and Planning (ERP)
- 9.1.4. Distributed Control System (DCS)
- 9.1.5. Human Machine Interface (HMI)
- 9.1.6. Product Lifecycle Management (PLM)
- 9.1.7. Manufacturing Execution System (MES)
- 9.1.8. Other Technologies
- 9.2. Market Analysis, Insights and Forecast - by Component
- 9.2.1. Machine Vision Systems
- 9.2.2. Control Device
- 9.2.3. Robotics
- 9.2.4. Communication Segment
- 9.2.5. Sensor
- 9.2.6. Other Components
- 9.3. Market Analysis, Insights and Forecast - by End-user Industry
- 9.3.1. Automotive
- 9.3.2. Semiconductors
- 9.3.3. Oil and Gas
- 9.3.4. Chemical and Petrochemical
- 9.3.5. Pharmaceutical
- 9.3.6. Aerospace and Defense
- 9.3.7. Food and Beverage
- 9.3.8. Metals and Mining
- 9.3.9. Other End-user Industries
- 9.1. Market Analysis, Insights and Forecast - by Technology
- 10. Middle East and Africa Smart Manufacturing Industry Analysis, Insights and Forecast, 2019-2031
- 10.1. Market Analysis, Insights and Forecast - by Technology
- 10.1.1. Programmable Logic Controller (PLC)
- 10.1.2. Supervis
- 10.1.3. Enterprise Resource and Planning (ERP)
- 10.1.4. Distributed Control System (DCS)
- 10.1.5. Human Machine Interface (HMI)
- 10.1.6. Product Lifecycle Management (PLM)
- 10.1.7. Manufacturing Execution System (MES)
- 10.1.8. Other Technologies
- 10.2. Market Analysis, Insights and Forecast - by Component
- 10.2.1. Machine Vision Systems
- 10.2.2. Control Device
- 10.2.3. Robotics
- 10.2.4. Communication Segment
- 10.2.5. Sensor
- 10.2.6. Other Components
- 10.3. Market Analysis, Insights and Forecast - by End-user Industry
- 10.3.1. Automotive
- 10.3.2. Semiconductors
- 10.3.3. Oil and Gas
- 10.3.4. Chemical and Petrochemical
- 10.3.5. Pharmaceutical
- 10.3.6. Aerospace and Defense
- 10.3.7. Food and Beverage
- 10.3.8. Metals and Mining
- 10.3.9. Other End-user Industries
- 10.1. Market Analysis, Insights and Forecast - by Technology
- 11. North America Smart Manufacturing Industry Analysis, Insights and Forecast, 2019-2031
- 11.1. Market Analysis, Insights and Forecast - By Country/Sub-region
- 11.1.1 United States
- 11.1.2 Canada
- 11.1.3 Mexico
- 12. Europe Smart Manufacturing Industry Analysis, Insights and Forecast, 2019-2031
- 12.1. Market Analysis, Insights and Forecast - By Country/Sub-region
- 12.1.1 Germany
- 12.1.2 United Kingdom
- 12.1.3 France
- 12.1.4 Spain
- 12.1.5 Italy
- 12.1.6 Spain
- 12.1.7 Belgium
- 12.1.8 Netherland
- 12.1.9 Nordics
- 12.1.10 Rest of Europe
- 13. Asia Pacific Smart Manufacturing Industry Analysis, Insights and Forecast, 2019-2031
- 13.1. Market Analysis, Insights and Forecast - By Country/Sub-region
- 13.1.1 China
- 13.1.2 Japan
- 13.1.3 India
- 13.1.4 South Korea
- 13.1.5 Southeast Asia
- 13.1.6 Australia
- 13.1.7 Indonesia
- 13.1.8 Phillipes
- 13.1.9 Singapore
- 13.1.10 Thailandc
- 13.1.11 Rest of Asia Pacific
- 14. South America Smart Manufacturing Industry Analysis, Insights and Forecast, 2019-2031
- 14.1. Market Analysis, Insights and Forecast - By Country/Sub-region
- 14.1.1 Brazil
- 14.1.2 Argentina
- 14.1.3 Peru
- 14.1.4 Chile
- 14.1.5 Colombia
- 14.1.6 Ecuador
- 14.1.7 Venezuela
- 14.1.8 Rest of South America
- 15. MEA Smart Manufacturing Industry Analysis, Insights and Forecast, 2019-2031
- 15.1. Market Analysis, Insights and Forecast - By Country/Sub-region
- 15.1.1 United Arab Emirates
- 15.1.2 Saudi Arabia
- 15.1.3 South Africa
- 15.1.4 Rest of Middle East and Africa
- 16. Competitive Analysis
- 16.1. Global Market Share Analysis 2024
- 16.2. Company Profiles
- 16.2.1 Honeywell International Inc
- 16.2.1.1. Overview
- 16.2.1.2. Products
- 16.2.1.3. SWOT Analysis
- 16.2.1.4. Recent Developments
- 16.2.1.5. Financials (Based on Availability)
- 16.2.2 ABB Ltd
- 16.2.2.1. Overview
- 16.2.2.2. Products
- 16.2.2.3. SWOT Analysis
- 16.2.2.4. Recent Developments
- 16.2.2.5. Financials (Based on Availability)
- 16.2.3 Mitsubishi Electric Corporation
- 16.2.3.1. Overview
- 16.2.3.2. Products
- 16.2.3.3. SWOT Analysis
- 16.2.3.4. Recent Developments
- 16.2.3.5. Financials (Based on Availability)
- 16.2.4 Siemens AG
- 16.2.4.1. Overview
- 16.2.4.2. Products
- 16.2.4.3. SWOT Analysis
- 16.2.4.4. Recent Developments
- 16.2.4.5. Financials (Based on Availability)
- 16.2.5 Schneider Electric SE
- 16.2.5.1. Overview
- 16.2.5.2. Products
- 16.2.5.3. SWOT Analysis
- 16.2.5.4. Recent Developments
- 16.2.5.5. Financials (Based on Availability)
- 16.2.6 Fanuc Corporation
- 16.2.6.1. Overview
- 16.2.6.2. Products
- 16.2.6.3. SWOT Analysis
- 16.2.6.4. Recent Developments
- 16.2.6.5. Financials (Based on Availability)
- 16.2.7 Robert Bosch GmbH
- 16.2.7.1. Overview
- 16.2.7.2. Products
- 16.2.7.3. SWOT Analysis
- 16.2.7.4. Recent Developments
- 16.2.7.5. Financials (Based on Availability)
- 16.2.8 Texas Instruments Incorporated
- 16.2.8.1. Overview
- 16.2.8.2. Products
- 16.2.8.3. SWOT Analysis
- 16.2.8.4. Recent Developments
- 16.2.8.5. Financials (Based on Availability)
- 16.2.9 Rockwell Automation Inc
- 16.2.9.1. Overview
- 16.2.9.2. Products
- 16.2.9.3. SWOT Analysis
- 16.2.9.4. Recent Developments
- 16.2.9.5. Financials (Based on Availability)
- 16.2.10 Yokogawa Electric Corporation
- 16.2.10.1. Overview
- 16.2.10.2. Products
- 16.2.10.3. SWOT Analysis
- 16.2.10.4. Recent Developments
- 16.2.10.5. Financials (Based on Availability)
- 16.2.11 General Electric Company
- 16.2.11.1. Overview
- 16.2.11.2. Products
- 16.2.11.3. SWOT Analysis
- 16.2.11.4. Recent Developments
- 16.2.11.5. Financials (Based on Availability)
- 16.2.12 Emerson Electric Company
- 16.2.12.1. Overview
- 16.2.12.2. Products
- 16.2.12.3. SWOT Analysis
- 16.2.12.4. Recent Developments
- 16.2.12.5. Financials (Based on Availability)
- 16.2.1 Honeywell International Inc
List of Figures
- Figure 1: Global Smart Manufacturing Industry Revenue Breakdown (Million, %) by Region 2024 & 2032
- Figure 2: North America Smart Manufacturing Industry Revenue (Million), by Country 2024 & 2032
- Figure 3: North America Smart Manufacturing Industry Revenue Share (%), by Country 2024 & 2032
- Figure 4: Europe Smart Manufacturing Industry Revenue (Million), by Country 2024 & 2032
- Figure 5: Europe Smart Manufacturing Industry Revenue Share (%), by Country 2024 & 2032
- Figure 6: Asia Pacific Smart Manufacturing Industry Revenue (Million), by Country 2024 & 2032
- Figure 7: Asia Pacific Smart Manufacturing Industry Revenue Share (%), by Country 2024 & 2032
- Figure 8: South America Smart Manufacturing Industry Revenue (Million), by Country 2024 & 2032
- Figure 9: South America Smart Manufacturing Industry Revenue Share (%), by Country 2024 & 2032
- Figure 10: MEA Smart Manufacturing Industry Revenue (Million), by Country 2024 & 2032
- Figure 11: MEA Smart Manufacturing Industry Revenue Share (%), by Country 2024 & 2032
- Figure 12: North America Smart Manufacturing Industry Revenue (Million), by Technology 2024 & 2032
- Figure 13: North America Smart Manufacturing Industry Revenue Share (%), by Technology 2024 & 2032
- Figure 14: North America Smart Manufacturing Industry Revenue (Million), by Component 2024 & 2032
- Figure 15: North America Smart Manufacturing Industry Revenue Share (%), by Component 2024 & 2032
- Figure 16: North America Smart Manufacturing Industry Revenue (Million), by End-user Industry 2024 & 2032
- Figure 17: North America Smart Manufacturing Industry Revenue Share (%), by End-user Industry 2024 & 2032
- Figure 18: North America Smart Manufacturing Industry Revenue (Million), by Country 2024 & 2032
- Figure 19: North America Smart Manufacturing Industry Revenue Share (%), by Country 2024 & 2032
- Figure 20: Europe Smart Manufacturing Industry Revenue (Million), by Technology 2024 & 2032
- Figure 21: Europe Smart Manufacturing Industry Revenue Share (%), by Technology 2024 & 2032
- Figure 22: Europe Smart Manufacturing Industry Revenue (Million), by Component 2024 & 2032
- Figure 23: Europe Smart Manufacturing Industry Revenue Share (%), by Component 2024 & 2032
- Figure 24: Europe Smart Manufacturing Industry Revenue (Million), by End-user Industry 2024 & 2032
- Figure 25: Europe Smart Manufacturing Industry Revenue Share (%), by End-user Industry 2024 & 2032
- Figure 26: Europe Smart Manufacturing Industry Revenue (Million), by Country 2024 & 2032
- Figure 27: Europe Smart Manufacturing Industry Revenue Share (%), by Country 2024 & 2032
- Figure 28: Asia Pacific Smart Manufacturing Industry Revenue (Million), by Technology 2024 & 2032
- Figure 29: Asia Pacific Smart Manufacturing Industry Revenue Share (%), by Technology 2024 & 2032
- Figure 30: Asia Pacific Smart Manufacturing Industry Revenue (Million), by Component 2024 & 2032
- Figure 31: Asia Pacific Smart Manufacturing Industry Revenue Share (%), by Component 2024 & 2032
- Figure 32: Asia Pacific Smart Manufacturing Industry Revenue (Million), by End-user Industry 2024 & 2032
- Figure 33: Asia Pacific Smart Manufacturing Industry Revenue Share (%), by End-user Industry 2024 & 2032
- Figure 34: Asia Pacific Smart Manufacturing Industry Revenue (Million), by Country 2024 & 2032
- Figure 35: Asia Pacific Smart Manufacturing Industry Revenue Share (%), by Country 2024 & 2032
- Figure 36: Latin America Smart Manufacturing Industry Revenue (Million), by Technology 2024 & 2032
- Figure 37: Latin America Smart Manufacturing Industry Revenue Share (%), by Technology 2024 & 2032
- Figure 38: Latin America Smart Manufacturing Industry Revenue (Million), by Component 2024 & 2032
- Figure 39: Latin America Smart Manufacturing Industry Revenue Share (%), by Component 2024 & 2032
- Figure 40: Latin America Smart Manufacturing Industry Revenue (Million), by End-user Industry 2024 & 2032
- Figure 41: Latin America Smart Manufacturing Industry Revenue Share (%), by End-user Industry 2024 & 2032
- Figure 42: Latin America Smart Manufacturing Industry Revenue (Million), by Country 2024 & 2032
- Figure 43: Latin America Smart Manufacturing Industry Revenue Share (%), by Country 2024 & 2032
- Figure 44: Middle East and Africa Smart Manufacturing Industry Revenue (Million), by Technology 2024 & 2032
- Figure 45: Middle East and Africa Smart Manufacturing Industry Revenue Share (%), by Technology 2024 & 2032
- Figure 46: Middle East and Africa Smart Manufacturing Industry Revenue (Million), by Component 2024 & 2032
- Figure 47: Middle East and Africa Smart Manufacturing Industry Revenue Share (%), by Component 2024 & 2032
- Figure 48: Middle East and Africa Smart Manufacturing Industry Revenue (Million), by End-user Industry 2024 & 2032
- Figure 49: Middle East and Africa Smart Manufacturing Industry Revenue Share (%), by End-user Industry 2024 & 2032
- Figure 50: Middle East and Africa Smart Manufacturing Industry Revenue (Million), by Country 2024 & 2032
- Figure 51: Middle East and Africa Smart Manufacturing Industry Revenue Share (%), by Country 2024 & 2032
List of Tables
- Table 1: Global Smart Manufacturing Industry Revenue Million Forecast, by Region 2019 & 2032
- Table 2: Global Smart Manufacturing Industry Revenue Million Forecast, by Technology 2019 & 2032
- Table 3: Global Smart Manufacturing Industry Revenue Million Forecast, by Component 2019 & 2032
- Table 4: Global Smart Manufacturing Industry Revenue Million Forecast, by End-user Industry 2019 & 2032
- Table 5: Global Smart Manufacturing Industry Revenue Million Forecast, by Region 2019 & 2032
- Table 6: Global Smart Manufacturing Industry Revenue Million Forecast, by Country 2019 & 2032
- Table 7: United States Smart Manufacturing Industry Revenue (Million) Forecast, by Application 2019 & 2032
- Table 8: Canada Smart Manufacturing Industry Revenue (Million) Forecast, by Application 2019 & 2032
- Table 9: Mexico Smart Manufacturing Industry Revenue (Million) Forecast, by Application 2019 & 2032
- Table 10: Global Smart Manufacturing Industry Revenue Million Forecast, by Country 2019 & 2032
- Table 11: Germany Smart Manufacturing Industry Revenue (Million) Forecast, by Application 2019 & 2032
- Table 12: United Kingdom Smart Manufacturing Industry Revenue (Million) Forecast, by Application 2019 & 2032
- Table 13: France Smart Manufacturing Industry Revenue (Million) Forecast, by Application 2019 & 2032
- Table 14: Spain Smart Manufacturing Industry Revenue (Million) Forecast, by Application 2019 & 2032
- Table 15: Italy Smart Manufacturing Industry Revenue (Million) Forecast, by Application 2019 & 2032
- Table 16: Spain Smart Manufacturing Industry Revenue (Million) Forecast, by Application 2019 & 2032
- Table 17: Belgium Smart Manufacturing Industry Revenue (Million) Forecast, by Application 2019 & 2032
- Table 18: Netherland Smart Manufacturing Industry Revenue (Million) Forecast, by Application 2019 & 2032
- Table 19: Nordics Smart Manufacturing Industry Revenue (Million) Forecast, by Application 2019 & 2032
- Table 20: Rest of Europe Smart Manufacturing Industry Revenue (Million) Forecast, by Application 2019 & 2032
- Table 21: Global Smart Manufacturing Industry Revenue Million Forecast, by Country 2019 & 2032
- Table 22: China Smart Manufacturing Industry Revenue (Million) Forecast, by Application 2019 & 2032
- Table 23: Japan Smart Manufacturing Industry Revenue (Million) Forecast, by Application 2019 & 2032
- Table 24: India Smart Manufacturing Industry Revenue (Million) Forecast, by Application 2019 & 2032
- Table 25: South Korea Smart Manufacturing Industry Revenue (Million) Forecast, by Application 2019 & 2032
- Table 26: Southeast Asia Smart Manufacturing Industry Revenue (Million) Forecast, by Application 2019 & 2032
- Table 27: Australia Smart Manufacturing Industry Revenue (Million) Forecast, by Application 2019 & 2032
- Table 28: Indonesia Smart Manufacturing Industry Revenue (Million) Forecast, by Application 2019 & 2032
- Table 29: Phillipes Smart Manufacturing Industry Revenue (Million) Forecast, by Application 2019 & 2032
- Table 30: Singapore Smart Manufacturing Industry Revenue (Million) Forecast, by Application 2019 & 2032
- Table 31: Thailandc Smart Manufacturing Industry Revenue (Million) Forecast, by Application 2019 & 2032
- Table 32: Rest of Asia Pacific Smart Manufacturing Industry Revenue (Million) Forecast, by Application 2019 & 2032
- Table 33: Global Smart Manufacturing Industry Revenue Million Forecast, by Country 2019 & 2032
- Table 34: Brazil Smart Manufacturing Industry Revenue (Million) Forecast, by Application 2019 & 2032
- Table 35: Argentina Smart Manufacturing Industry Revenue (Million) Forecast, by Application 2019 & 2032
- Table 36: Peru Smart Manufacturing Industry Revenue (Million) Forecast, by Application 2019 & 2032
- Table 37: Chile Smart Manufacturing Industry Revenue (Million) Forecast, by Application 2019 & 2032
- Table 38: Colombia Smart Manufacturing Industry Revenue (Million) Forecast, by Application 2019 & 2032
- Table 39: Ecuador Smart Manufacturing Industry Revenue (Million) Forecast, by Application 2019 & 2032
- Table 40: Venezuela Smart Manufacturing Industry Revenue (Million) Forecast, by Application 2019 & 2032
- Table 41: Rest of South America Smart Manufacturing Industry Revenue (Million) Forecast, by Application 2019 & 2032
- Table 42: Global Smart Manufacturing Industry Revenue Million Forecast, by Country 2019 & 2032
- Table 43: United Arab Emirates Smart Manufacturing Industry Revenue (Million) Forecast, by Application 2019 & 2032
- Table 44: Saudi Arabia Smart Manufacturing Industry Revenue (Million) Forecast, by Application 2019 & 2032
- Table 45: South Africa Smart Manufacturing Industry Revenue (Million) Forecast, by Application 2019 & 2032
- Table 46: Rest of Middle East and Africa Smart Manufacturing Industry Revenue (Million) Forecast, by Application 2019 & 2032
- Table 47: Global Smart Manufacturing Industry Revenue Million Forecast, by Technology 2019 & 2032
- Table 48: Global Smart Manufacturing Industry Revenue Million Forecast, by Component 2019 & 2032
- Table 49: Global Smart Manufacturing Industry Revenue Million Forecast, by End-user Industry 2019 & 2032
- Table 50: Global Smart Manufacturing Industry Revenue Million Forecast, by Country 2019 & 2032
- Table 51: United States Smart Manufacturing Industry Revenue (Million) Forecast, by Application 2019 & 2032
- Table 52: Canada Smart Manufacturing Industry Revenue (Million) Forecast, by Application 2019 & 2032
- Table 53: Global Smart Manufacturing Industry Revenue Million Forecast, by Technology 2019 & 2032
- Table 54: Global Smart Manufacturing Industry Revenue Million Forecast, by Component 2019 & 2032
- Table 55: Global Smart Manufacturing Industry Revenue Million Forecast, by End-user Industry 2019 & 2032
- Table 56: Global Smart Manufacturing Industry Revenue Million Forecast, by Country 2019 & 2032
- Table 57: Germany Smart Manufacturing Industry Revenue (Million) Forecast, by Application 2019 & 2032
- Table 58: United Kingdom Smart Manufacturing Industry Revenue (Million) Forecast, by Application 2019 & 2032
- Table 59: France Smart Manufacturing Industry Revenue (Million) Forecast, by Application 2019 & 2032
- Table 60: Rest of Europe Smart Manufacturing Industry Revenue (Million) Forecast, by Application 2019 & 2032
- Table 61: Global Smart Manufacturing Industry Revenue Million Forecast, by Technology 2019 & 2032
- Table 62: Global Smart Manufacturing Industry Revenue Million Forecast, by Component 2019 & 2032
- Table 63: Global Smart Manufacturing Industry Revenue Million Forecast, by End-user Industry 2019 & 2032
- Table 64: Global Smart Manufacturing Industry Revenue Million Forecast, by Country 2019 & 2032
- Table 65: China Smart Manufacturing Industry Revenue (Million) Forecast, by Application 2019 & 2032
- Table 66: India Smart Manufacturing Industry Revenue (Million) Forecast, by Application 2019 & 2032
- Table 67: Japan Smart Manufacturing Industry Revenue (Million) Forecast, by Application 2019 & 2032
- Table 68: Rest of Asia Pacific Smart Manufacturing Industry Revenue (Million) Forecast, by Application 2019 & 2032
- Table 69: Global Smart Manufacturing Industry Revenue Million Forecast, by Technology 2019 & 2032
- Table 70: Global Smart Manufacturing Industry Revenue Million Forecast, by Component 2019 & 2032
- Table 71: Global Smart Manufacturing Industry Revenue Million Forecast, by End-user Industry 2019 & 2032
- Table 72: Global Smart Manufacturing Industry Revenue Million Forecast, by Country 2019 & 2032
- Table 73: Brazil Smart Manufacturing Industry Revenue (Million) Forecast, by Application 2019 & 2032
- Table 74: Mexico Smart Manufacturing Industry Revenue (Million) Forecast, by Application 2019 & 2032
- Table 75: Rest of Latin America Smart Manufacturing Industry Revenue (Million) Forecast, by Application 2019 & 2032
- Table 76: Global Smart Manufacturing Industry Revenue Million Forecast, by Technology 2019 & 2032
- Table 77: Global Smart Manufacturing Industry Revenue Million Forecast, by Component 2019 & 2032
- Table 78: Global Smart Manufacturing Industry Revenue Million Forecast, by End-user Industry 2019 & 2032
- Table 79: Global Smart Manufacturing Industry Revenue Million Forecast, by Country 2019 & 2032
Frequently Asked Questions
1. What is the projected Compound Annual Growth Rate (CAGR) of the Smart Manufacturing Industry?
The projected CAGR is approximately 14.58%.
2. Which companies are prominent players in the Smart Manufacturing Industry?
Key companies in the market include Honeywell International Inc, ABB Ltd, Mitsubishi Electric Corporation, Siemens AG, Schneider Electric SE, Fanuc Corporation, Robert Bosch GmbH, Texas Instruments Incorporated, Rockwell Automation Inc, Yokogawa Electric Corporation, General Electric Company, Emerson Electric Company.
3. What are the main segments of the Smart Manufacturing Industry?
The market segments include Technology, Component, End-user Industry.
4. Can you provide details about the market size?
The market size is estimated to be USD 141.39 Million as of 2022.
5. What are some drivers contributing to market growth?
Increasing Demand for Automation to Achieve Efficiency and Quality; Need for Compliance and Government Support for Digitization; Proliferation of Internet of Things.
6. What are the notable trends driving market growth?
Automotive Industry is Expected to Drive the Market Growth.
7. Are there any restraints impacting market growth?
Concerns Regarding Data Security; High Initial Installation Costs and Lack of Skilled Workforce Preventing Enterprises from Full-scale Adoption.
8. Can you provide examples of recent developments in the market?
Dec 2023: TeamViewer announced strategic investments in two pioneering companies for smart factory solutions: Sight Machine and Cybus. This initiative strengthens TeamViewer's dedication to digitalizing industrial workplaces and merging IT & OT. Also, these investments pave the way for TeamViewer to become a top provider of enterprise software, linking manufacturing infrastructure, IT systems, and data analytics.
9. What pricing options are available for accessing the report?
Pricing options include single-user, multi-user, and enterprise licenses priced at USD 4750, USD 5250, and USD 8750 respectively.
10. Is the market size provided in terms of value or volume?
The market size is provided in terms of value, measured in Million.
11. Are there any specific market keywords associated with the report?
Yes, the market keyword associated with the report is "Smart Manufacturing Industry," which aids in identifying and referencing the specific market segment covered.
12. How do I determine which pricing option suits my needs best?
The pricing options vary based on user requirements and access needs. Individual users may opt for single-user licenses, while businesses requiring broader access may choose multi-user or enterprise licenses for cost-effective access to the report.
13. Are there any additional resources or data provided in the Smart Manufacturing Industry report?
While the report offers comprehensive insights, it's advisable to review the specific contents or supplementary materials provided to ascertain if additional resources or data are available.
14. How can I stay updated on further developments or reports in the Smart Manufacturing Industry?
To stay informed about further developments, trends, and reports in the Smart Manufacturing Industry, consider subscribing to industry newsletters, following relevant companies and organizations, or regularly checking reputable industry news sources and publications.
Methodology
Step 1 - Identification of Relevant Samples Size from Population Database


Step 2 - Approaches for Defining Global Market Size (Value, Volume* & Price*)

Note*: In applicable scenarios
Step 3 - Data Sources
Primary Research
- Web Analytics
- Survey Reports
- Research Institute
- Latest Research Reports
- Opinion Leaders
Secondary Research
- Annual Reports
- White Paper
- Latest Press Release
- Industry Association
- Paid Database
- Investor Presentations

Step 4 - Data Triangulation
Involves using different sources of information in order to increase the validity of a study
These sources are likely to be stakeholders in a program - participants, other researchers, program staff, other community members, and so on.
Then we put all data in single framework & apply various statistical tools to find out the dynamic on the market.
During the analysis stage, feedback from the stakeholder groups would be compared to determine areas of agreement as well as areas of divergence


