
Key Insights
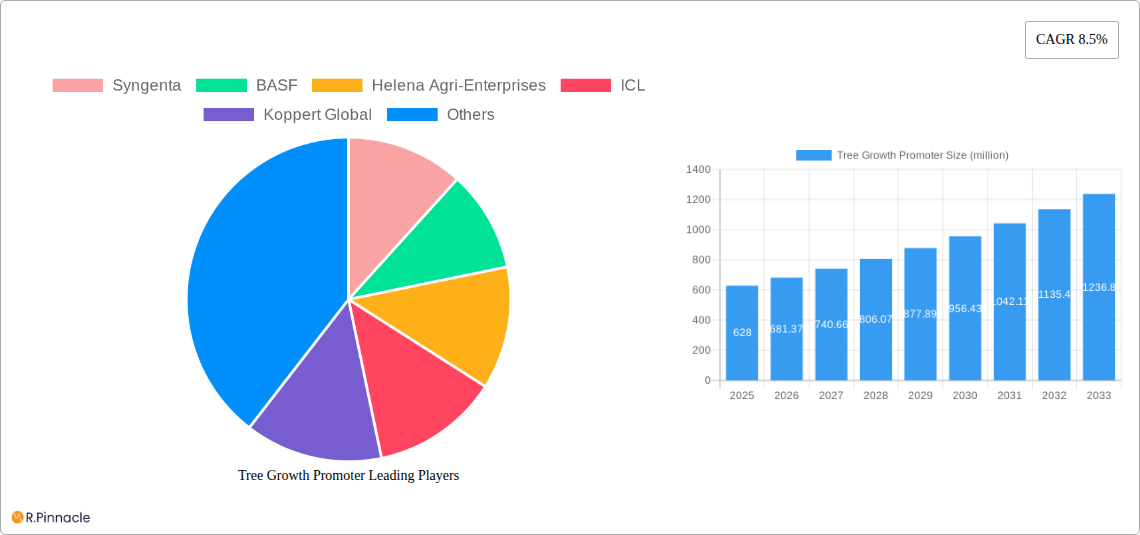
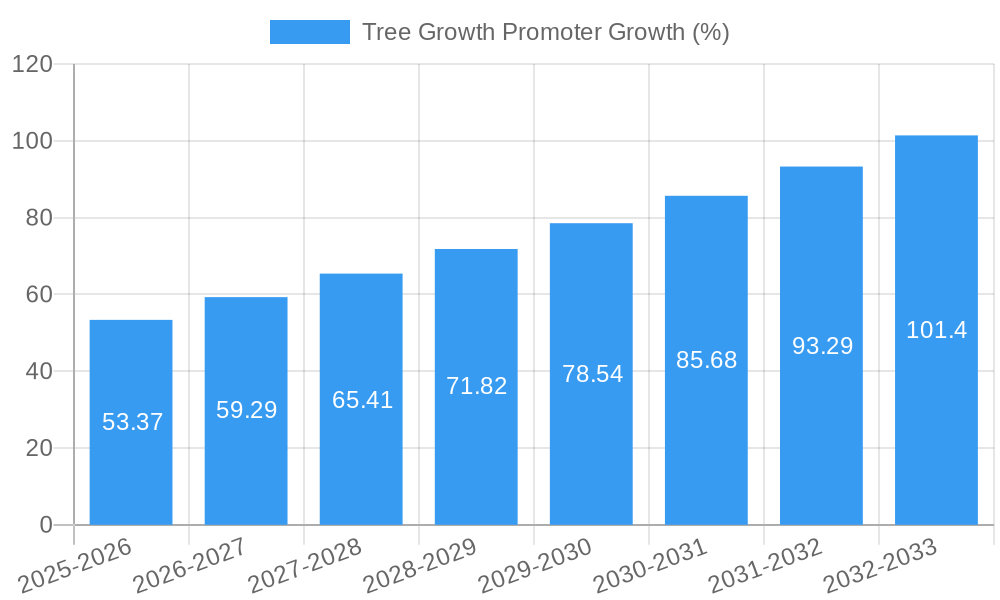
The global tree growth promoter market, valued at $628 million in 2025, is projected to experience robust growth, driven by increasing demand for higher crop yields and the expanding forestry sector. The market's Compound Annual Growth Rate (CAGR) of 8.5% from 2025 to 2033 indicates significant potential for growth. Key drivers include the rising adoption of sustainable agricultural practices, the growing need for efficient resource utilization in forestry, and the increasing awareness of the environmental benefits of healthy tree growth. The market is segmented by application (cash crops, protective trees) and type (nutritional supplements, growth regulators). Cash crop applications are currently leading the market share due to the high economic value of these crops, but the protective tree segment is showing strong growth potential driven by increased reforestation efforts and urban greening initiatives. Major players like Syngenta, BASF, and others are investing heavily in research and development to create innovative and sustainable tree growth promoters, further fueling market expansion. The market is geographically diverse, with North America and Asia Pacific emerging as key regional markets, driven by the presence of large agricultural sectors and significant government support for sustainable agriculture initiatives. The sustained focus on improving agricultural efficiency and environmental conservation is expected to maintain a positive trajectory for the market throughout the forecast period.
The restraints on market growth primarily stem from regulatory hurdles surrounding the use of certain chemicals, concerns regarding the potential environmental impact of some growth promoters, and price fluctuations of raw materials. However, the increasing adoption of bio-based and environmentally friendly growth promoters is mitigating these concerns. The market is witnessing a growing preference for advanced formulations that offer improved efficacy and targeted delivery, minimizing environmental impact. Furthermore, the emergence of precision agriculture technologies is enabling more efficient application of these products, optimizing resource use and maximizing returns. The continued innovation in product formulations, coupled with increased awareness of their benefits among farmers and forestry professionals, will contribute significantly to the overall market growth in the coming years.
Tree Growth Promoter Market Report: 2019-2033
This comprehensive report provides an in-depth analysis of the global Tree Growth Promoter market, projecting a market value exceeding $XX million by 2033. The study covers the period from 2019 to 2033, with a focus on the forecast period of 2025-2033 and a base year of 2025. This report is crucial for industry professionals, investors, and researchers seeking actionable insights into this dynamic market.
Tree Growth Promoter Market Structure & Innovation Trends
The global Tree Growth Promoter market is characterized by a moderately concentrated landscape, with key players like Syngenta, BASF, Helena Agri-Enterprises, ICL, Koppert Global, Sumitomo Chemical, Shandong Shengfeng Seed Technology, Noposion, Yunnan Yuntianhua, Jiangsu Kesheng Group, Sichuan Guoguang Agrochemical, and Meinan Biotechnology holding significant market share. Syngenta and BASF alone are estimated to command approximately xx% of the market in 2025. The market is driven by continuous innovation in product formulations, focusing on enhanced efficacy, improved sustainability, and targeted delivery systems. Regulatory frameworks, varying across regions, significantly influence product development and market access. Substitutes, such as traditional fertilization methods, exert competitive pressure, driving innovation in product differentiation. The market witnesses consistent M&A activity, with recent deals valued at over $XX million, signifying consolidation and expansion strategies among leading players.
- Market Concentration: Moderately concentrated, with top players holding xx% market share (2025).
- Innovation Drivers: Enhanced efficacy, sustainability, targeted delivery.
- Regulatory Frameworks: Vary across regions, impacting market access.
- Product Substitutes: Traditional fertilization methods.
- M&A Activity: Significant, with deals exceeding $XX million in recent years.
Tree Growth Promoter Market Dynamics & Trends
The Tree Growth Promoter market is experiencing robust growth, driven primarily by the increasing demand for high-yield agricultural practices and the growing adoption of advanced agricultural technologies. The market's Compound Annual Growth Rate (CAGR) is projected to be xx% during the forecast period (2025-2033). Technological advancements, such as precision agriculture techniques and the development of novel bio-stimulants, are disrupting traditional approaches. Consumer preference for sustainably produced food is further fueling demand for eco-friendly growth promoters. Competitive dynamics are shaped by product differentiation, pricing strategies, and geographical expansion initiatives. Market penetration is expected to increase significantly in developing economies, driven by rising agricultural output and government support.
Dominant Regions & Segments in Tree Growth Promoter
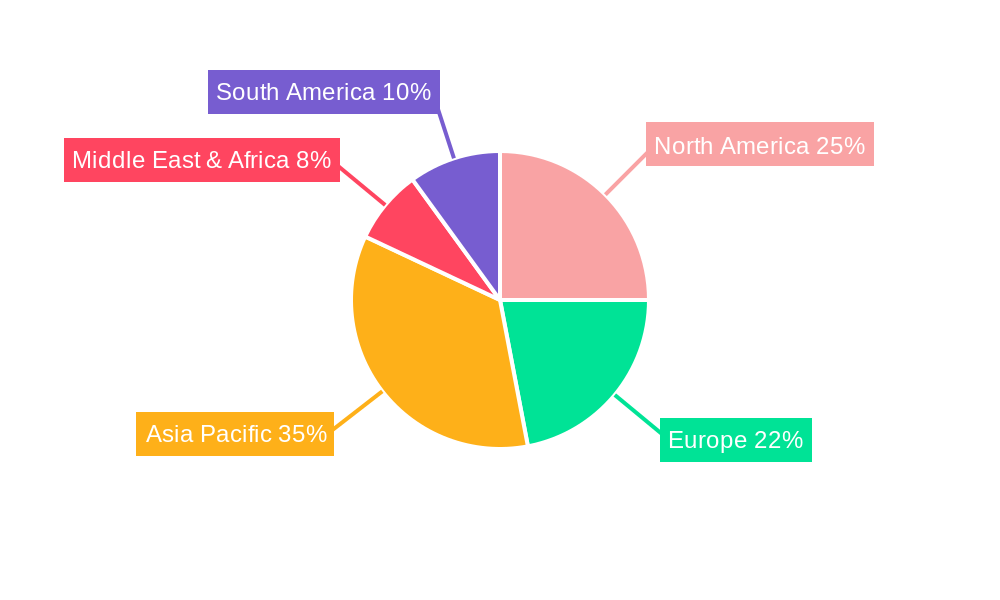
The Asia-Pacific region is expected to dominate the Tree Growth Promoter market throughout the forecast period, driven by extensive cash crop cultivation and increasing adoption of modern agricultural practices. Within this region, China and India are key contributors. The Cash Crops application segment is expected to remain dominant due to high demand and favorable economic policies supporting agricultural intensification. Within the Type segment, Nutritional Supplements are expected to have a larger market share compared to Growth Regulators due to its wider application and lower regulatory hurdles.
Key Drivers for Asia-Pacific Dominance:
- Rapidly expanding agricultural sector
- Growing adoption of advanced agricultural techniques
- Favorable government policies and initiatives supporting agricultural growth
- Large arable land area suitable for cash crop cultivation
Dominant Application Segment: Cash Crops (high demand and economic incentives)
Dominant Type Segment: Nutritional Supplements (wider application, lower regulatory hurdles)
Tree Growth Promoter Product Innovations
Recent innovations focus on developing environmentally friendly and highly efficient formulations. These advancements leverage nanotechnology for targeted delivery systems, improving nutrient uptake and reducing environmental impact. Companies are focusing on developing products with specific functionalities tailored to different tree species and growing conditions. This enhances market fit and provides a competitive advantage in a rapidly evolving market.
Report Scope & Segmentation Analysis
This report segments the Tree Growth Promoter market by Application (Cash Crops, Protective Trees) and Type (Nutritional Supplement, Growth Regulator). Each segment displays unique growth projections, market sizes, and competitive landscapes. The Cash Crops segment is expected to witness faster growth due to high demand and favorable economic policies. Similarly, Nutritional Supplements are projected to capture a larger market share due to wider applicability and less stringent regulations. The Protective Trees segment is poised for moderate growth driven by increased awareness about environmental conservation.
Key Drivers of Tree Growth Promoter Growth
The growth of the Tree Growth Promoter market is driven by several factors: increasing demand for food security, government support for sustainable agriculture, technological advancements in product formulations, and a growing awareness of the importance of tree health in environmental conservation. Favorable economic policies in several developing nations are further boosting market growth.
Challenges in the Tree Growth Promoter Sector
The Tree Growth Promoter sector faces challenges like stringent regulatory approvals, supply chain disruptions impacting raw material availability, and intense competition from established players. These factors can affect the market's profitability and growth trajectory. The cost of research and development for new, more effective formulations also presents a substantial barrier.
Emerging Opportunities in Tree Growth Promoter
Emerging opportunities lie in the development of bio-based and sustainable formulations, expansion into new geographical markets, particularly in developing countries with high agricultural potential, and leveraging precision agriculture technologies for targeted applications. The integration of digital tools to manage and track the efficacy of these products represents a significant opportunity.
Leading Players in the Tree Growth Promoter Market
- Syngenta
- BASF
- Helena Agri-Enterprises
- ICL
- Koppert Global
- Sumitomo Chemical
- Shandong Shengfeng Seed Technology
- Noposion
- Yunnan Yuntianhua
- Jiangsu Kesheng Group
- Sichuan Guoguang Agrochemical
- Meinan Biotechnology (Note: Please replace these links with the actual company websites if available. If a website isn't publicly available, remove the link)
Key Developments in Tree Growth Promoter Industry
- 2022 Q4: Syngenta launched a new bio-stimulant with enhanced nitrogen efficiency.
- 2023 Q1: BASF and Helena Agri-Enterprises announced a strategic partnership for distribution in North America.
- 2023 Q2: ICL acquired a smaller bio-stimulant company, expanding its product portfolio.
- 2024 Q1: Koppert Global released a new product line focused on sustainable growth promotion. (Further developments can be added based on actual market data)
Future Outlook for Tree Growth Promoter Market
The Tree Growth Promoter market is poised for significant growth, fueled by technological innovations, increased demand for sustainable solutions, and favorable government policies. Strategic partnerships and acquisitions will continue to shape the market landscape. Expanding into emerging markets and developing customized products for specific tree species and geographic locations will unlock further growth potential.
Tree Growth Promoter Segmentation
-
1. Application
- 1.1. Cash Crops
- 1.2. Protective Trees
-
2. Type
- 2.1. Nutritional Supplement
- 2.2. Growth Regulator
Tree Growth Promoter Segmentation By Geography
-
1. North America
- 1.1. United States
- 1.2. Canada
- 1.3. Mexico
-
2. South America
- 2.1. Brazil
- 2.2. Argentina
- 2.3. Rest of South America
-
3. Europe
- 3.1. United Kingdom
- 3.2. Germany
- 3.3. France
- 3.4. Italy
- 3.5. Spain
- 3.6. Russia
- 3.7. Benelux
- 3.8. Nordics
- 3.9. Rest of Europe
-
4. Middle East & Africa
- 4.1. Turkey
- 4.2. Israel
- 4.3. GCC
- 4.4. North Africa
- 4.5. South Africa
- 4.6. Rest of Middle East & Africa
-
5. Asia Pacific
- 5.1. China
- 5.2. India
- 5.3. Japan
- 5.4. South Korea
- 5.5. ASEAN
- 5.6. Oceania
- 5.7. Rest of Asia Pacific
Tree Growth Promoter REPORT HIGHLIGHTS
| Aspects | Details |
|---|---|
| Study Period | 2019-2033 |
| Base Year | 2024 |
| Estimated Year | 2025 |
| Forecast Period | 2025-2033 |
| Historical Period | 2019-2024 |
| Growth Rate | CAGR of 8.5% from 2019-2033 |
| Segmentation |
|
Table of Contents
- 1. Introduction
- 1.1. Research Scope
- 1.2. Market Segmentation
- 1.3. Research Methodology
- 1.4. Definitions and Assumptions
- 2. Executive Summary
- 2.1. Introduction
- 3. Market Dynamics
- 3.1. Introduction
- 3.2. Market Drivers
- 3.3. Market Restrains
- 3.4. Market Trends
- 4. Market Factor Analysis
- 4.1. Porters Five Forces
- 4.2. Supply/Value Chain
- 4.3. PESTEL analysis
- 4.4. Market Entropy
- 4.5. Patent/Trademark Analysis
- 5. Global Tree Growth Promoter Analysis, Insights and Forecast, 2019-2031
- 5.1. Market Analysis, Insights and Forecast - by Application
- 5.1.1. Cash Crops
- 5.1.2. Protective Trees
- 5.2. Market Analysis, Insights and Forecast - by Type
- 5.2.1. Nutritional Supplement
- 5.2.2. Growth Regulator
- 5.3. Market Analysis, Insights and Forecast - by Region
- 5.3.1. North America
- 5.3.2. South America
- 5.3.3. Europe
- 5.3.4. Middle East & Africa
- 5.3.5. Asia Pacific
- 5.1. Market Analysis, Insights and Forecast - by Application
- 6. North America Tree Growth Promoter Analysis, Insights and Forecast, 2019-2031
- 6.1. Market Analysis, Insights and Forecast - by Application
- 6.1.1. Cash Crops
- 6.1.2. Protective Trees
- 6.2. Market Analysis, Insights and Forecast - by Type
- 6.2.1. Nutritional Supplement
- 6.2.2. Growth Regulator
- 6.1. Market Analysis, Insights and Forecast - by Application
- 7. South America Tree Growth Promoter Analysis, Insights and Forecast, 2019-2031
- 7.1. Market Analysis, Insights and Forecast - by Application
- 7.1.1. Cash Crops
- 7.1.2. Protective Trees
- 7.2. Market Analysis, Insights and Forecast - by Type
- 7.2.1. Nutritional Supplement
- 7.2.2. Growth Regulator
- 7.1. Market Analysis, Insights and Forecast - by Application
- 8. Europe Tree Growth Promoter Analysis, Insights and Forecast, 2019-2031
- 8.1. Market Analysis, Insights and Forecast - by Application
- 8.1.1. Cash Crops
- 8.1.2. Protective Trees
- 8.2. Market Analysis, Insights and Forecast - by Type
- 8.2.1. Nutritional Supplement
- 8.2.2. Growth Regulator
- 8.1. Market Analysis, Insights and Forecast - by Application
- 9. Middle East & Africa Tree Growth Promoter Analysis, Insights and Forecast, 2019-2031
- 9.1. Market Analysis, Insights and Forecast - by Application
- 9.1.1. Cash Crops
- 9.1.2. Protective Trees
- 9.2. Market Analysis, Insights and Forecast - by Type
- 9.2.1. Nutritional Supplement
- 9.2.2. Growth Regulator
- 9.1. Market Analysis, Insights and Forecast - by Application
- 10. Asia Pacific Tree Growth Promoter Analysis, Insights and Forecast, 2019-2031
- 10.1. Market Analysis, Insights and Forecast - by Application
- 10.1.1. Cash Crops
- 10.1.2. Protective Trees
- 10.2. Market Analysis, Insights and Forecast - by Type
- 10.2.1. Nutritional Supplement
- 10.2.2. Growth Regulator
- 10.1. Market Analysis, Insights and Forecast - by Application
- 11. Competitive Analysis
- 11.1. Global Market Share Analysis 2024
- 11.2. Company Profiles
- 11.2.1 Syngenta
- 11.2.1.1. Overview
- 11.2.1.2. Products
- 11.2.1.3. SWOT Analysis
- 11.2.1.4. Recent Developments
- 11.2.1.5. Financials (Based on Availability)
- 11.2.2 BASF
- 11.2.2.1. Overview
- 11.2.2.2. Products
- 11.2.2.3. SWOT Analysis
- 11.2.2.4. Recent Developments
- 11.2.2.5. Financials (Based on Availability)
- 11.2.3 Helena Agri-Enterprises
- 11.2.3.1. Overview
- 11.2.3.2. Products
- 11.2.3.3. SWOT Analysis
- 11.2.3.4. Recent Developments
- 11.2.3.5. Financials (Based on Availability)
- 11.2.4 ICL
- 11.2.4.1. Overview
- 11.2.4.2. Products
- 11.2.4.3. SWOT Analysis
- 11.2.4.4. Recent Developments
- 11.2.4.5. Financials (Based on Availability)
- 11.2.5 Koppert Global
- 11.2.5.1. Overview
- 11.2.5.2. Products
- 11.2.5.3. SWOT Analysis
- 11.2.5.4. Recent Developments
- 11.2.5.5. Financials (Based on Availability)
- 11.2.6 Sumitomo Chemical
- 11.2.6.1. Overview
- 11.2.6.2. Products
- 11.2.6.3. SWOT Analysis
- 11.2.6.4. Recent Developments
- 11.2.6.5. Financials (Based on Availability)
- 11.2.7 Shandong Shengfeng Seed Technology
- 11.2.7.1. Overview
- 11.2.7.2. Products
- 11.2.7.3. SWOT Analysis
- 11.2.7.4. Recent Developments
- 11.2.7.5. Financials (Based on Availability)
- 11.2.8 Noposion
- 11.2.8.1. Overview
- 11.2.8.2. Products
- 11.2.8.3. SWOT Analysis
- 11.2.8.4. Recent Developments
- 11.2.8.5. Financials (Based on Availability)
- 11.2.9 Yunnan Yuntianhua
- 11.2.9.1. Overview
- 11.2.9.2. Products
- 11.2.9.3. SWOT Analysis
- 11.2.9.4. Recent Developments
- 11.2.9.5. Financials (Based on Availability)
- 11.2.10 Jiangsu Kesheng Group
- 11.2.10.1. Overview
- 11.2.10.2. Products
- 11.2.10.3. SWOT Analysis
- 11.2.10.4. Recent Developments
- 11.2.10.5. Financials (Based on Availability)
- 11.2.11 Sichuan Guoguang Agrochemical
- 11.2.11.1. Overview
- 11.2.11.2. Products
- 11.2.11.3. SWOT Analysis
- 11.2.11.4. Recent Developments
- 11.2.11.5. Financials (Based on Availability)
- 11.2.12 Meinan Biotechnology
- 11.2.12.1. Overview
- 11.2.12.2. Products
- 11.2.12.3. SWOT Analysis
- 11.2.12.4. Recent Developments
- 11.2.12.5. Financials (Based on Availability)
- 11.2.1 Syngenta
List of Figures
- Figure 1: Global Tree Growth Promoter Revenue Breakdown (million, %) by Region 2024 & 2032
- Figure 2: North America Tree Growth Promoter Revenue (million), by Application 2024 & 2032
- Figure 3: North America Tree Growth Promoter Revenue Share (%), by Application 2024 & 2032
- Figure 4: North America Tree Growth Promoter Revenue (million), by Type 2024 & 2032
- Figure 5: North America Tree Growth Promoter Revenue Share (%), by Type 2024 & 2032
- Figure 6: North America Tree Growth Promoter Revenue (million), by Country 2024 & 2032
- Figure 7: North America Tree Growth Promoter Revenue Share (%), by Country 2024 & 2032
- Figure 8: South America Tree Growth Promoter Revenue (million), by Application 2024 & 2032
- Figure 9: South America Tree Growth Promoter Revenue Share (%), by Application 2024 & 2032
- Figure 10: South America Tree Growth Promoter Revenue (million), by Type 2024 & 2032
- Figure 11: South America Tree Growth Promoter Revenue Share (%), by Type 2024 & 2032
- Figure 12: South America Tree Growth Promoter Revenue (million), by Country 2024 & 2032
- Figure 13: South America Tree Growth Promoter Revenue Share (%), by Country 2024 & 2032
- Figure 14: Europe Tree Growth Promoter Revenue (million), by Application 2024 & 2032
- Figure 15: Europe Tree Growth Promoter Revenue Share (%), by Application 2024 & 2032
- Figure 16: Europe Tree Growth Promoter Revenue (million), by Type 2024 & 2032
- Figure 17: Europe Tree Growth Promoter Revenue Share (%), by Type 2024 & 2032
- Figure 18: Europe Tree Growth Promoter Revenue (million), by Country 2024 & 2032
- Figure 19: Europe Tree Growth Promoter Revenue Share (%), by Country 2024 & 2032
- Figure 20: Middle East & Africa Tree Growth Promoter Revenue (million), by Application 2024 & 2032
- Figure 21: Middle East & Africa Tree Growth Promoter Revenue Share (%), by Application 2024 & 2032
- Figure 22: Middle East & Africa Tree Growth Promoter Revenue (million), by Type 2024 & 2032
- Figure 23: Middle East & Africa Tree Growth Promoter Revenue Share (%), by Type 2024 & 2032
- Figure 24: Middle East & Africa Tree Growth Promoter Revenue (million), by Country 2024 & 2032
- Figure 25: Middle East & Africa Tree Growth Promoter Revenue Share (%), by Country 2024 & 2032
- Figure 26: Asia Pacific Tree Growth Promoter Revenue (million), by Application 2024 & 2032
- Figure 27: Asia Pacific Tree Growth Promoter Revenue Share (%), by Application 2024 & 2032
- Figure 28: Asia Pacific Tree Growth Promoter Revenue (million), by Type 2024 & 2032
- Figure 29: Asia Pacific Tree Growth Promoter Revenue Share (%), by Type 2024 & 2032
- Figure 30: Asia Pacific Tree Growth Promoter Revenue (million), by Country 2024 & 2032
- Figure 31: Asia Pacific Tree Growth Promoter Revenue Share (%), by Country 2024 & 2032
List of Tables
- Table 1: Global Tree Growth Promoter Revenue million Forecast, by Region 2019 & 2032
- Table 2: Global Tree Growth Promoter Revenue million Forecast, by Application 2019 & 2032
- Table 3: Global Tree Growth Promoter Revenue million Forecast, by Type 2019 & 2032
- Table 4: Global Tree Growth Promoter Revenue million Forecast, by Region 2019 & 2032
- Table 5: Global Tree Growth Promoter Revenue million Forecast, by Application 2019 & 2032
- Table 6: Global Tree Growth Promoter Revenue million Forecast, by Type 2019 & 2032
- Table 7: Global Tree Growth Promoter Revenue million Forecast, by Country 2019 & 2032
- Table 8: United States Tree Growth Promoter Revenue (million) Forecast, by Application 2019 & 2032
- Table 9: Canada Tree Growth Promoter Revenue (million) Forecast, by Application 2019 & 2032
- Table 10: Mexico Tree Growth Promoter Revenue (million) Forecast, by Application 2019 & 2032
- Table 11: Global Tree Growth Promoter Revenue million Forecast, by Application 2019 & 2032
- Table 12: Global Tree Growth Promoter Revenue million Forecast, by Type 2019 & 2032
- Table 13: Global Tree Growth Promoter Revenue million Forecast, by Country 2019 & 2032
- Table 14: Brazil Tree Growth Promoter Revenue (million) Forecast, by Application 2019 & 2032
- Table 15: Argentina Tree Growth Promoter Revenue (million) Forecast, by Application 2019 & 2032
- Table 16: Rest of South America Tree Growth Promoter Revenue (million) Forecast, by Application 2019 & 2032
- Table 17: Global Tree Growth Promoter Revenue million Forecast, by Application 2019 & 2032
- Table 18: Global Tree Growth Promoter Revenue million Forecast, by Type 2019 & 2032
- Table 19: Global Tree Growth Promoter Revenue million Forecast, by Country 2019 & 2032
- Table 20: United Kingdom Tree Growth Promoter Revenue (million) Forecast, by Application 2019 & 2032
- Table 21: Germany Tree Growth Promoter Revenue (million) Forecast, by Application 2019 & 2032
- Table 22: France Tree Growth Promoter Revenue (million) Forecast, by Application 2019 & 2032
- Table 23: Italy Tree Growth Promoter Revenue (million) Forecast, by Application 2019 & 2032
- Table 24: Spain Tree Growth Promoter Revenue (million) Forecast, by Application 2019 & 2032
- Table 25: Russia Tree Growth Promoter Revenue (million) Forecast, by Application 2019 & 2032
- Table 26: Benelux Tree Growth Promoter Revenue (million) Forecast, by Application 2019 & 2032
- Table 27: Nordics Tree Growth Promoter Revenue (million) Forecast, by Application 2019 & 2032
- Table 28: Rest of Europe Tree Growth Promoter Revenue (million) Forecast, by Application 2019 & 2032
- Table 29: Global Tree Growth Promoter Revenue million Forecast, by Application 2019 & 2032
- Table 30: Global Tree Growth Promoter Revenue million Forecast, by Type 2019 & 2032
- Table 31: Global Tree Growth Promoter Revenue million Forecast, by Country 2019 & 2032
- Table 32: Turkey Tree Growth Promoter Revenue (million) Forecast, by Application 2019 & 2032
- Table 33: Israel Tree Growth Promoter Revenue (million) Forecast, by Application 2019 & 2032
- Table 34: GCC Tree Growth Promoter Revenue (million) Forecast, by Application 2019 & 2032
- Table 35: North Africa Tree Growth Promoter Revenue (million) Forecast, by Application 2019 & 2032
- Table 36: South Africa Tree Growth Promoter Revenue (million) Forecast, by Application 2019 & 2032
- Table 37: Rest of Middle East & Africa Tree Growth Promoter Revenue (million) Forecast, by Application 2019 & 2032
- Table 38: Global Tree Growth Promoter Revenue million Forecast, by Application 2019 & 2032
- Table 39: Global Tree Growth Promoter Revenue million Forecast, by Type 2019 & 2032
- Table 40: Global Tree Growth Promoter Revenue million Forecast, by Country 2019 & 2032
- Table 41: China Tree Growth Promoter Revenue (million) Forecast, by Application 2019 & 2032
- Table 42: India Tree Growth Promoter Revenue (million) Forecast, by Application 2019 & 2032
- Table 43: Japan Tree Growth Promoter Revenue (million) Forecast, by Application 2019 & 2032
- Table 44: South Korea Tree Growth Promoter Revenue (million) Forecast, by Application 2019 & 2032
- Table 45: ASEAN Tree Growth Promoter Revenue (million) Forecast, by Application 2019 & 2032
- Table 46: Oceania Tree Growth Promoter Revenue (million) Forecast, by Application 2019 & 2032
- Table 47: Rest of Asia Pacific Tree Growth Promoter Revenue (million) Forecast, by Application 2019 & 2032
Frequently Asked Questions
1. What is the projected Compound Annual Growth Rate (CAGR) of the Tree Growth Promoter?
The projected CAGR is approximately 8.5%.
2. Which companies are prominent players in the Tree Growth Promoter?
Key companies in the market include Syngenta, BASF, Helena Agri-Enterprises, ICL, Koppert Global, Sumitomo Chemical, Shandong Shengfeng Seed Technology, Noposion, Yunnan Yuntianhua, Jiangsu Kesheng Group, Sichuan Guoguang Agrochemical, Meinan Biotechnology.
3. What are the main segments of the Tree Growth Promoter?
The market segments include Application, Type.
4. Can you provide details about the market size?
The market size is estimated to be USD 628 million as of 2022.
5. What are some drivers contributing to market growth?
N/A
6. What are the notable trends driving market growth?
N/A
7. Are there any restraints impacting market growth?
N/A
8. Can you provide examples of recent developments in the market?
N/A
9. What pricing options are available for accessing the report?
Pricing options include single-user, multi-user, and enterprise licenses priced at USD 2900.00, USD 4350.00, and USD 5800.00 respectively.
10. Is the market size provided in terms of value or volume?
The market size is provided in terms of value, measured in million.
11. Are there any specific market keywords associated with the report?
Yes, the market keyword associated with the report is "Tree Growth Promoter," which aids in identifying and referencing the specific market segment covered.
12. How do I determine which pricing option suits my needs best?
The pricing options vary based on user requirements and access needs. Individual users may opt for single-user licenses, while businesses requiring broader access may choose multi-user or enterprise licenses for cost-effective access to the report.
13. Are there any additional resources or data provided in the Tree Growth Promoter report?
While the report offers comprehensive insights, it's advisable to review the specific contents or supplementary materials provided to ascertain if additional resources or data are available.
14. How can I stay updated on further developments or reports in the Tree Growth Promoter?
To stay informed about further developments, trends, and reports in the Tree Growth Promoter, consider subscribing to industry newsletters, following relevant companies and organizations, or regularly checking reputable industry news sources and publications.
Methodology
Step 1 - Identification of Relevant Samples Size from Population Database


Step 2 - Approaches for Defining Global Market Size (Value, Volume* & Price*)

Note*: In applicable scenarios
Step 3 - Data Sources
Primary Research
- Web Analytics
- Survey Reports
- Research Institute
- Latest Research Reports
- Opinion Leaders
Secondary Research
- Annual Reports
- White Paper
- Latest Press Release
- Industry Association
- Paid Database
- Investor Presentations

Step 4 - Data Triangulation
Involves using different sources of information in order to increase the validity of a study
These sources are likely to be stakeholders in a program - participants, other researchers, program staff, other community members, and so on.
Then we put all data in single framework & apply various statistical tools to find out the dynamic on the market.
During the analysis stage, feedback from the stakeholder groups would be compared to determine areas of agreement as well as areas of divergence


