
Key Insights
The global market for food fillers is experiencing robust growth, driven by increasing demand for processed foods, cost-effective production strategies within the food industry, and the need for improved texture and shelf life in various food products. The market is segmented by application (meat and seafood, dairy, beverages, others) and type (starch, cellulose, calcium carbonate, talc, others). Starch and cellulose currently dominate the market due to their widespread use and cost-effectiveness, while calcium carbonate and talc are gaining traction due to their specific functional properties. The meat and seafood segment holds a significant market share, followed by dairy and beverages. Geographically, North America and Europe currently represent major markets, although Asia-Pacific is projected to experience the fastest growth due to rising disposable incomes and increasing consumption of processed foods in developing economies. Factors such as stringent regulatory requirements regarding food additives and the growing consumer preference for natural and minimally processed foods pose challenges to market expansion. However, the development of innovative filler materials with enhanced functional properties and improved sustainability profiles is expected to create new opportunities.
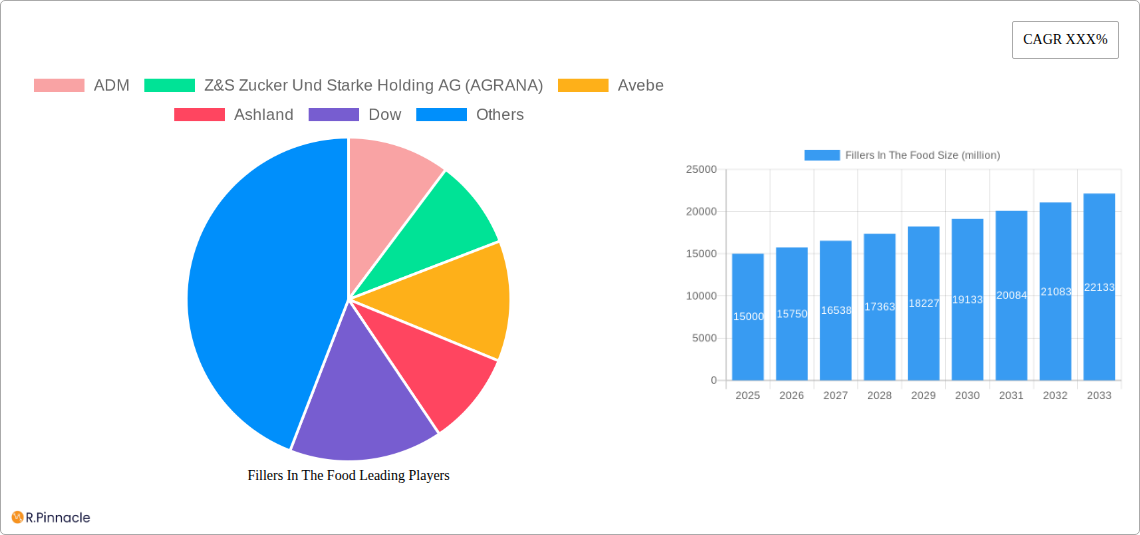
The competitive landscape is characterized by a mix of large multinational corporations and specialized regional players. Key players like ADM, AGRANA, Avebe, Ashland, and Cargill are leveraging their extensive distribution networks and technological expertise to maintain market leadership. However, the increasing focus on sustainability and the demand for novel functionalities are fostering innovation and encouraging smaller companies to enter the market. The forecast period (2025-2033) indicates a sustained growth trajectory, primarily driven by the continued expansion of the processed food industry across various regions. This growth will be influenced by the development of new food products requiring texture modification and cost-effective solutions. Further market segmentation studies are required for a more granular understanding of emerging trends and regional variations in consumer preference and regulatory environments.
Fillers In The Food Market Report: 2019-2033 – A Comprehensive Analysis
This comprehensive report provides a detailed analysis of the global Fillers In The Food market, offering invaluable insights for industry professionals, investors, and strategic decision-makers. The study period spans 2019-2033, with 2025 serving as the base and estimated year. The report leverages extensive data analysis to forecast market trends and growth projections through 2033. Millions are used for all value references.
Fillers In The Food Market Structure & Innovation Trends
This section analyzes the market's competitive landscape, highlighting key players, their market share, and recent M&A activities. The report explores the impact of regulatory frameworks, technological innovation, and the emergence of substitute products on market dynamics. We examine end-user demographics and their preferences influencing filler selection.
- Market Concentration: The market exhibits a moderately concentrated structure with a few major players holding significant market share. ADM, AGRANA, and Cargill are estimated to collectively hold xx% of the market share in 2025.
- Innovation Drivers: Growing demand for cost-effective and functional food products drives innovation in filler technology, particularly in developing bio-based and sustainable alternatives.
- Regulatory Landscape: Stringent food safety regulations and labeling requirements influence product development and market access.
- M&A Activity: The historical period (2019-2024) witnessed xx M&A deals totaling approximately $xx million, primarily driven by consolidation efforts and expansion into new market segments. Examples include mergers between smaller filler producers and larger ingredient companies. The forecast period is expected to see a similar, if not higher, level of activity.
- Product Substitutes: The emergence of novel, sustainable, and functional fillers presents competition to traditional options.
Fillers In The Food Market Dynamics & Trends
This section delves into the factors driving market growth, including technological advancements, changing consumer preferences, and competitive pressures. We analyze market penetration rates and project the compound annual growth rate (CAGR) for the forecast period.
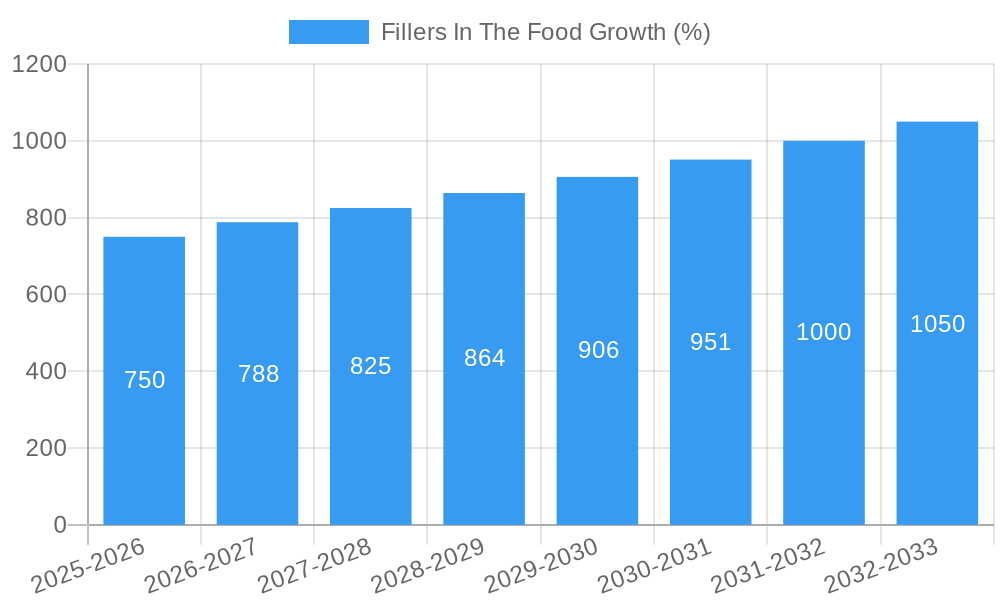
The global Fillers In The Food market is expected to witness robust growth, driven by increasing demand for processed foods, particularly in developing economies. Technological advancements in filler production, leading to improved functionality and cost-effectiveness, are further fueling market expansion. Consumer preferences for healthier and more sustainable food products are pushing the development of novel fillers with improved nutritional profiles and reduced environmental impact. Intense competition amongst key players necessitates continuous innovation and strategic partnerships to maintain market share. The projected CAGR for the forecast period (2025-2033) is estimated to be xx%. Market penetration is expected to reach xx% by 2033. The market's growth will also be influenced by fluctuations in raw material prices and global economic conditions.
Dominant Regions & Segments in Fillers In The Food
This section identifies the leading regions and market segments within the Fillers In The Food industry, based on application (Meat and Seafood, Dairy, Beverage, Others) and type (Starch, Cellulose, Calcium Carbonate, Talc, Others).
Leading Region: [Specific region, e.g., North America] is currently the dominant region, driven by high processed food consumption and a robust food processing industry.
Leading Segment (Application): The Meat and Seafood segment currently holds the largest market share due to the high volume of processed meat and seafood products.
Leading Segment (Type): Starch based fillers maintain the largest market share due to its widespread application and cost-effectiveness.
Key Drivers:
- North America: Strong demand from the processed food industry, well-established infrastructure, and high disposable incomes.
- Europe: High consumption of processed food products, stringent food safety regulations driving innovation.
- Asia Pacific: Rapid economic growth, increasing disposable incomes, and rising demand for convenience foods in developing countries.
Fillers In The Food Product Innovations
Recent innovations focus on developing fillers with enhanced functionalities, such as improved texture, water-binding capacity, and stability. This includes the use of novel materials and advanced processing techniques. The market is seeing a rising demand for bio-based and sustainable fillers, driving innovation in this area. The development of tailored fillers, designed to meet specific application requirements, is another significant trend. These innovations aim to improve product quality, enhance cost-efficiency, and address consumer demand for clean-label ingredients.
Report Scope & Segmentation Analysis
This report segments the Fillers In The Food market by application (Meat and Seafood, Dairy, Beverage, Others) and type (Starch, Cellulose, Calcium Carbonate, Talc, Others). Each segment’s growth projections, market size, and competitive dynamics are assessed. Detailed analyses are provided for each segment in the full report. For example, the starch segment is projected to grow at a CAGR of xx% due to its versatility and cost-effectiveness. The cellulose segment is experiencing growth driven by increased demand for sustainable and bio-based fillers.
Key Drivers of Fillers In The Food Growth
Several factors are driving the growth of the Fillers In The Food market. These include:
- Growing demand for processed foods: The increasing consumption of processed foods worldwide fuels the need for cost-effective fillers.
- Technological advancements: Innovation in filler technology leads to improved product functionality and reduced costs.
- Favorable regulatory environment: While regulations are stringent, they are also creating opportunities for innovation in sustainable and functional fillers.
Challenges in the Fillers In The Food Sector
The Fillers In The Food sector faces certain challenges, including:
- Fluctuating raw material prices: Volatility in the price of raw materials impacts profitability.
- Stringent regulations: Compliance with strict food safety and labeling requirements increases operational costs.
- Intense competition: The presence of numerous players leads to competitive pricing pressures.
Emerging Opportunities in Fillers In The Food
Several emerging trends present significant growth opportunities:
- Growing demand for clean-label and natural fillers: Consumers are increasingly seeking natural and minimally processed foods.
- Development of sustainable and bio-based fillers: The industry is focusing on eco-friendly and sustainable options.
- Expansion into emerging markets: Developing economies present untapped potential for growth.
Leading Players in the Fillers In The Food Market
- ADM
- Z&S Zucker Und Starke Holding AG (AGRANA)
- Avebe
- Ashland
- Dow
- Shin-Etsu
- Cargill
- Belgian Securities B.V. (Imerys)
- Omya
- Mondo Minerals
- Nippon Talc
- Rayonier Advanced Materials
- Huber Engineered Materials
Key Developments in the Fillers In The Food Industry
- 2022 Q4: ADM launched a new line of sustainable starch-based fillers.
- 2023 Q1: AGRANA acquired a smaller filler producer, expanding its market reach.
- 2023 Q3: Cargill invested in research and development for bio-based fillers. (Further developments are detailed in the full report.)
Future Outlook for the Fillers In The Food Market
The Fillers In The Food market is poised for significant growth in the coming years, driven by the factors outlined above. The market is expected to experience continued innovation, with a focus on sustainable and functional fillers. Companies that can adapt to changing consumer preferences and regulatory environments will be best positioned for success. The forecast indicates a robust growth trajectory, particularly in emerging markets, with further consolidation expected among market players.
Fillers In The Food Segmentation
-
1. Application
- 1.1. Meat and Seafood
- 1.2. Dairy
- 1.3. Beverage
- 1.4. Others
-
2. Type
- 2.1. Starch
- 2.2. Cellulose
- 2.3. Calcium Carbonate
- 2.4. Talc
- 2.5. Others
Fillers In The Food Segmentation By Geography
-
1. North America
- 1.1. United States
- 1.2. Canada
- 1.3. Mexico
-
2. South America
- 2.1. Brazil
- 2.2. Argentina
- 2.3. Rest of South America
-
3. Europe
- 3.1. United Kingdom
- 3.2. Germany
- 3.3. France
- 3.4. Italy
- 3.5. Spain
- 3.6. Russia
- 3.7. Benelux
- 3.8. Nordics
- 3.9. Rest of Europe
-
4. Middle East & Africa
- 4.1. Turkey
- 4.2. Israel
- 4.3. GCC
- 4.4. North Africa
- 4.5. South Africa
- 4.6. Rest of Middle East & Africa
-
5. Asia Pacific
- 5.1. China
- 5.2. India
- 5.3. Japan
- 5.4. South Korea
- 5.5. ASEAN
- 5.6. Oceania
- 5.7. Rest of Asia Pacific

Fillers In The Food REPORT HIGHLIGHTS
| Aspects | Details |
|---|---|
| Study Period | 2019-2033 |
| Base Year | 2024 |
| Estimated Year | 2025 |
| Forecast Period | 2025-2033 |
| Historical Period | 2019-2024 |
| Growth Rate | CAGR of XXX% from 2019-2033 |
| Segmentation |
|
Table of Contents
- 1. Introduction
- 1.1. Research Scope
- 1.2. Market Segmentation
- 1.3. Research Methodology
- 1.4. Definitions and Assumptions
- 2. Executive Summary
- 2.1. Introduction
- 3. Market Dynamics
- 3.1. Introduction
- 3.2. Market Drivers
- 3.3. Market Restrains
- 3.4. Market Trends
- 4. Market Factor Analysis
- 4.1. Porters Five Forces
- 4.2. Supply/Value Chain
- 4.3. PESTEL analysis
- 4.4. Market Entropy
- 4.5. Patent/Trademark Analysis
- 5. Global Fillers In The Food Analysis, Insights and Forecast, 2019-2031
- 5.1. Market Analysis, Insights and Forecast - by Application
- 5.1.1. Meat and Seafood
- 5.1.2. Dairy
- 5.1.3. Beverage
- 5.1.4. Others
- 5.2. Market Analysis, Insights and Forecast - by Type
- 5.2.1. Starch
- 5.2.2. Cellulose
- 5.2.3. Calcium Carbonate
- 5.2.4. Talc
- 5.2.5. Others
- 5.3. Market Analysis, Insights and Forecast - by Region
- 5.3.1. North America
- 5.3.2. South America
- 5.3.3. Europe
- 5.3.4. Middle East & Africa
- 5.3.5. Asia Pacific
- 5.1. Market Analysis, Insights and Forecast - by Application
- 6. North America Fillers In The Food Analysis, Insights and Forecast, 2019-2031
- 6.1. Market Analysis, Insights and Forecast - by Application
- 6.1.1. Meat and Seafood
- 6.1.2. Dairy
- 6.1.3. Beverage
- 6.1.4. Others
- 6.2. Market Analysis, Insights and Forecast - by Type
- 6.2.1. Starch
- 6.2.2. Cellulose
- 6.2.3. Calcium Carbonate
- 6.2.4. Talc
- 6.2.5. Others
- 6.1. Market Analysis, Insights and Forecast - by Application
- 7. South America Fillers In The Food Analysis, Insights and Forecast, 2019-2031
- 7.1. Market Analysis, Insights and Forecast - by Application
- 7.1.1. Meat and Seafood
- 7.1.2. Dairy
- 7.1.3. Beverage
- 7.1.4. Others
- 7.2. Market Analysis, Insights and Forecast - by Type
- 7.2.1. Starch
- 7.2.2. Cellulose
- 7.2.3. Calcium Carbonate
- 7.2.4. Talc
- 7.2.5. Others
- 7.1. Market Analysis, Insights and Forecast - by Application
- 8. Europe Fillers In The Food Analysis, Insights and Forecast, 2019-2031
- 8.1. Market Analysis, Insights and Forecast - by Application
- 8.1.1. Meat and Seafood
- 8.1.2. Dairy
- 8.1.3. Beverage
- 8.1.4. Others
- 8.2. Market Analysis, Insights and Forecast - by Type
- 8.2.1. Starch
- 8.2.2. Cellulose
- 8.2.3. Calcium Carbonate
- 8.2.4. Talc
- 8.2.5. Others
- 8.1. Market Analysis, Insights and Forecast - by Application
- 9. Middle East & Africa Fillers In The Food Analysis, Insights and Forecast, 2019-2031
- 9.1. Market Analysis, Insights and Forecast - by Application
- 9.1.1. Meat and Seafood
- 9.1.2. Dairy
- 9.1.3. Beverage
- 9.1.4. Others
- 9.2. Market Analysis, Insights and Forecast - by Type
- 9.2.1. Starch
- 9.2.2. Cellulose
- 9.2.3. Calcium Carbonate
- 9.2.4. Talc
- 9.2.5. Others
- 9.1. Market Analysis, Insights and Forecast - by Application
- 10. Asia Pacific Fillers In The Food Analysis, Insights and Forecast, 2019-2031
- 10.1. Market Analysis, Insights and Forecast - by Application
- 10.1.1. Meat and Seafood
- 10.1.2. Dairy
- 10.1.3. Beverage
- 10.1.4. Others
- 10.2. Market Analysis, Insights and Forecast - by Type
- 10.2.1. Starch
- 10.2.2. Cellulose
- 10.2.3. Calcium Carbonate
- 10.2.4. Talc
- 10.2.5. Others
- 10.1. Market Analysis, Insights and Forecast - by Application
- 11. Competitive Analysis
- 11.1. Global Market Share Analysis 2024
- 11.2. Company Profiles
- 11.2.1 ADM
- 11.2.1.1. Overview
- 11.2.1.2. Products
- 11.2.1.3. SWOT Analysis
- 11.2.1.4. Recent Developments
- 11.2.1.5. Financials (Based on Availability)
- 11.2.2 Z&S Zucker Und Starke Holding AG (AGRANA)
- 11.2.2.1. Overview
- 11.2.2.2. Products
- 11.2.2.3. SWOT Analysis
- 11.2.2.4. Recent Developments
- 11.2.2.5. Financials (Based on Availability)
- 11.2.3 Avebe
- 11.2.3.1. Overview
- 11.2.3.2. Products
- 11.2.3.3. SWOT Analysis
- 11.2.3.4. Recent Developments
- 11.2.3.5. Financials (Based on Availability)
- 11.2.4 Ashland
- 11.2.4.1. Overview
- 11.2.4.2. Products
- 11.2.4.3. SWOT Analysis
- 11.2.4.4. Recent Developments
- 11.2.4.5. Financials (Based on Availability)
- 11.2.5 Dow
- 11.2.5.1. Overview
- 11.2.5.2. Products
- 11.2.5.3. SWOT Analysis
- 11.2.5.4. Recent Developments
- 11.2.5.5. Financials (Based on Availability)
- 11.2.6 Shin-Etsu
- 11.2.6.1. Overview
- 11.2.6.2. Products
- 11.2.6.3. SWOT Analysis
- 11.2.6.4. Recent Developments
- 11.2.6.5. Financials (Based on Availability)
- 11.2.7 Cargill
- 11.2.7.1. Overview
- 11.2.7.2. Products
- 11.2.7.3. SWOT Analysis
- 11.2.7.4. Recent Developments
- 11.2.7.5. Financials (Based on Availability)
- 11.2.8 Belgian Securities B.V. (Imerys)
- 11.2.8.1. Overview
- 11.2.8.2. Products
- 11.2.8.3. SWOT Analysis
- 11.2.8.4. Recent Developments
- 11.2.8.5. Financials (Based on Availability)
- 11.2.9 Omya
- 11.2.9.1. Overview
- 11.2.9.2. Products
- 11.2.9.3. SWOT Analysis
- 11.2.9.4. Recent Developments
- 11.2.9.5. Financials (Based on Availability)
- 11.2.10 Mondo Minerals
- 11.2.10.1. Overview
- 11.2.10.2. Products
- 11.2.10.3. SWOT Analysis
- 11.2.10.4. Recent Developments
- 11.2.10.5. Financials (Based on Availability)
- 11.2.11 Nippon Talc
- 11.2.11.1. Overview
- 11.2.11.2. Products
- 11.2.11.3. SWOT Analysis
- 11.2.11.4. Recent Developments
- 11.2.11.5. Financials (Based on Availability)
- 11.2.12 Rayonier Advanced Materials
- 11.2.12.1. Overview
- 11.2.12.2. Products
- 11.2.12.3. SWOT Analysis
- 11.2.12.4. Recent Developments
- 11.2.12.5. Financials (Based on Availability)
- 11.2.13 Huber Engineered Materials
- 11.2.13.1. Overview
- 11.2.13.2. Products
- 11.2.13.3. SWOT Analysis
- 11.2.13.4. Recent Developments
- 11.2.13.5. Financials (Based on Availability)
- 11.2.1 ADM
List of Figures
- Figure 1: Global Fillers In The Food Revenue Breakdown (million, %) by Region 2024 & 2032
- Figure 2: Global Fillers In The Food Volume Breakdown (K, %) by Region 2024 & 2032
- Figure 3: North America Fillers In The Food Revenue (million), by Application 2024 & 2032
- Figure 4: North America Fillers In The Food Volume (K), by Application 2024 & 2032
- Figure 5: North America Fillers In The Food Revenue Share (%), by Application 2024 & 2032
- Figure 6: North America Fillers In The Food Volume Share (%), by Application 2024 & 2032
- Figure 7: North America Fillers In The Food Revenue (million), by Type 2024 & 2032
- Figure 8: North America Fillers In The Food Volume (K), by Type 2024 & 2032
- Figure 9: North America Fillers In The Food Revenue Share (%), by Type 2024 & 2032
- Figure 10: North America Fillers In The Food Volume Share (%), by Type 2024 & 2032
- Figure 11: North America Fillers In The Food Revenue (million), by Country 2024 & 2032
- Figure 12: North America Fillers In The Food Volume (K), by Country 2024 & 2032
- Figure 13: North America Fillers In The Food Revenue Share (%), by Country 2024 & 2032
- Figure 14: North America Fillers In The Food Volume Share (%), by Country 2024 & 2032
- Figure 15: South America Fillers In The Food Revenue (million), by Application 2024 & 2032
- Figure 16: South America Fillers In The Food Volume (K), by Application 2024 & 2032
- Figure 17: South America Fillers In The Food Revenue Share (%), by Application 2024 & 2032
- Figure 18: South America Fillers In The Food Volume Share (%), by Application 2024 & 2032
- Figure 19: South America Fillers In The Food Revenue (million), by Type 2024 & 2032
- Figure 20: South America Fillers In The Food Volume (K), by Type 2024 & 2032
- Figure 21: South America Fillers In The Food Revenue Share (%), by Type 2024 & 2032
- Figure 22: South America Fillers In The Food Volume Share (%), by Type 2024 & 2032
- Figure 23: South America Fillers In The Food Revenue (million), by Country 2024 & 2032
- Figure 24: South America Fillers In The Food Volume (K), by Country 2024 & 2032
- Figure 25: South America Fillers In The Food Revenue Share (%), by Country 2024 & 2032
- Figure 26: South America Fillers In The Food Volume Share (%), by Country 2024 & 2032
- Figure 27: Europe Fillers In The Food Revenue (million), by Application 2024 & 2032
- Figure 28: Europe Fillers In The Food Volume (K), by Application 2024 & 2032
- Figure 29: Europe Fillers In The Food Revenue Share (%), by Application 2024 & 2032
- Figure 30: Europe Fillers In The Food Volume Share (%), by Application 2024 & 2032
- Figure 31: Europe Fillers In The Food Revenue (million), by Type 2024 & 2032
- Figure 32: Europe Fillers In The Food Volume (K), by Type 2024 & 2032
- Figure 33: Europe Fillers In The Food Revenue Share (%), by Type 2024 & 2032
- Figure 34: Europe Fillers In The Food Volume Share (%), by Type 2024 & 2032
- Figure 35: Europe Fillers In The Food Revenue (million), by Country 2024 & 2032
- Figure 36: Europe Fillers In The Food Volume (K), by Country 2024 & 2032
- Figure 37: Europe Fillers In The Food Revenue Share (%), by Country 2024 & 2032
- Figure 38: Europe Fillers In The Food Volume Share (%), by Country 2024 & 2032
- Figure 39: Middle East & Africa Fillers In The Food Revenue (million), by Application 2024 & 2032
- Figure 40: Middle East & Africa Fillers In The Food Volume (K), by Application 2024 & 2032
- Figure 41: Middle East & Africa Fillers In The Food Revenue Share (%), by Application 2024 & 2032
- Figure 42: Middle East & Africa Fillers In The Food Volume Share (%), by Application 2024 & 2032
- Figure 43: Middle East & Africa Fillers In The Food Revenue (million), by Type 2024 & 2032
- Figure 44: Middle East & Africa Fillers In The Food Volume (K), by Type 2024 & 2032
- Figure 45: Middle East & Africa Fillers In The Food Revenue Share (%), by Type 2024 & 2032
- Figure 46: Middle East & Africa Fillers In The Food Volume Share (%), by Type 2024 & 2032
- Figure 47: Middle East & Africa Fillers In The Food Revenue (million), by Country 2024 & 2032
- Figure 48: Middle East & Africa Fillers In The Food Volume (K), by Country 2024 & 2032
- Figure 49: Middle East & Africa Fillers In The Food Revenue Share (%), by Country 2024 & 2032
- Figure 50: Middle East & Africa Fillers In The Food Volume Share (%), by Country 2024 & 2032
- Figure 51: Asia Pacific Fillers In The Food Revenue (million), by Application 2024 & 2032
- Figure 52: Asia Pacific Fillers In The Food Volume (K), by Application 2024 & 2032
- Figure 53: Asia Pacific Fillers In The Food Revenue Share (%), by Application 2024 & 2032
- Figure 54: Asia Pacific Fillers In The Food Volume Share (%), by Application 2024 & 2032
- Figure 55: Asia Pacific Fillers In The Food Revenue (million), by Type 2024 & 2032
- Figure 56: Asia Pacific Fillers In The Food Volume (K), by Type 2024 & 2032
- Figure 57: Asia Pacific Fillers In The Food Revenue Share (%), by Type 2024 & 2032
- Figure 58: Asia Pacific Fillers In The Food Volume Share (%), by Type 2024 & 2032
- Figure 59: Asia Pacific Fillers In The Food Revenue (million), by Country 2024 & 2032
- Figure 60: Asia Pacific Fillers In The Food Volume (K), by Country 2024 & 2032
- Figure 61: Asia Pacific Fillers In The Food Revenue Share (%), by Country 2024 & 2032
- Figure 62: Asia Pacific Fillers In The Food Volume Share (%), by Country 2024 & 2032
List of Tables
- Table 1: Global Fillers In The Food Revenue million Forecast, by Region 2019 & 2032
- Table 2: Global Fillers In The Food Volume K Forecast, by Region 2019 & 2032
- Table 3: Global Fillers In The Food Revenue million Forecast, by Application 2019 & 2032
- Table 4: Global Fillers In The Food Volume K Forecast, by Application 2019 & 2032
- Table 5: Global Fillers In The Food Revenue million Forecast, by Type 2019 & 2032
- Table 6: Global Fillers In The Food Volume K Forecast, by Type 2019 & 2032
- Table 7: Global Fillers In The Food Revenue million Forecast, by Region 2019 & 2032
- Table 8: Global Fillers In The Food Volume K Forecast, by Region 2019 & 2032
- Table 9: Global Fillers In The Food Revenue million Forecast, by Application 2019 & 2032
- Table 10: Global Fillers In The Food Volume K Forecast, by Application 2019 & 2032
- Table 11: Global Fillers In The Food Revenue million Forecast, by Type 2019 & 2032
- Table 12: Global Fillers In The Food Volume K Forecast, by Type 2019 & 2032
- Table 13: Global Fillers In The Food Revenue million Forecast, by Country 2019 & 2032
- Table 14: Global Fillers In The Food Volume K Forecast, by Country 2019 & 2032
- Table 15: United States Fillers In The Food Revenue (million) Forecast, by Application 2019 & 2032
- Table 16: United States Fillers In The Food Volume (K) Forecast, by Application 2019 & 2032
- Table 17: Canada Fillers In The Food Revenue (million) Forecast, by Application 2019 & 2032
- Table 18: Canada Fillers In The Food Volume (K) Forecast, by Application 2019 & 2032
- Table 19: Mexico Fillers In The Food Revenue (million) Forecast, by Application 2019 & 2032
- Table 20: Mexico Fillers In The Food Volume (K) Forecast, by Application 2019 & 2032
- Table 21: Global Fillers In The Food Revenue million Forecast, by Application 2019 & 2032
- Table 22: Global Fillers In The Food Volume K Forecast, by Application 2019 & 2032
- Table 23: Global Fillers In The Food Revenue million Forecast, by Type 2019 & 2032
- Table 24: Global Fillers In The Food Volume K Forecast, by Type 2019 & 2032
- Table 25: Global Fillers In The Food Revenue million Forecast, by Country 2019 & 2032
- Table 26: Global Fillers In The Food Volume K Forecast, by Country 2019 & 2032
- Table 27: Brazil Fillers In The Food Revenue (million) Forecast, by Application 2019 & 2032
- Table 28: Brazil Fillers In The Food Volume (K) Forecast, by Application 2019 & 2032
- Table 29: Argentina Fillers In The Food Revenue (million) Forecast, by Application 2019 & 2032
- Table 30: Argentina Fillers In The Food Volume (K) Forecast, by Application 2019 & 2032
- Table 31: Rest of South America Fillers In The Food Revenue (million) Forecast, by Application 2019 & 2032
- Table 32: Rest of South America Fillers In The Food Volume (K) Forecast, by Application 2019 & 2032
- Table 33: Global Fillers In The Food Revenue million Forecast, by Application 2019 & 2032
- Table 34: Global Fillers In The Food Volume K Forecast, by Application 2019 & 2032
- Table 35: Global Fillers In The Food Revenue million Forecast, by Type 2019 & 2032
- Table 36: Global Fillers In The Food Volume K Forecast, by Type 2019 & 2032
- Table 37: Global Fillers In The Food Revenue million Forecast, by Country 2019 & 2032
- Table 38: Global Fillers In The Food Volume K Forecast, by Country 2019 & 2032
- Table 39: United Kingdom Fillers In The Food Revenue (million) Forecast, by Application 2019 & 2032
- Table 40: United Kingdom Fillers In The Food Volume (K) Forecast, by Application 2019 & 2032
- Table 41: Germany Fillers In The Food Revenue (million) Forecast, by Application 2019 & 2032
- Table 42: Germany Fillers In The Food Volume (K) Forecast, by Application 2019 & 2032
- Table 43: France Fillers In The Food Revenue (million) Forecast, by Application 2019 & 2032
- Table 44: France Fillers In The Food Volume (K) Forecast, by Application 2019 & 2032
- Table 45: Italy Fillers In The Food Revenue (million) Forecast, by Application 2019 & 2032
- Table 46: Italy Fillers In The Food Volume (K) Forecast, by Application 2019 & 2032
- Table 47: Spain Fillers In The Food Revenue (million) Forecast, by Application 2019 & 2032
- Table 48: Spain Fillers In The Food Volume (K) Forecast, by Application 2019 & 2032
- Table 49: Russia Fillers In The Food Revenue (million) Forecast, by Application 2019 & 2032
- Table 50: Russia Fillers In The Food Volume (K) Forecast, by Application 2019 & 2032
- Table 51: Benelux Fillers In The Food Revenue (million) Forecast, by Application 2019 & 2032
- Table 52: Benelux Fillers In The Food Volume (K) Forecast, by Application 2019 & 2032
- Table 53: Nordics Fillers In The Food Revenue (million) Forecast, by Application 2019 & 2032
- Table 54: Nordics Fillers In The Food Volume (K) Forecast, by Application 2019 & 2032
- Table 55: Rest of Europe Fillers In The Food Revenue (million) Forecast, by Application 2019 & 2032
- Table 56: Rest of Europe Fillers In The Food Volume (K) Forecast, by Application 2019 & 2032
- Table 57: Global Fillers In The Food Revenue million Forecast, by Application 2019 & 2032
- Table 58: Global Fillers In The Food Volume K Forecast, by Application 2019 & 2032
- Table 59: Global Fillers In The Food Revenue million Forecast, by Type 2019 & 2032
- Table 60: Global Fillers In The Food Volume K Forecast, by Type 2019 & 2032
- Table 61: Global Fillers In The Food Revenue million Forecast, by Country 2019 & 2032
- Table 62: Global Fillers In The Food Volume K Forecast, by Country 2019 & 2032
- Table 63: Turkey Fillers In The Food Revenue (million) Forecast, by Application 2019 & 2032
- Table 64: Turkey Fillers In The Food Volume (K) Forecast, by Application 2019 & 2032
- Table 65: Israel Fillers In The Food Revenue (million) Forecast, by Application 2019 & 2032
- Table 66: Israel Fillers In The Food Volume (K) Forecast, by Application 2019 & 2032
- Table 67: GCC Fillers In The Food Revenue (million) Forecast, by Application 2019 & 2032
- Table 68: GCC Fillers In The Food Volume (K) Forecast, by Application 2019 & 2032
- Table 69: North Africa Fillers In The Food Revenue (million) Forecast, by Application 2019 & 2032
- Table 70: North Africa Fillers In The Food Volume (K) Forecast, by Application 2019 & 2032
- Table 71: South Africa Fillers In The Food Revenue (million) Forecast, by Application 2019 & 2032
- Table 72: South Africa Fillers In The Food Volume (K) Forecast, by Application 2019 & 2032
- Table 73: Rest of Middle East & Africa Fillers In The Food Revenue (million) Forecast, by Application 2019 & 2032
- Table 74: Rest of Middle East & Africa Fillers In The Food Volume (K) Forecast, by Application 2019 & 2032
- Table 75: Global Fillers In The Food Revenue million Forecast, by Application 2019 & 2032
- Table 76: Global Fillers In The Food Volume K Forecast, by Application 2019 & 2032
- Table 77: Global Fillers In The Food Revenue million Forecast, by Type 2019 & 2032
- Table 78: Global Fillers In The Food Volume K Forecast, by Type 2019 & 2032
- Table 79: Global Fillers In The Food Revenue million Forecast, by Country 2019 & 2032
- Table 80: Global Fillers In The Food Volume K Forecast, by Country 2019 & 2032
- Table 81: China Fillers In The Food Revenue (million) Forecast, by Application 2019 & 2032
- Table 82: China Fillers In The Food Volume (K) Forecast, by Application 2019 & 2032
- Table 83: India Fillers In The Food Revenue (million) Forecast, by Application 2019 & 2032
- Table 84: India Fillers In The Food Volume (K) Forecast, by Application 2019 & 2032
- Table 85: Japan Fillers In The Food Revenue (million) Forecast, by Application 2019 & 2032
- Table 86: Japan Fillers In The Food Volume (K) Forecast, by Application 2019 & 2032
- Table 87: South Korea Fillers In The Food Revenue (million) Forecast, by Application 2019 & 2032
- Table 88: South Korea Fillers In The Food Volume (K) Forecast, by Application 2019 & 2032
- Table 89: ASEAN Fillers In The Food Revenue (million) Forecast, by Application 2019 & 2032
- Table 90: ASEAN Fillers In The Food Volume (K) Forecast, by Application 2019 & 2032
- Table 91: Oceania Fillers In The Food Revenue (million) Forecast, by Application 2019 & 2032
- Table 92: Oceania Fillers In The Food Volume (K) Forecast, by Application 2019 & 2032
- Table 93: Rest of Asia Pacific Fillers In The Food Revenue (million) Forecast, by Application 2019 & 2032
- Table 94: Rest of Asia Pacific Fillers In The Food Volume (K) Forecast, by Application 2019 & 2032
Frequently Asked Questions
1. What is the projected Compound Annual Growth Rate (CAGR) of the Fillers In The Food?
The projected CAGR is approximately XXX%.
2. Which companies are prominent players in the Fillers In The Food?
Key companies in the market include ADM, Z&S Zucker Und Starke Holding AG (AGRANA), Avebe, Ashland, Dow, Shin-Etsu, Cargill, Belgian Securities B.V. (Imerys), Omya, Mondo Minerals, Nippon Talc, Rayonier Advanced Materials, Huber Engineered Materials.
3. What are the main segments of the Fillers In The Food?
The market segments include Application, Type.
4. Can you provide details about the market size?
The market size is estimated to be USD XXX million as of 2022.
5. What are some drivers contributing to market growth?
N/A
6. What are the notable trends driving market growth?
N/A
7. Are there any restraints impacting market growth?
N/A
8. Can you provide examples of recent developments in the market?
N/A
9. What pricing options are available for accessing the report?
Pricing options include single-user, multi-user, and enterprise licenses priced at USD 3950.00, USD 5925.00, and USD 7900.00 respectively.
10. Is the market size provided in terms of value or volume?
The market size is provided in terms of value, measured in million and volume, measured in K.
11. Are there any specific market keywords associated with the report?
Yes, the market keyword associated with the report is "Fillers In The Food," which aids in identifying and referencing the specific market segment covered.
12. How do I determine which pricing option suits my needs best?
The pricing options vary based on user requirements and access needs. Individual users may opt for single-user licenses, while businesses requiring broader access may choose multi-user or enterprise licenses for cost-effective access to the report.
13. Are there any additional resources or data provided in the Fillers In The Food report?
While the report offers comprehensive insights, it's advisable to review the specific contents or supplementary materials provided to ascertain if additional resources or data are available.
14. How can I stay updated on further developments or reports in the Fillers In The Food?
To stay informed about further developments, trends, and reports in the Fillers In The Food, consider subscribing to industry newsletters, following relevant companies and organizations, or regularly checking reputable industry news sources and publications.
Methodology
Step 1 - Identification of Relevant Samples Size from Population Database


Step 2 - Approaches for Defining Global Market Size (Value, Volume* & Price*)

Note*: In applicable scenarios
Step 3 - Data Sources
Primary Research
- Web Analytics
- Survey Reports
- Research Institute
- Latest Research Reports
- Opinion Leaders
Secondary Research
- Annual Reports
- White Paper
- Latest Press Release
- Industry Association
- Paid Database
- Investor Presentations

Step 4 - Data Triangulation
Involves using different sources of information in order to increase the validity of a study
These sources are likely to be stakeholders in a program - participants, other researchers, program staff, other community members, and so on.
Then we put all data in single framework & apply various statistical tools to find out the dynamic on the market.
During the analysis stage, feedback from the stakeholder groups would be compared to determine areas of agreement as well as areas of divergence


