

Key Insights
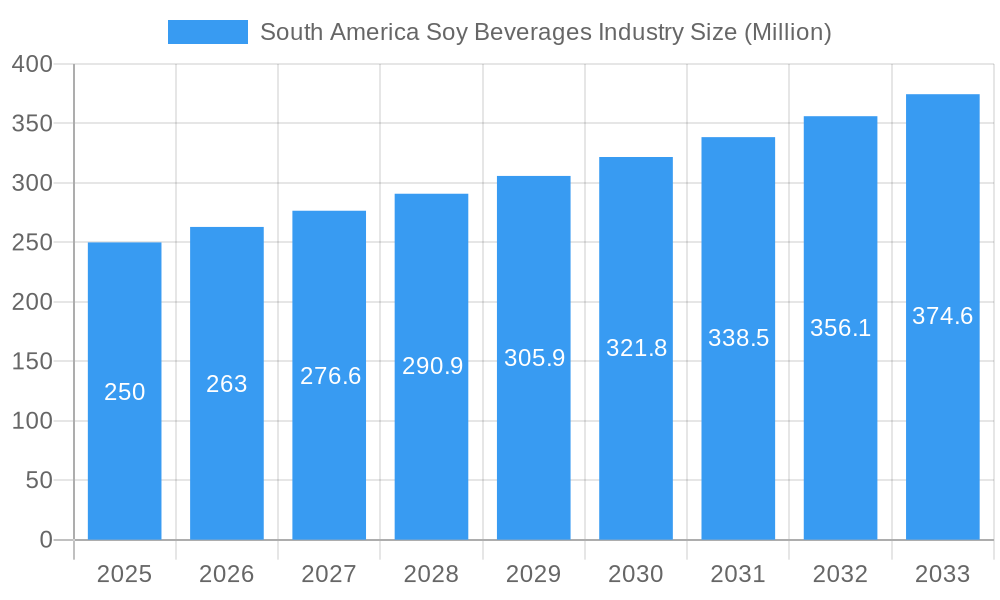
The South American soy beverage market, valued at $44702.1 million in 2025, is projected for significant expansion. This growth is propelled by increasing consumer focus on health and wellness, rising disposable incomes, and a growing inclination towards plant-based diets across the region. Brazil and Argentina lead the market, driven by a preference for convenient and nutritious dairy alternatives. The market is segmented by product type (soy milk, soy-based drinkable yogurt), flavor (plain, flavored), and distribution channel (supermarkets, online retail, convenience stores). Flavored varieties are outpacing plain options, reflecting a demand for diverse taste experiences. The proliferation of e-commerce platforms further facilitates market growth. Key challenges include price volatility of raw materials and competition from established dairy brands and other plant-based alternatives such as almond and oat milk. Strategic success will depend on highlighting health benefits, offering innovative products (organic, functional), and establishing robust distribution networks. A projected CAGR of 6.5% indicates a substantial market value increase by 2033, influenced by marketing emphasizing nutritional and sustainability advantages, alongside expansion into untapped South American regions.
South America Soy Beverages Industry Market Size (In Billion)
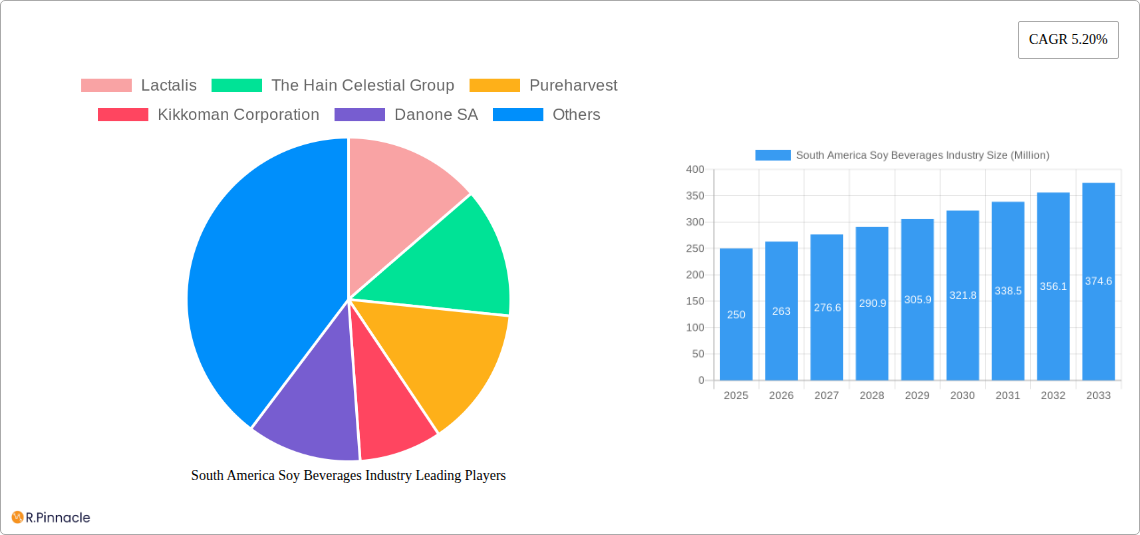
Key industry participants like Lactalis, Danone, and The Hain Celestial Group are leveraging their established distribution and brand recognition. Niche players, such as Jussara SA, are focusing on differentiation through organic offerings and region-specific flavors. The competitive landscape is characterized by continuous innovation in product development and marketing strategies from both established companies and emerging entrants. Sustainable growth necessitates product diversification, effective branding, and agile supply chains adaptable to evolving consumer preferences and input cost fluctuations.
South America Soy Beverages Industry Company Market Share
South America Soy Beverages Market Analysis and Forecast: 2019-2033
This comprehensive report offers an in-depth analysis of the South American soy beverage market, detailing market size, growth catalysts, obstacles, and future projections from 2019 to 2033. Designed for industry professionals, investors, and stakeholders seeking actionable intelligence, the report provides a thorough examination of the historical period (2019-2024) and a robust forecast for 2025-2033, with a base year of 2025. Key players, including Lactalis, Danone SA, and The Hain Celestial Group, are examined in detail.
South America Soy Beverages Industry Market Structure & Innovation Trends
This section analyzes the competitive landscape of the South America soy beverages market, focusing on market concentration, innovation drivers, regulatory frameworks, product substitutes, end-user demographics, and mergers and acquisitions (M&A) activities. The market is characterized by a mix of large multinational corporations and smaller regional players. Market share data reveals a concentration among top players, with Lactalis and Danone SA holding significant portions, while smaller companies cater to niche markets or regional preferences. The report details M&A activity, including the xx Million deal involving Lactalis' acquisition of joint venture assets in Brazil (Dec 2022). Innovation is driven by consumer demand for healthier and more convenient options, and the desire for improved taste and texture. Regulatory frameworks concerning food labeling and health claims influence product development and marketing strategies. Competition from alternative beverages, such as almond and oat milk, along with traditional dairy products, remains significant. The report provides a breakdown of end-user demographics, including age, income, and lifestyle preferences, highlighting key consumer segments for soy beverages.
- Market Concentration: High (xx%) among top players, with fragmented niche markets.
- M&A Activity: Significant activity observed, illustrated by Lactalis' acquisition of assets.
- Innovation Drivers: Health concerns, consumer preference for plant-based options, taste improvements.
- Regulatory Landscape: Impacts labeling, health claims, and product development.
South America Soy Beverages Industry Market Dynamics & Trends
The South America soy beverages market exhibits robust growth, driven by factors such as increasing health awareness, growing vegetarian and vegan populations, and the rising demand for convenient and nutritious food and beverage options. The market demonstrates strong growth potential, with a Compound Annual Growth Rate (CAGR) projected at xx% during the forecast period (2025-2033). Technological advancements in soy processing and product formulation contribute to improved taste and texture, driving market penetration and consumer adoption. Changing consumer preferences, particularly the inclination towards plant-based alternatives to dairy, presents a significant growth opportunity. Competitive dynamics are shaped by product innovation, pricing strategies, distribution network reach and marketing campaigns. The report analyzes the impact of technological disruptions, shifts in consumer preferences, and competitive dynamics on market growth. Market penetration is expected to reach xx% by 2033.
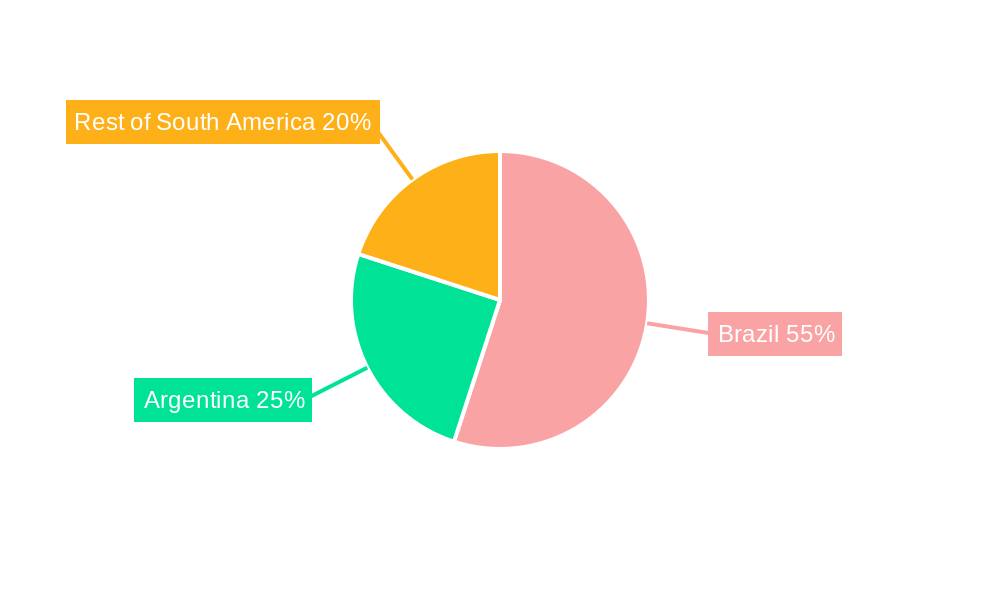
Dominant Regions & Segments in South America Soy Beverages Industry
Brazil holds the largest market share in South America, followed by Argentina and the rest of the South America region. This dominance is attributable to several key factors:
- Brazil: Large population, high soy production, established distribution networks, and rising consumer awareness of health and wellness.
- Argentina: Significant soy production and favorable economic conditions supporting local and international brand investment.
- Rest of South America: Shows growth potential, but faces infrastructure and economic challenges impacting market development.
In terms of product segments:
- Soy Milk: Dominates the market due to its widespread acceptance and versatility.
- Soy-based Drinkable Yogurt: Displays strong growth potential due to the increasing preference for healthier alternatives.
- Flavored Soy Beverages: Represents a significant market share due to the diverse taste preferences of consumers.
Distribution channels are also crucial. Supermarkets and hypermarkets command a major share but online retail is rapidly expanding, particularly in urban areas.
South America Soy Beverages Industry Product Innovations
Recent product innovations focus on improving the taste and texture of soy beverages, mimicking dairy products as closely as possible. Companies are also emphasizing fortified products with added vitamins and minerals to enhance nutritional value. The emphasis is on functional soy beverages, catering to specific health and wellness needs. Technological advances in processing and formulation play a vital role in this development. New product launches, such as Danone's plant-based baby formula (July 2022), illustrate these trends.
Report Scope & Segmentation Analysis
This report comprehensively segments the South America soy beverages market by product type (Soy Milk, Soy-based Drinkable Yogurt), flavor (Plain Soy Beverages, Flavored Soy Beverages), distribution channel (Supermarkets/Hypermarkets, Online Retail Stores, Convenience Stores, Other Distribution Channels), and geography (Brazil, Argentina, Rest of South America). Each segment's market size, growth projections, and competitive dynamics are meticulously analyzed, providing a holistic view of the market landscape. The report provides detailed projections of market size and growth for each segment throughout the forecast period. Competition within each segment varies, influenced by factors like brand recognition, pricing, and product differentiation.
Key Drivers of South America Soy Beverages Industry Growth
Several factors propel the growth of the South America soy beverages industry: the rising health consciousness among consumers favoring plant-based alternatives to dairy, the increasing awareness of the environmental benefits of soy milk, coupled with technological advances improving taste and texture, making soy beverages more appealing. Furthermore, favorable government policies promoting plant-based foods, and the expansion of distribution channels in underserved areas, contribute to market growth.
Challenges in the South America Soy Beverages Industry Sector
The South America soy beverages industry faces challenges, including fluctuating raw material prices (soybeans), intense competition from other plant-based beverages and dairy products, and concerns surrounding the environmental impact of soy production. Regulatory changes and inconsistent infrastructure in certain regions further pose hurdles. These factors influence pricing, profitability, and market access.
Emerging Opportunities in South America Soy Beverages Industry
Emerging opportunities lie in expanding into untapped markets within South America, exploring new product formats (e.g., ready-to-drink beverages), and introducing innovative flavors to cater to evolving consumer tastes. The development of functional soy beverages with added health benefits, alongside a strengthened focus on sustainability and ethical sourcing practices, presents significant opportunities for growth.
Leading Players in the South America Soy Beverages Industry Market
- Lactalis
- The Hain Celestial Group
- Pureharvest
- Kikkoman Corporation
- Danone SA
- Westsoy Soy Milk
- Pacific Foods
- The Coca-Cola Company
- Campbell Soup Company
- Jussara SA
Key Developments in South America Soy Beverages Industry
- Jul 2021: Danone SA announced plans for new plant-based milk alternatives, including soy milk.
- Jul 2022: Danone launched a new Dairy & Plant blend baby formula.
- Dec 2022: Lactalis acquired joint venture assets owned by Fonterra and Nestlé in Brazil, securing long-term licensing agreements for Nestlé trademarks.
These developments significantly impacted the market, leading to increased competition, expansion of product offerings, and consolidation within the industry.
Future Outlook for South America Soy Beverages Industry Market
The South America soy beverages market is poised for continued growth, fueled by increasing consumer demand for plant-based options and technological advancements in product development. Strategic partnerships, focus on sustainable practices, and innovative product launches will be key for success. The market's future potential hinges on adapting to changing consumer preferences and navigating the challenges presented by competition and fluctuating raw material prices. The xx% CAGR projection indicates a promising outlook for the industry.
South America Soy Beverages Industry Segmentation
-
1. Product Type
- 1.1. Soy Milk
- 1.2. Soy-based Drinkable Yogurt
-
2. Flavor
- 2.1. Plain Soy Beverages
- 2.2. Flavored Soy Beverages
-
3. Distribution Channel
- 3.1. Supermarkets/Hypermarkets
- 3.2. Online Retail Stores
- 3.3. Convenience Stores
- 3.4. Other Distribution Channels
-
4. Geopgraphy
- 4.1. Brazil
- 4.2. Argentina
- 4.3. Rest of South America
South America Soy Beverages Industry Segmentation By Geography
-
1. South America
- 1.1. Brazil
- 1.2. Argentina
- 1.3. Chile
- 1.4. Colombia
- 1.5. Peru
- 1.6. Venezuela
- 1.7. Ecuador
- 1.8. Bolivia
- 1.9. Paraguay
- 1.10. Uruguay
South America Soy Beverages Industry Regional Market Share
Geographic Coverage of South America Soy Beverages Industry
South America Soy Beverages Industry REPORT HIGHLIGHTS
| Aspects | Details |
|---|---|
| Study Period | 2020-2034 |
| Base Year | 2025 |
| Estimated Year | 2026 |
| Forecast Period | 2026-2034 |
| Historical Period | 2020-2025 |
| Growth Rate | CAGR of 6.5% from 2020-2034 |
| Segmentation |
|
Table of Contents
- 1. Introduction
- 1.1. Research Scope
- 1.2. Market Segmentation
- 1.3. Research Objective
- 1.4. Definitions and Assumptions
- 2. Executive Summary
- 2.1. Market Snapshot
- 3. Market Dynamics
- 3.1. Market Drivers
- 3.2. Market Restrains
- 3.3. Market Trends
- 3.4. Market Opportunities
- 4. Market Factor Analysis
- 4.1. Porters Five Forces
- 4.1.1. Bargaining Power of Suppliers
- 4.1.2. Bargaining Power of Buyers
- 4.1.3. Threat of New Entrants
- 4.1.4. Threat of Substitutes
- 4.1.5. Competitive Rivalry
- 4.2. PESTEL analysis
- 4.3. BCG Analysis
- 4.3.1. Stars (High Growth, High Market Share)
- 4.3.2. Cash Cows (Low Growth, High Market Share)
- 4.3.3. Question Mark (High Growth, Low Market Share)
- 4.3.4. Dogs (Low Growth, Low Market Share)
- 4.4. Ansoff Matrix Analysis
- 4.5. Supply Chain Analysis
- 4.6. Regulatory Landscape
- 4.7. Current Market Potential and Opportunity Assessment (TAM–SAM–SOM Framework)
- 4.8. PRI Analyst Note
- 4.1. Porters Five Forces
- 5. Market Analysis, Insights and Forecast 2021-2033
- 5.1. Market Analysis, Insights and Forecast - by Product Type
- 5.1.1. Soy Milk
- 5.1.2. Soy-based Drinkable Yogurt
- 5.2. Market Analysis, Insights and Forecast - by Flavor
- 5.2.1. Plain Soy Beverages
- 5.2.2. Flavored Soy Beverages
- 5.3. Market Analysis, Insights and Forecast - by Distribution Channel
- 5.3.1. Supermarkets/Hypermarkets
- 5.3.2. Online Retail Stores
- 5.3.3. Convenience Stores
- 5.3.4. Other Distribution Channels
- 5.4. Market Analysis, Insights and Forecast - by Geopgraphy
- 5.4.1. Brazil
- 5.4.2. Argentina
- 5.4.3. Rest of South America
- 5.5. Market Analysis, Insights and Forecast - by Region
- 5.5.1. South America
- 5.1. Market Analysis, Insights and Forecast - by Product Type
- 6. South America Soy Beverages Industry Analysis, Insights and Forecast, 2021-2033
- 6.1. Market Analysis, Insights and Forecast - by Product Type
- 6.1.1. Soy Milk
- 6.1.2. Soy-based Drinkable Yogurt
- 6.2. Market Analysis, Insights and Forecast - by Flavor
- 6.2.1. Plain Soy Beverages
- 6.2.2. Flavored Soy Beverages
- 6.3. Market Analysis, Insights and Forecast - by Distribution Channel
- 6.3.1. Supermarkets/Hypermarkets
- 6.3.2. Online Retail Stores
- 6.3.3. Convenience Stores
- 6.3.4. Other Distribution Channels
- 6.4. Market Analysis, Insights and Forecast - by Geopgraphy
- 6.4.1. Brazil
- 6.4.2. Argentina
- 6.4.3. Rest of South America
- 6.1. Market Analysis, Insights and Forecast - by Product Type
- 7. Competitive Analysis
- 7.1. Company Profiles
- 7.1.1 Lactalis
- 7.1.1.1. Company Overview
- 7.1.1.2. Products
- 7.1.1.3. Company Financials
- 7.1.1.4. SWOT Analysis
- 7.1.2 The Hain Celestial Group
- 7.1.2.1. Company Overview
- 7.1.2.2. Products
- 7.1.2.3. Company Financials
- 7.1.2.4. SWOT Analysis
- 7.1.3 Pureharvest
- 7.1.3.1. Company Overview
- 7.1.3.2. Products
- 7.1.3.3. Company Financials
- 7.1.3.4. SWOT Analysis
- 7.1.4 Kikkoman Corporation
- 7.1.4.1. Company Overview
- 7.1.4.2. Products
- 7.1.4.3. Company Financials
- 7.1.4.4. SWOT Analysis
- 7.1.5 Danone SA
- 7.1.5.1. Company Overview
- 7.1.5.2. Products
- 7.1.5.3. Company Financials
- 7.1.5.4. SWOT Analysis
- 7.1.6 Westsoy Soy Milk
- 7.1.6.1. Company Overview
- 7.1.6.2. Products
- 7.1.6.3. Company Financials
- 7.1.6.4. SWOT Analysis
- 7.1.7 Pacific Foods
- 7.1.7.1. Company Overview
- 7.1.7.2. Products
- 7.1.7.3. Company Financials
- 7.1.7.4. SWOT Analysis
- 7.1.8 The Coca-Cola Company
- 7.1.8.1. Company Overview
- 7.1.8.2. Products
- 7.1.8.3. Company Financials
- 7.1.8.4. SWOT Analysis
- 7.1.9 Campbell Soup Company
- 7.1.9.1. Company Overview
- 7.1.9.2. Products
- 7.1.9.3. Company Financials
- 7.1.9.4. SWOT Analysis
- 7.1.10 Jussara SA
- 7.1.10.1. Company Overview
- 7.1.10.2. Products
- 7.1.10.3. Company Financials
- 7.1.10.4. SWOT Analysis
- 7.1.1 Lactalis
- 7.2. Market Entropy
- 7.2.1 Company's Key Areas Served
- 7.2.2 Recent Developments
- 7.3. Company Market Share Analysis 2025
- 7.3.1 Top 5 Companies Market Share Analysis
- 7.3.2 Top 3 Companies Market Share Analysis
- 7.4. List of Potential Customers
- 8. Research Methodology
List of Figures
- Figure 1: South America Soy Beverages Industry Revenue Breakdown (million, %) by Product 2025 & 2033
- Figure 2: South America Soy Beverages Industry Share (%) by Company 2025
List of Tables
- Table 1: South America Soy Beverages Industry Revenue million Forecast, by Product Type 2020 & 2033
- Table 2: South America Soy Beverages Industry Revenue million Forecast, by Flavor 2020 & 2033
- Table 3: South America Soy Beverages Industry Revenue million Forecast, by Distribution Channel 2020 & 2033
- Table 4: South America Soy Beverages Industry Revenue million Forecast, by Geopgraphy 2020 & 2033
- Table 5: South America Soy Beverages Industry Revenue million Forecast, by Region 2020 & 2033
- Table 6: South America Soy Beverages Industry Revenue million Forecast, by Product Type 2020 & 2033
- Table 7: South America Soy Beverages Industry Revenue million Forecast, by Flavor 2020 & 2033
- Table 8: South America Soy Beverages Industry Revenue million Forecast, by Distribution Channel 2020 & 2033
- Table 9: South America Soy Beverages Industry Revenue million Forecast, by Geopgraphy 2020 & 2033
- Table 10: South America Soy Beverages Industry Revenue million Forecast, by Country 2020 & 2033
- Table 11: Brazil South America Soy Beverages Industry Revenue (million) Forecast, by Application 2020 & 2033
- Table 12: Argentina South America Soy Beverages Industry Revenue (million) Forecast, by Application 2020 & 2033
- Table 13: Chile South America Soy Beverages Industry Revenue (million) Forecast, by Application 2020 & 2033
- Table 14: Colombia South America Soy Beverages Industry Revenue (million) Forecast, by Application 2020 & 2033
- Table 15: Peru South America Soy Beverages Industry Revenue (million) Forecast, by Application 2020 & 2033
- Table 16: Venezuela South America Soy Beverages Industry Revenue (million) Forecast, by Application 2020 & 2033
- Table 17: Ecuador South America Soy Beverages Industry Revenue (million) Forecast, by Application 2020 & 2033
- Table 18: Bolivia South America Soy Beverages Industry Revenue (million) Forecast, by Application 2020 & 2033
- Table 19: Paraguay South America Soy Beverages Industry Revenue (million) Forecast, by Application 2020 & 2033
- Table 20: Uruguay South America Soy Beverages Industry Revenue (million) Forecast, by Application 2020 & 2033
Frequently Asked Questions
1. What is the projected Compound Annual Growth Rate (CAGR) of the South America Soy Beverages Industry?
The projected CAGR is approximately 6.5%.
2. Which companies are prominent players in the South America Soy Beverages Industry?
Key companies in the market include Lactalis, The Hain Celestial Group, Pureharvest, Kikkoman Corporation, Danone SA, Westsoy Soy Milk, Pacific Foods, The Coca-Cola Company, Campbell Soup Company, Jussara SA.
3. What are the main segments of the South America Soy Beverages Industry?
The market segments include Product Type, Flavor, Distribution Channel, Geopgraphy.
4. Can you provide details about the market size?
The market size is estimated to be USD 44702.1 million as of 2022.
5. What are some drivers contributing to market growth?
Increasing Sports Participation; Increasing Awareness about Health and Fitness.
6. What are the notable trends driving market growth?
Increasing Veganism in the Region.
7. Are there any restraints impacting market growth?
Adverse Effects of Overconsumption of Products.
8. Can you provide examples of recent developments in the market?
Dec 2022: French manufacturer Lactalis acquired the joint venture assets owned by Fonterra and Nestlé in Brazil. Lactalis announced that it has secured 'long-term' licensing agreements to use the Nestlé trademarks of Ninho, Neston, Molico, and Nesfit in Brazil and will continue to be marketed by DPA.
9. What pricing options are available for accessing the report?
Pricing options include single-user, multi-user, and enterprise licenses priced at USD 4750, USD 5250, and USD 8750 respectively.
10. Is the market size provided in terms of value or volume?
The market size is provided in terms of value, measured in million.
11. Are there any specific market keywords associated with the report?
Yes, the market keyword associated with the report is "South America Soy Beverages Industry," which aids in identifying and referencing the specific market segment covered.
12. How do I determine which pricing option suits my needs best?
The pricing options vary based on user requirements and access needs. Individual users may opt for single-user licenses, while businesses requiring broader access may choose multi-user or enterprise licenses for cost-effective access to the report.
13. Are there any additional resources or data provided in the South America Soy Beverages Industry report?
While the report offers comprehensive insights, it's advisable to review the specific contents or supplementary materials provided to ascertain if additional resources or data are available.
14. How can I stay updated on further developments or reports in the South America Soy Beverages Industry?
To stay informed about further developments, trends, and reports in the South America Soy Beverages Industry, consider subscribing to industry newsletters, following relevant companies and organizations, or regularly checking reputable industry news sources and publications.
Methodology
Step 1 - Identification of Relevant Samples Size from Population Database


Step 2 - Approaches for Defining Global Market Size (Value, Volume* & Price*)

Note*: In applicable scenarios
Step 3 - Data Sources
Primary Research
- Web Analytics
- Survey Reports
- Research Institute
- Latest Research Reports
- Opinion Leaders
Secondary Research
- Annual Reports
- White Paper
- Latest Press Release
- Industry Association
- Paid Database
- Investor Presentations

Step 4 - Data Triangulation
Involves using different sources of information in order to increase the validity of a study
These sources are likely to be stakeholders in a program - participants, other researchers, program staff, other community members, and so on.
Then we put all data in single framework & apply various statistical tools to find out the dynamic on the market.
During the analysis stage, feedback from the stakeholder groups would be compared to determine areas of agreement as well as areas of divergence