
Key Insights
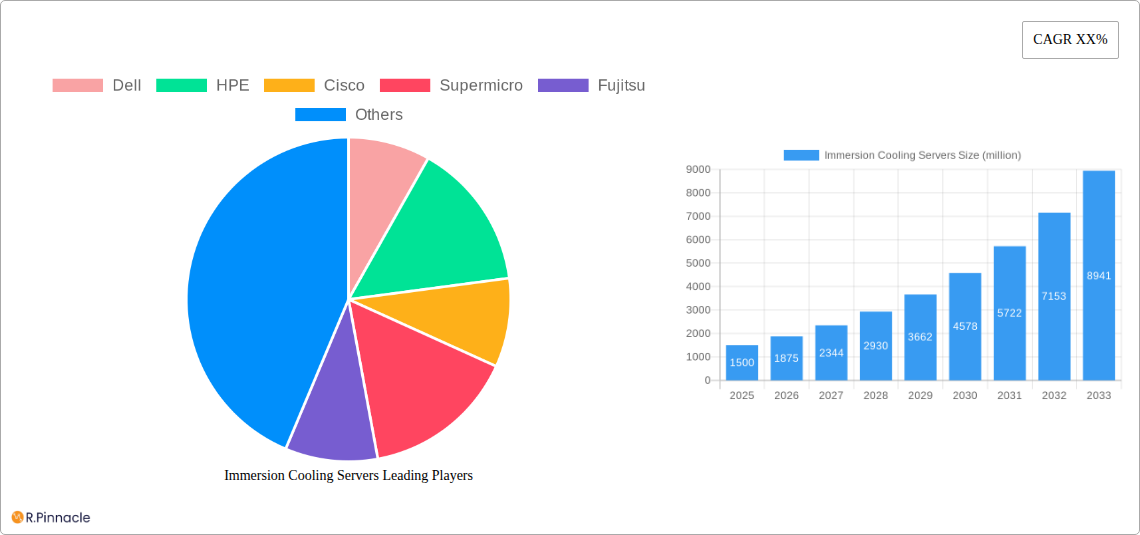
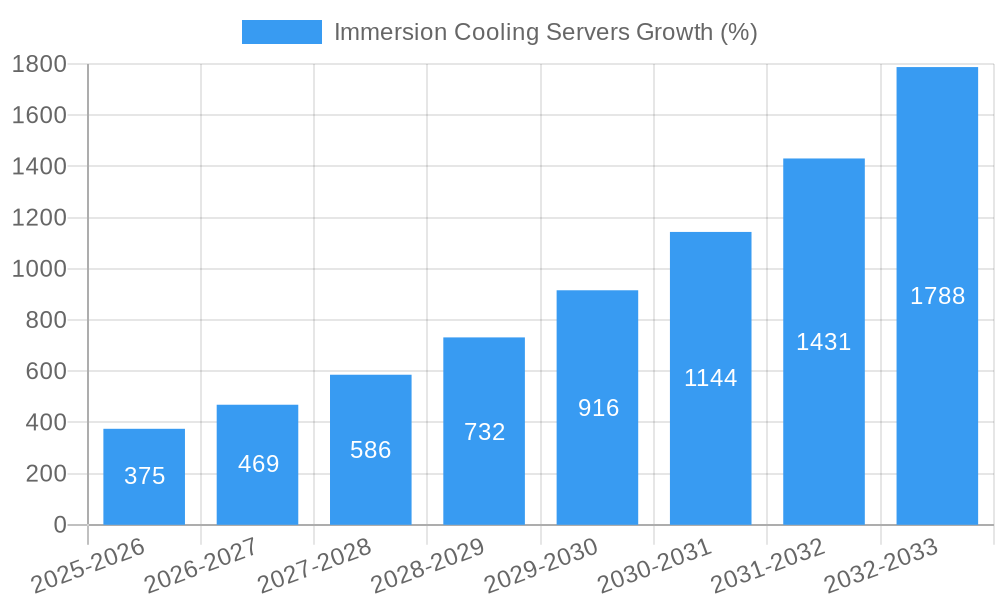
The immersion cooling server market is experiencing robust growth, driven by the increasing demand for high-performance computing (HPC) and data centers grappling with escalating energy costs and space constraints. The market, currently valued at approximately $1.5 billion in 2025, is projected to exhibit a Compound Annual Growth Rate (CAGR) of 25% from 2025 to 2033, reaching an estimated $10 billion by 2033. This expansion is fueled by several key factors. Firstly, the rise of AI, machine learning, and big data analytics necessitates significantly more powerful and energy-efficient servers, making immersion cooling a compelling solution. Secondly, the limitations of traditional air-cooling methods in handling the heat generated by high-density computing environments are pushing organizations towards more effective cooling technologies. Finally, the growing awareness of sustainability and the need to reduce carbon footprints in data centers are driving the adoption of immersion cooling, which significantly reduces energy consumption. The market is segmented by application (internet, telecommunications, financial, government, and others) and type (single-phase and two-phase immersion cooling). While single-phase currently dominates, two-phase is expected to gain significant traction due to its higher cooling efficiency.
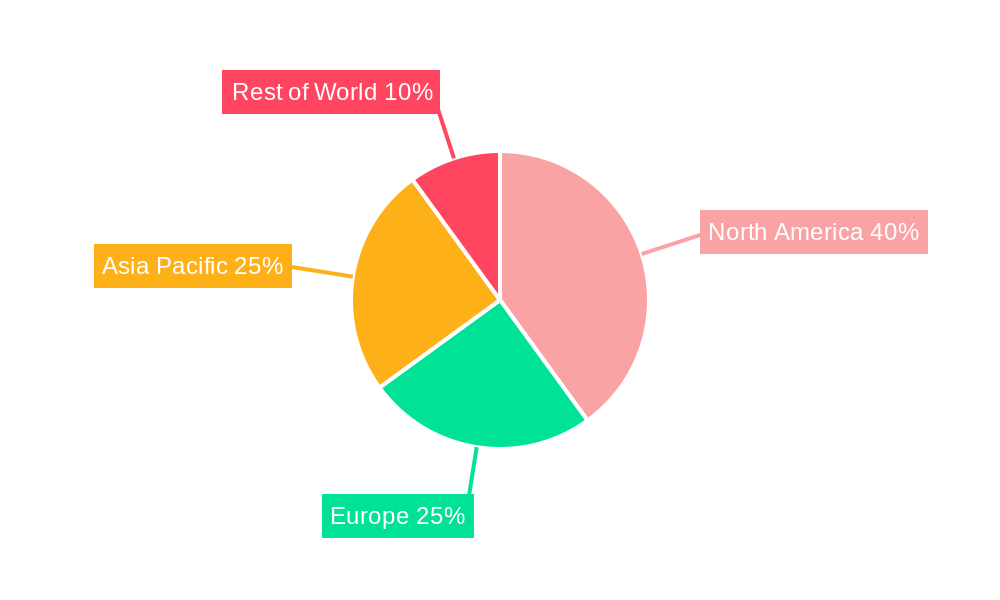
Major players like Dell, HPE, Cisco, and Supermicro are actively investing in R&D and expanding their product portfolios within the immersion cooling server segment. However, the high initial investment cost and the relative lack of standardization compared to air cooling remain challenges to broader adoption. Regional growth is expected to vary, with North America and Asia Pacific anticipated as leading markets due to the concentration of large data centers and technology companies. The European market is also projected to experience strong growth, driven by increasing government regulations promoting energy efficiency and sustainability. Despite these restraints, the long-term outlook for the immersion cooling server market remains highly positive, driven by technological advancements, supportive government policies, and increasing demand from key industries.
Immersion Cooling Servers Market Report: 2019-2033 - A Deep Dive into a $XX Million Industry
This comprehensive report provides an in-depth analysis of the global Immersion Cooling Servers market, projecting a value of $XX million by 2033. It covers the period from 2019 to 2033, with a focus on 2025, incorporating historical data (2019-2024), current estimates (2025), and future forecasts (2025-2033). The report offers actionable insights for industry professionals, investors, and strategists seeking to understand this rapidly evolving market. Key players analyzed include Dell, HPE, Cisco, Supermicro, Fujitsu, 2CRSI, Inspur, Sugon, H3C, Lenovo, GIGABYTE, Nettrix, PowerLeader, and Fii.
Immersion Cooling Servers Market Structure & Innovation Trends
This section analyzes the market's competitive landscape, innovation drivers, and regulatory influences. The market is characterized by a mix of established players like Dell and HPE, and emerging specialists like 2CRSI. Market concentration is moderate, with the top five companies holding an estimated xx% market share in 2025. Innovation is driven by the need for increased data center efficiency and reduced power consumption, leading to ongoing advancements in single-phase and two-phase immersion cooling technologies. Regulatory frameworks focusing on energy efficiency are further driving adoption. Product substitutes include traditional air cooling and liquid cooling systems, but immersion cooling's superior thermal performance is providing a competitive edge. M&A activity has been significant, with several deals valued at over $xx million in the past five years, indicating consolidation within the sector. End-user demographics show strong growth across the Internet, telecommunications, and financial sectors.
Immersion Cooling Servers Market Dynamics & Trends
The Immersion Cooling Servers market is experiencing robust growth, with a Compound Annual Growth Rate (CAGR) of xx% projected from 2025 to 2033. This growth is fueled by several key factors. The increasing demand for high-performance computing (HPC) and data center expansion is a major driver, pushing organizations to adopt more efficient cooling solutions. Technological advancements, such as improved dielectric fluids and more sophisticated immersion tank designs, are enhancing the efficiency and reliability of immersion cooling. Consumer preference is shifting towards sustainable and energy-efficient data center technologies, further boosting market adoption. Competitive dynamics are characterized by intense innovation, with companies focusing on developing differentiated products and services to gain market share. Market penetration for immersion cooling remains relatively low, but is expected to increase significantly due to the factors discussed above.
Dominant Regions & Segments in Immersion Cooling Servers
Leading Region: North America currently holds the largest market share, driven by strong demand from hyperscale data centers and a robust IT infrastructure. Key drivers include favorable economic policies, substantial investments in data center infrastructure, and strong government support for technological advancements. Asia Pacific is expected to witness the fastest growth, fueled by rapid digitization and increasing adoption across several sectors.
Dominant Application Segment: The Internet sector currently dominates the application segment, followed by Telecommunications. The high density computing needs of these sectors are perfectly suited to immersion cooling’s capabilities. Financial and Government sectors are also exhibiting significant growth, driven by increasing data security and compliance requirements.
Dominant Type: Single-phase immersion cooling currently holds a larger market share due to its lower cost and established technology. However, two-phase immersion cooling is expected to gain traction owing to its superior cooling capacity and potential for further efficiency gains.
Immersion Cooling Servers Product Innovations
Recent product developments include advancements in dielectric fluids, enhancing their thermal performance and environmental compatibility. Innovations in tank design, such as modular and scalable systems, are addressing the needs of diverse data center deployments. These innovations are leading to increased energy efficiency, improved reliability, and reduced operational costs, making immersion cooling a more attractive option for various applications. The market fit is strong, particularly for high-density computing environments where traditional cooling methods are inadequate.
Report Scope & Segmentation Analysis
This report segments the Immersion Cooling Servers market by application (Internet, Telecommunications, Financial, Government, Other) and type (Single-Phase Immersion Cooling, Two-Phase Immersion Cooling). Each segment’s growth projections, market size, and competitive dynamics are analyzed. The Internet segment is expected to maintain its dominance throughout the forecast period, showcasing significant growth potential. The two-phase immersion cooling segment is projected to experience faster growth compared to single-phase systems, driven by advancements in technology and improved cost-effectiveness.
Key Drivers of Immersion Cooling Servers Growth
The market's growth is driven by a confluence of factors. The escalating demand for high-performance computing, fueled by the growth of big data analytics, artificial intelligence, and machine learning, necessitates highly efficient cooling solutions. Stringent regulations promoting energy efficiency and reduced carbon footprint are further driving adoption. Economic incentives and government support for green technologies are also contributing to market expansion.
Challenges in the Immersion Cooling Servers Sector
The Immersion Cooling Servers sector faces several challenges. High initial investment costs and the need for specialized expertise can be barriers to adoption for smaller organizations. Supply chain disruptions and the availability of specialized dielectric fluids can impact market growth. Competition from established cooling technologies also presents a challenge. These factors can collectively slow down the widespread adoption of immersion cooling technology.
Emerging Opportunities in Immersion Cooling Servers
Emerging opportunities lie in expanding into new markets, such as edge computing and high-performance computing clusters. Advancements in dielectric fluid technology, offering improved sustainability and safety, are creating further opportunities. Increasing demand for environmentally friendly data center solutions presents a significant growth avenue for immersion cooling.
Leading Players in the Immersion Cooling Servers Market
- Dell
- HPE
- Cisco
- Supermicro
- Fujitsu
- 2CRSI
- Inspur
- Sugon
- H3C
- Lenovo
- GIGABYTE
- Nettrix
- PowerLeader
- Fii
Key Developments in Immersion Cooling Servers Industry
- January 2023: Dell launched its new immersion cooling solution for high-performance computing.
- March 2022: HPE announced a strategic partnership with a dielectric fluid manufacturer to enhance its immersion cooling offerings.
- June 2021: 2CRSI secured significant funding to expand its manufacturing capacity for immersion cooling systems. (Further developments to be added based on available data)
Future Outlook for Immersion Cooling Servers Market
The Immersion Cooling Servers market is poised for significant growth in the coming years, driven by increasing demand for high-performance computing, stricter environmental regulations, and continuous technological advancements. Strategic partnerships and collaborations between technology providers and data center operators will further accelerate market adoption. The focus on sustainability and energy efficiency will continue to drive innovation and create lucrative opportunities for market participants.
Immersion Cooling Servers Segmentation
-
1. Application
- 1.1. Internet
- 1.2. Telecommunications
- 1.3. Financial
- 1.4. Government
- 1.5. Other
-
2. Types
- 2.1. Single-Phase Immersion Cooling
- 2.2. Two-Phase Immersion Cooling
Immersion Cooling Servers Segmentation By Geography
-
1. North America
- 1.1. United States
- 1.2. Canada
- 1.3. Mexico
-
2. South America
- 2.1. Brazil
- 2.2. Argentina
- 2.3. Rest of South America
-
3. Europe
- 3.1. United Kingdom
- 3.2. Germany
- 3.3. France
- 3.4. Italy
- 3.5. Spain
- 3.6. Russia
- 3.7. Benelux
- 3.8. Nordics
- 3.9. Rest of Europe
-
4. Middle East & Africa
- 4.1. Turkey
- 4.2. Israel
- 4.3. GCC
- 4.4. North Africa
- 4.5. South Africa
- 4.6. Rest of Middle East & Africa
-
5. Asia Pacific
- 5.1. China
- 5.2. India
- 5.3. Japan
- 5.4. South Korea
- 5.5. ASEAN
- 5.6. Oceania
- 5.7. Rest of Asia Pacific
Immersion Cooling Servers REPORT HIGHLIGHTS
| Aspects | Details |
|---|---|
| Study Period | 2019-2033 |
| Base Year | 2024 |
| Estimated Year | 2025 |
| Forecast Period | 2025-2033 |
| Historical Period | 2019-2024 |
| Growth Rate | CAGR of XX% from 2019-2033 |
| Segmentation |
|
Table of Contents
- 1. Introduction
- 1.1. Research Scope
- 1.2. Market Segmentation
- 1.3. Research Methodology
- 1.4. Definitions and Assumptions
- 2. Executive Summary
- 2.1. Introduction
- 3. Market Dynamics
- 3.1. Introduction
- 3.2. Market Drivers
- 3.3. Market Restrains
- 3.4. Market Trends
- 4. Market Factor Analysis
- 4.1. Porters Five Forces
- 4.2. Supply/Value Chain
- 4.3. PESTEL analysis
- 4.4. Market Entropy
- 4.5. Patent/Trademark Analysis
- 5. Global Immersion Cooling Servers Analysis, Insights and Forecast, 2019-2031
- 5.1. Market Analysis, Insights and Forecast - by Application
- 5.1.1. Internet
- 5.1.2. Telecommunications
- 5.1.3. Financial
- 5.1.4. Government
- 5.1.5. Other
- 5.2. Market Analysis, Insights and Forecast - by Types
- 5.2.1. Single-Phase Immersion Cooling
- 5.2.2. Two-Phase Immersion Cooling
- 5.3. Market Analysis, Insights and Forecast - by Region
- 5.3.1. North America
- 5.3.2. South America
- 5.3.3. Europe
- 5.3.4. Middle East & Africa
- 5.3.5. Asia Pacific
- 5.1. Market Analysis, Insights and Forecast - by Application
- 6. North America Immersion Cooling Servers Analysis, Insights and Forecast, 2019-2031
- 6.1. Market Analysis, Insights and Forecast - by Application
- 6.1.1. Internet
- 6.1.2. Telecommunications
- 6.1.3. Financial
- 6.1.4. Government
- 6.1.5. Other
- 6.2. Market Analysis, Insights and Forecast - by Types
- 6.2.1. Single-Phase Immersion Cooling
- 6.2.2. Two-Phase Immersion Cooling
- 6.1. Market Analysis, Insights and Forecast - by Application
- 7. South America Immersion Cooling Servers Analysis, Insights and Forecast, 2019-2031
- 7.1. Market Analysis, Insights and Forecast - by Application
- 7.1.1. Internet
- 7.1.2. Telecommunications
- 7.1.3. Financial
- 7.1.4. Government
- 7.1.5. Other
- 7.2. Market Analysis, Insights and Forecast - by Types
- 7.2.1. Single-Phase Immersion Cooling
- 7.2.2. Two-Phase Immersion Cooling
- 7.1. Market Analysis, Insights and Forecast - by Application
- 8. Europe Immersion Cooling Servers Analysis, Insights and Forecast, 2019-2031
- 8.1. Market Analysis, Insights and Forecast - by Application
- 8.1.1. Internet
- 8.1.2. Telecommunications
- 8.1.3. Financial
- 8.1.4. Government
- 8.1.5. Other
- 8.2. Market Analysis, Insights and Forecast - by Types
- 8.2.1. Single-Phase Immersion Cooling
- 8.2.2. Two-Phase Immersion Cooling
- 8.1. Market Analysis, Insights and Forecast - by Application
- 9. Middle East & Africa Immersion Cooling Servers Analysis, Insights and Forecast, 2019-2031
- 9.1. Market Analysis, Insights and Forecast - by Application
- 9.1.1. Internet
- 9.1.2. Telecommunications
- 9.1.3. Financial
- 9.1.4. Government
- 9.1.5. Other
- 9.2. Market Analysis, Insights and Forecast - by Types
- 9.2.1. Single-Phase Immersion Cooling
- 9.2.2. Two-Phase Immersion Cooling
- 9.1. Market Analysis, Insights and Forecast - by Application
- 10. Asia Pacific Immersion Cooling Servers Analysis, Insights and Forecast, 2019-2031
- 10.1. Market Analysis, Insights and Forecast - by Application
- 10.1.1. Internet
- 10.1.2. Telecommunications
- 10.1.3. Financial
- 10.1.4. Government
- 10.1.5. Other
- 10.2. Market Analysis, Insights and Forecast - by Types
- 10.2.1. Single-Phase Immersion Cooling
- 10.2.2. Two-Phase Immersion Cooling
- 10.1. Market Analysis, Insights and Forecast - by Application
- 11. Competitive Analysis
- 11.1. Global Market Share Analysis 2024
- 11.2. Company Profiles
- 11.2.1 Dell
- 11.2.1.1. Overview
- 11.2.1.2. Products
- 11.2.1.3. SWOT Analysis
- 11.2.1.4. Recent Developments
- 11.2.1.5. Financials (Based on Availability)
- 11.2.2 HPE
- 11.2.2.1. Overview
- 11.2.2.2. Products
- 11.2.2.3. SWOT Analysis
- 11.2.2.4. Recent Developments
- 11.2.2.5. Financials (Based on Availability)
- 11.2.3 Cisco
- 11.2.3.1. Overview
- 11.2.3.2. Products
- 11.2.3.3. SWOT Analysis
- 11.2.3.4. Recent Developments
- 11.2.3.5. Financials (Based on Availability)
- 11.2.4 Supermicro
- 11.2.4.1. Overview
- 11.2.4.2. Products
- 11.2.4.3. SWOT Analysis
- 11.2.4.4. Recent Developments
- 11.2.4.5. Financials (Based on Availability)
- 11.2.5 Fujitsu
- 11.2.5.1. Overview
- 11.2.5.2. Products
- 11.2.5.3. SWOT Analysis
- 11.2.5.4. Recent Developments
- 11.2.5.5. Financials (Based on Availability)
- 11.2.6 2CRSI
- 11.2.6.1. Overview
- 11.2.6.2. Products
- 11.2.6.3. SWOT Analysis
- 11.2.6.4. Recent Developments
- 11.2.6.5. Financials (Based on Availability)
- 11.2.7 Inspur
- 11.2.7.1. Overview
- 11.2.7.2. Products
- 11.2.7.3. SWOT Analysis
- 11.2.7.4. Recent Developments
- 11.2.7.5. Financials (Based on Availability)
- 11.2.8 Sugon
- 11.2.8.1. Overview
- 11.2.8.2. Products
- 11.2.8.3. SWOT Analysis
- 11.2.8.4. Recent Developments
- 11.2.8.5. Financials (Based on Availability)
- 11.2.9 H3C
- 11.2.9.1. Overview
- 11.2.9.2. Products
- 11.2.9.3. SWOT Analysis
- 11.2.9.4. Recent Developments
- 11.2.9.5. Financials (Based on Availability)
- 11.2.10 Lenovo
- 11.2.10.1. Overview
- 11.2.10.2. Products
- 11.2.10.3. SWOT Analysis
- 11.2.10.4. Recent Developments
- 11.2.10.5. Financials (Based on Availability)
- 11.2.11 GIGABYTE
- 11.2.11.1. Overview
- 11.2.11.2. Products
- 11.2.11.3. SWOT Analysis
- 11.2.11.4. Recent Developments
- 11.2.11.5. Financials (Based on Availability)
- 11.2.12 Nettrix
- 11.2.12.1. Overview
- 11.2.12.2. Products
- 11.2.12.3. SWOT Analysis
- 11.2.12.4. Recent Developments
- 11.2.12.5. Financials (Based on Availability)
- 11.2.13 PowerLeader
- 11.2.13.1. Overview
- 11.2.13.2. Products
- 11.2.13.3. SWOT Analysis
- 11.2.13.4. Recent Developments
- 11.2.13.5. Financials (Based on Availability)
- 11.2.14 Fii
- 11.2.14.1. Overview
- 11.2.14.2. Products
- 11.2.14.3. SWOT Analysis
- 11.2.14.4. Recent Developments
- 11.2.14.5. Financials (Based on Availability)
- 11.2.1 Dell
List of Figures
- Figure 1: Global Immersion Cooling Servers Revenue Breakdown (million, %) by Region 2024 & 2032
- Figure 2: Global Immersion Cooling Servers Volume Breakdown (K, %) by Region 2024 & 2032
- Figure 3: North America Immersion Cooling Servers Revenue (million), by Application 2024 & 2032
- Figure 4: North America Immersion Cooling Servers Volume (K), by Application 2024 & 2032
- Figure 5: North America Immersion Cooling Servers Revenue Share (%), by Application 2024 & 2032
- Figure 6: North America Immersion Cooling Servers Volume Share (%), by Application 2024 & 2032
- Figure 7: North America Immersion Cooling Servers Revenue (million), by Types 2024 & 2032
- Figure 8: North America Immersion Cooling Servers Volume (K), by Types 2024 & 2032
- Figure 9: North America Immersion Cooling Servers Revenue Share (%), by Types 2024 & 2032
- Figure 10: North America Immersion Cooling Servers Volume Share (%), by Types 2024 & 2032
- Figure 11: North America Immersion Cooling Servers Revenue (million), by Country 2024 & 2032
- Figure 12: North America Immersion Cooling Servers Volume (K), by Country 2024 & 2032
- Figure 13: North America Immersion Cooling Servers Revenue Share (%), by Country 2024 & 2032
- Figure 14: North America Immersion Cooling Servers Volume Share (%), by Country 2024 & 2032
- Figure 15: South America Immersion Cooling Servers Revenue (million), by Application 2024 & 2032
- Figure 16: South America Immersion Cooling Servers Volume (K), by Application 2024 & 2032
- Figure 17: South America Immersion Cooling Servers Revenue Share (%), by Application 2024 & 2032
- Figure 18: South America Immersion Cooling Servers Volume Share (%), by Application 2024 & 2032
- Figure 19: South America Immersion Cooling Servers Revenue (million), by Types 2024 & 2032
- Figure 20: South America Immersion Cooling Servers Volume (K), by Types 2024 & 2032
- Figure 21: South America Immersion Cooling Servers Revenue Share (%), by Types 2024 & 2032
- Figure 22: South America Immersion Cooling Servers Volume Share (%), by Types 2024 & 2032
- Figure 23: South America Immersion Cooling Servers Revenue (million), by Country 2024 & 2032
- Figure 24: South America Immersion Cooling Servers Volume (K), by Country 2024 & 2032
- Figure 25: South America Immersion Cooling Servers Revenue Share (%), by Country 2024 & 2032
- Figure 26: South America Immersion Cooling Servers Volume Share (%), by Country 2024 & 2032
- Figure 27: Europe Immersion Cooling Servers Revenue (million), by Application 2024 & 2032
- Figure 28: Europe Immersion Cooling Servers Volume (K), by Application 2024 & 2032
- Figure 29: Europe Immersion Cooling Servers Revenue Share (%), by Application 2024 & 2032
- Figure 30: Europe Immersion Cooling Servers Volume Share (%), by Application 2024 & 2032
- Figure 31: Europe Immersion Cooling Servers Revenue (million), by Types 2024 & 2032
- Figure 32: Europe Immersion Cooling Servers Volume (K), by Types 2024 & 2032
- Figure 33: Europe Immersion Cooling Servers Revenue Share (%), by Types 2024 & 2032
- Figure 34: Europe Immersion Cooling Servers Volume Share (%), by Types 2024 & 2032
- Figure 35: Europe Immersion Cooling Servers Revenue (million), by Country 2024 & 2032
- Figure 36: Europe Immersion Cooling Servers Volume (K), by Country 2024 & 2032
- Figure 37: Europe Immersion Cooling Servers Revenue Share (%), by Country 2024 & 2032
- Figure 38: Europe Immersion Cooling Servers Volume Share (%), by Country 2024 & 2032
- Figure 39: Middle East & Africa Immersion Cooling Servers Revenue (million), by Application 2024 & 2032
- Figure 40: Middle East & Africa Immersion Cooling Servers Volume (K), by Application 2024 & 2032
- Figure 41: Middle East & Africa Immersion Cooling Servers Revenue Share (%), by Application 2024 & 2032
- Figure 42: Middle East & Africa Immersion Cooling Servers Volume Share (%), by Application 2024 & 2032
- Figure 43: Middle East & Africa Immersion Cooling Servers Revenue (million), by Types 2024 & 2032
- Figure 44: Middle East & Africa Immersion Cooling Servers Volume (K), by Types 2024 & 2032
- Figure 45: Middle East & Africa Immersion Cooling Servers Revenue Share (%), by Types 2024 & 2032
- Figure 46: Middle East & Africa Immersion Cooling Servers Volume Share (%), by Types 2024 & 2032
- Figure 47: Middle East & Africa Immersion Cooling Servers Revenue (million), by Country 2024 & 2032
- Figure 48: Middle East & Africa Immersion Cooling Servers Volume (K), by Country 2024 & 2032
- Figure 49: Middle East & Africa Immersion Cooling Servers Revenue Share (%), by Country 2024 & 2032
- Figure 50: Middle East & Africa Immersion Cooling Servers Volume Share (%), by Country 2024 & 2032
- Figure 51: Asia Pacific Immersion Cooling Servers Revenue (million), by Application 2024 & 2032
- Figure 52: Asia Pacific Immersion Cooling Servers Volume (K), by Application 2024 & 2032
- Figure 53: Asia Pacific Immersion Cooling Servers Revenue Share (%), by Application 2024 & 2032
- Figure 54: Asia Pacific Immersion Cooling Servers Volume Share (%), by Application 2024 & 2032
- Figure 55: Asia Pacific Immersion Cooling Servers Revenue (million), by Types 2024 & 2032
- Figure 56: Asia Pacific Immersion Cooling Servers Volume (K), by Types 2024 & 2032
- Figure 57: Asia Pacific Immersion Cooling Servers Revenue Share (%), by Types 2024 & 2032
- Figure 58: Asia Pacific Immersion Cooling Servers Volume Share (%), by Types 2024 & 2032
- Figure 59: Asia Pacific Immersion Cooling Servers Revenue (million), by Country 2024 & 2032
- Figure 60: Asia Pacific Immersion Cooling Servers Volume (K), by Country 2024 & 2032
- Figure 61: Asia Pacific Immersion Cooling Servers Revenue Share (%), by Country 2024 & 2032
- Figure 62: Asia Pacific Immersion Cooling Servers Volume Share (%), by Country 2024 & 2032
List of Tables
- Table 1: Global Immersion Cooling Servers Revenue million Forecast, by Region 2019 & 2032
- Table 2: Global Immersion Cooling Servers Volume K Forecast, by Region 2019 & 2032
- Table 3: Global Immersion Cooling Servers Revenue million Forecast, by Application 2019 & 2032
- Table 4: Global Immersion Cooling Servers Volume K Forecast, by Application 2019 & 2032
- Table 5: Global Immersion Cooling Servers Revenue million Forecast, by Types 2019 & 2032
- Table 6: Global Immersion Cooling Servers Volume K Forecast, by Types 2019 & 2032
- Table 7: Global Immersion Cooling Servers Revenue million Forecast, by Region 2019 & 2032
- Table 8: Global Immersion Cooling Servers Volume K Forecast, by Region 2019 & 2032
- Table 9: Global Immersion Cooling Servers Revenue million Forecast, by Application 2019 & 2032
- Table 10: Global Immersion Cooling Servers Volume K Forecast, by Application 2019 & 2032
- Table 11: Global Immersion Cooling Servers Revenue million Forecast, by Types 2019 & 2032
- Table 12: Global Immersion Cooling Servers Volume K Forecast, by Types 2019 & 2032
- Table 13: Global Immersion Cooling Servers Revenue million Forecast, by Country 2019 & 2032
- Table 14: Global Immersion Cooling Servers Volume K Forecast, by Country 2019 & 2032
- Table 15: United States Immersion Cooling Servers Revenue (million) Forecast, by Application 2019 & 2032
- Table 16: United States Immersion Cooling Servers Volume (K) Forecast, by Application 2019 & 2032
- Table 17: Canada Immersion Cooling Servers Revenue (million) Forecast, by Application 2019 & 2032
- Table 18: Canada Immersion Cooling Servers Volume (K) Forecast, by Application 2019 & 2032
- Table 19: Mexico Immersion Cooling Servers Revenue (million) Forecast, by Application 2019 & 2032
- Table 20: Mexico Immersion Cooling Servers Volume (K) Forecast, by Application 2019 & 2032
- Table 21: Global Immersion Cooling Servers Revenue million Forecast, by Application 2019 & 2032
- Table 22: Global Immersion Cooling Servers Volume K Forecast, by Application 2019 & 2032
- Table 23: Global Immersion Cooling Servers Revenue million Forecast, by Types 2019 & 2032
- Table 24: Global Immersion Cooling Servers Volume K Forecast, by Types 2019 & 2032
- Table 25: Global Immersion Cooling Servers Revenue million Forecast, by Country 2019 & 2032
- Table 26: Global Immersion Cooling Servers Volume K Forecast, by Country 2019 & 2032
- Table 27: Brazil Immersion Cooling Servers Revenue (million) Forecast, by Application 2019 & 2032
- Table 28: Brazil Immersion Cooling Servers Volume (K) Forecast, by Application 2019 & 2032
- Table 29: Argentina Immersion Cooling Servers Revenue (million) Forecast, by Application 2019 & 2032
- Table 30: Argentina Immersion Cooling Servers Volume (K) Forecast, by Application 2019 & 2032
- Table 31: Rest of South America Immersion Cooling Servers Revenue (million) Forecast, by Application 2019 & 2032
- Table 32: Rest of South America Immersion Cooling Servers Volume (K) Forecast, by Application 2019 & 2032
- Table 33: Global Immersion Cooling Servers Revenue million Forecast, by Application 2019 & 2032
- Table 34: Global Immersion Cooling Servers Volume K Forecast, by Application 2019 & 2032
- Table 35: Global Immersion Cooling Servers Revenue million Forecast, by Types 2019 & 2032
- Table 36: Global Immersion Cooling Servers Volume K Forecast, by Types 2019 & 2032
- Table 37: Global Immersion Cooling Servers Revenue million Forecast, by Country 2019 & 2032
- Table 38: Global Immersion Cooling Servers Volume K Forecast, by Country 2019 & 2032
- Table 39: United Kingdom Immersion Cooling Servers Revenue (million) Forecast, by Application 2019 & 2032
- Table 40: United Kingdom Immersion Cooling Servers Volume (K) Forecast, by Application 2019 & 2032
- Table 41: Germany Immersion Cooling Servers Revenue (million) Forecast, by Application 2019 & 2032
- Table 42: Germany Immersion Cooling Servers Volume (K) Forecast, by Application 2019 & 2032
- Table 43: France Immersion Cooling Servers Revenue (million) Forecast, by Application 2019 & 2032
- Table 44: France Immersion Cooling Servers Volume (K) Forecast, by Application 2019 & 2032
- Table 45: Italy Immersion Cooling Servers Revenue (million) Forecast, by Application 2019 & 2032
- Table 46: Italy Immersion Cooling Servers Volume (K) Forecast, by Application 2019 & 2032
- Table 47: Spain Immersion Cooling Servers Revenue (million) Forecast, by Application 2019 & 2032
- Table 48: Spain Immersion Cooling Servers Volume (K) Forecast, by Application 2019 & 2032
- Table 49: Russia Immersion Cooling Servers Revenue (million) Forecast, by Application 2019 & 2032
- Table 50: Russia Immersion Cooling Servers Volume (K) Forecast, by Application 2019 & 2032
- Table 51: Benelux Immersion Cooling Servers Revenue (million) Forecast, by Application 2019 & 2032
- Table 52: Benelux Immersion Cooling Servers Volume (K) Forecast, by Application 2019 & 2032
- Table 53: Nordics Immersion Cooling Servers Revenue (million) Forecast, by Application 2019 & 2032
- Table 54: Nordics Immersion Cooling Servers Volume (K) Forecast, by Application 2019 & 2032
- Table 55: Rest of Europe Immersion Cooling Servers Revenue (million) Forecast, by Application 2019 & 2032
- Table 56: Rest of Europe Immersion Cooling Servers Volume (K) Forecast, by Application 2019 & 2032
- Table 57: Global Immersion Cooling Servers Revenue million Forecast, by Application 2019 & 2032
- Table 58: Global Immersion Cooling Servers Volume K Forecast, by Application 2019 & 2032
- Table 59: Global Immersion Cooling Servers Revenue million Forecast, by Types 2019 & 2032
- Table 60: Global Immersion Cooling Servers Volume K Forecast, by Types 2019 & 2032
- Table 61: Global Immersion Cooling Servers Revenue million Forecast, by Country 2019 & 2032
- Table 62: Global Immersion Cooling Servers Volume K Forecast, by Country 2019 & 2032
- Table 63: Turkey Immersion Cooling Servers Revenue (million) Forecast, by Application 2019 & 2032
- Table 64: Turkey Immersion Cooling Servers Volume (K) Forecast, by Application 2019 & 2032
- Table 65: Israel Immersion Cooling Servers Revenue (million) Forecast, by Application 2019 & 2032
- Table 66: Israel Immersion Cooling Servers Volume (K) Forecast, by Application 2019 & 2032
- Table 67: GCC Immersion Cooling Servers Revenue (million) Forecast, by Application 2019 & 2032
- Table 68: GCC Immersion Cooling Servers Volume (K) Forecast, by Application 2019 & 2032
- Table 69: North Africa Immersion Cooling Servers Revenue (million) Forecast, by Application 2019 & 2032
- Table 70: North Africa Immersion Cooling Servers Volume (K) Forecast, by Application 2019 & 2032
- Table 71: South Africa Immersion Cooling Servers Revenue (million) Forecast, by Application 2019 & 2032
- Table 72: South Africa Immersion Cooling Servers Volume (K) Forecast, by Application 2019 & 2032
- Table 73: Rest of Middle East & Africa Immersion Cooling Servers Revenue (million) Forecast, by Application 2019 & 2032
- Table 74: Rest of Middle East & Africa Immersion Cooling Servers Volume (K) Forecast, by Application 2019 & 2032
- Table 75: Global Immersion Cooling Servers Revenue million Forecast, by Application 2019 & 2032
- Table 76: Global Immersion Cooling Servers Volume K Forecast, by Application 2019 & 2032
- Table 77: Global Immersion Cooling Servers Revenue million Forecast, by Types 2019 & 2032
- Table 78: Global Immersion Cooling Servers Volume K Forecast, by Types 2019 & 2032
- Table 79: Global Immersion Cooling Servers Revenue million Forecast, by Country 2019 & 2032
- Table 80: Global Immersion Cooling Servers Volume K Forecast, by Country 2019 & 2032
- Table 81: China Immersion Cooling Servers Revenue (million) Forecast, by Application 2019 & 2032
- Table 82: China Immersion Cooling Servers Volume (K) Forecast, by Application 2019 & 2032
- Table 83: India Immersion Cooling Servers Revenue (million) Forecast, by Application 2019 & 2032
- Table 84: India Immersion Cooling Servers Volume (K) Forecast, by Application 2019 & 2032
- Table 85: Japan Immersion Cooling Servers Revenue (million) Forecast, by Application 2019 & 2032
- Table 86: Japan Immersion Cooling Servers Volume (K) Forecast, by Application 2019 & 2032
- Table 87: South Korea Immersion Cooling Servers Revenue (million) Forecast, by Application 2019 & 2032
- Table 88: South Korea Immersion Cooling Servers Volume (K) Forecast, by Application 2019 & 2032
- Table 89: ASEAN Immersion Cooling Servers Revenue (million) Forecast, by Application 2019 & 2032
- Table 90: ASEAN Immersion Cooling Servers Volume (K) Forecast, by Application 2019 & 2032
- Table 91: Oceania Immersion Cooling Servers Revenue (million) Forecast, by Application 2019 & 2032
- Table 92: Oceania Immersion Cooling Servers Volume (K) Forecast, by Application 2019 & 2032
- Table 93: Rest of Asia Pacific Immersion Cooling Servers Revenue (million) Forecast, by Application 2019 & 2032
- Table 94: Rest of Asia Pacific Immersion Cooling Servers Volume (K) Forecast, by Application 2019 & 2032
Frequently Asked Questions
1. What is the projected Compound Annual Growth Rate (CAGR) of the Immersion Cooling Servers?
The projected CAGR is approximately XX%.
2. Which companies are prominent players in the Immersion Cooling Servers?
Key companies in the market include Dell, HPE, Cisco, Supermicro, Fujitsu, 2CRSI, Inspur, Sugon, H3C, Lenovo, GIGABYTE, Nettrix, PowerLeader, Fii.
3. What are the main segments of the Immersion Cooling Servers?
The market segments include Application, Types.
4. Can you provide details about the market size?
The market size is estimated to be USD XXX million as of 2022.
5. What are some drivers contributing to market growth?
N/A
6. What are the notable trends driving market growth?
N/A
7. Are there any restraints impacting market growth?
N/A
8. Can you provide examples of recent developments in the market?
N/A
9. What pricing options are available for accessing the report?
Pricing options include single-user, multi-user, and enterprise licenses priced at USD 3350.00, USD 5025.00, and USD 6700.00 respectively.
10. Is the market size provided in terms of value or volume?
The market size is provided in terms of value, measured in million and volume, measured in K.
11. Are there any specific market keywords associated with the report?
Yes, the market keyword associated with the report is "Immersion Cooling Servers," which aids in identifying and referencing the specific market segment covered.
12. How do I determine which pricing option suits my needs best?
The pricing options vary based on user requirements and access needs. Individual users may opt for single-user licenses, while businesses requiring broader access may choose multi-user or enterprise licenses for cost-effective access to the report.
13. Are there any additional resources or data provided in the Immersion Cooling Servers report?
While the report offers comprehensive insights, it's advisable to review the specific contents or supplementary materials provided to ascertain if additional resources or data are available.
14. How can I stay updated on further developments or reports in the Immersion Cooling Servers?
To stay informed about further developments, trends, and reports in the Immersion Cooling Servers, consider subscribing to industry newsletters, following relevant companies and organizations, or regularly checking reputable industry news sources and publications.
Methodology
Step 1 - Identification of Relevant Samples Size from Population Database


Step 2 - Approaches for Defining Global Market Size (Value, Volume* & Price*)

Note*: In applicable scenarios
Step 3 - Data Sources
Primary Research
- Web Analytics
- Survey Reports
- Research Institute
- Latest Research Reports
- Opinion Leaders
Secondary Research
- Annual Reports
- White Paper
- Latest Press Release
- Industry Association
- Paid Database
- Investor Presentations

Step 4 - Data Triangulation
Involves using different sources of information in order to increase the validity of a study
These sources are likely to be stakeholders in a program - participants, other researchers, program staff, other community members, and so on.
Then we put all data in single framework & apply various statistical tools to find out the dynamic on the market.
During the analysis stage, feedback from the stakeholder groups would be compared to determine areas of agreement as well as areas of divergence


