
Key Insights
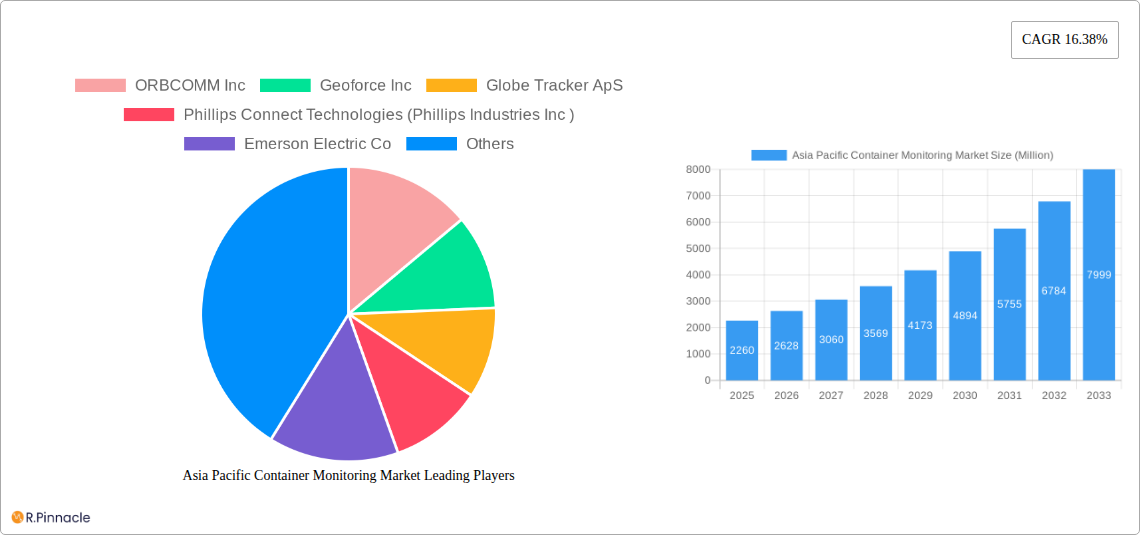
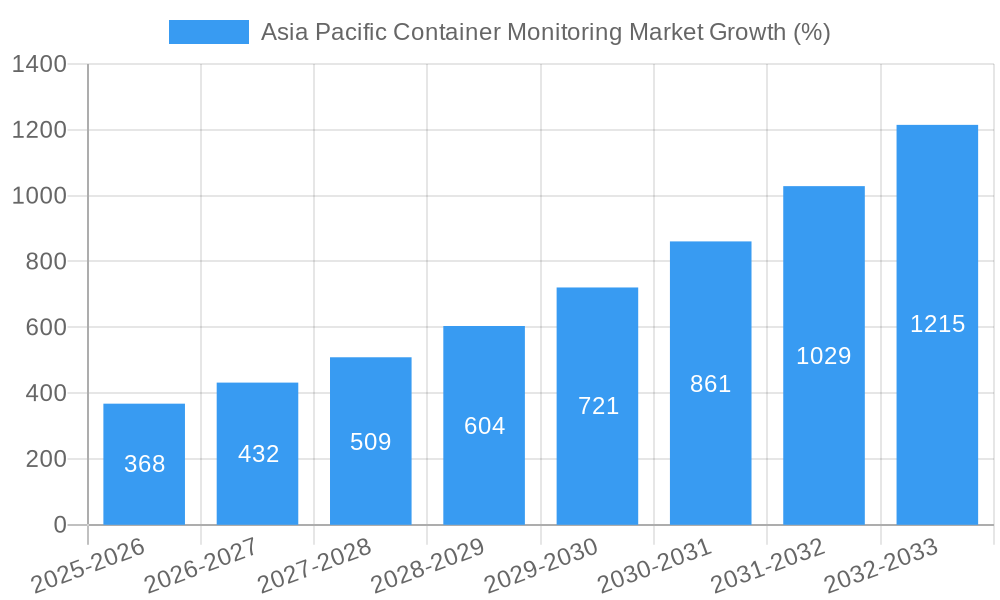
The Asia Pacific container monitoring market is experiencing robust growth, driven by the increasing need for enhanced supply chain visibility and efficiency in the region's dynamic logistics sector. With a market size of $2.26 billion in 2025 and a Compound Annual Growth Rate (CAGR) of 16.38% projected from 2025 to 2033, the market is poised for significant expansion. Key drivers include the rising adoption of real-time tracking technologies, growing e-commerce activities demanding faster delivery times, increasing pressure to reduce cargo theft and damage, and stringent regulatory compliance requirements. The integration of IoT devices, AI-powered analytics, and advanced data visualization tools are transforming container monitoring, offering businesses greater insights into their shipments and enabling proactive decision-making. Furthermore, the increasing focus on sustainability within the shipping industry is encouraging the adoption of fuel-efficient solutions, which often incorporates advanced monitoring technologies.
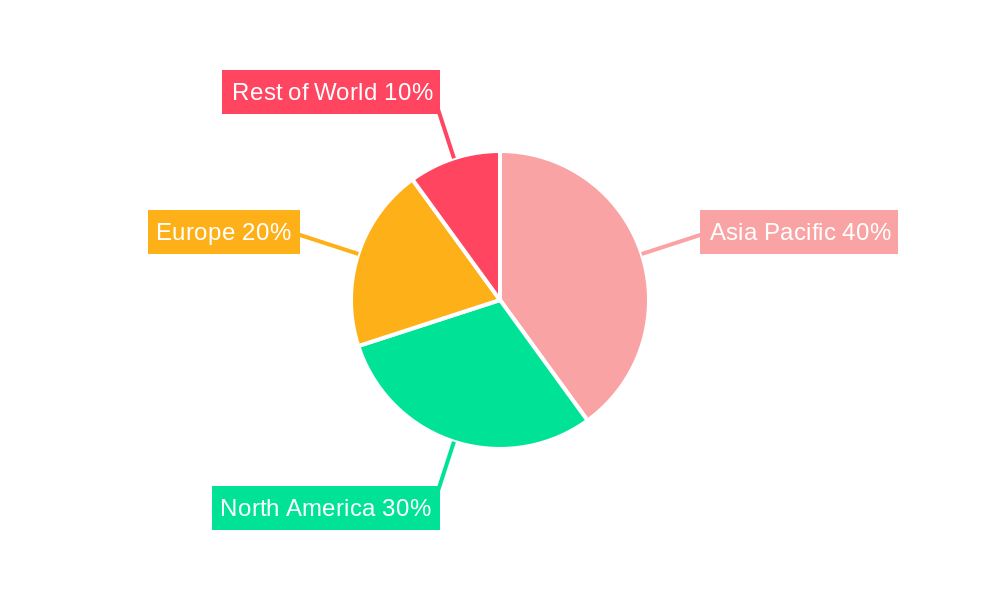
This growth is further propelled by the diversification of segments within the market, encompassing various hardware and software solutions, as well as service offerings. Companies like ORBCOMM, Geoforce, and others are actively contributing to market expansion through innovation and competitive offerings. While specific regional data for Asia Pacific is unavailable, considering the region's significant contribution to global trade and its rapid economic development, it is reasonable to infer a substantial share of the global container monitoring market for Asia Pacific. The restraints could include the high initial investment costs of implementing container monitoring systems, potential cybersecurity risks associated with connected devices, and varying levels of technological adoption across the region. However, the long-term benefits in terms of cost savings, improved efficiency, and reduced risks are expected to outweigh these challenges, fueling continued market expansion.
Asia Pacific Container Monitoring Market Report: 2019-2033
This comprehensive report provides an in-depth analysis of the Asia Pacific Container Monitoring Market, offering invaluable insights for industry professionals, investors, and strategic decision-makers. The study period spans from 2019 to 2033, with a base year of 2025 and a forecast period from 2025 to 2033. This report leverages extensive data analysis to illuminate market trends, growth drivers, challenges, and opportunities within this dynamic sector.
Asia Pacific Container Monitoring Market Structure & Innovation Trends
The Asia Pacific Container Monitoring Market exhibits a moderately consolidated structure, with several key players vying for market share. Market concentration is influenced by factors such as technological advancements, regulatory landscapes, and the increasing adoption of container monitoring solutions across various industries. Innovation is driven by the need for improved supply chain visibility, enhanced security, and real-time data analytics. Regulatory frameworks, including those related to data privacy and security, play a significant role in shaping market dynamics. Product substitutes, such as traditional manual tracking methods, are being gradually replaced by technologically advanced solutions. End-user demographics encompass a diverse range of industries, including logistics, shipping, manufacturing, and retail. M&A activities have played a notable role in market consolidation, with significant deals impacting market share distribution. While precise M&A deal values are not publicly available for all transactions in this rapidly evolving market, analysis suggests deals in the range of xx Million have occurred, driving consolidation and technological integration.
- Market Share: The top five players hold an estimated xx% market share collectively.
- M&A Activity: The past five years have witnessed at least xx significant M&A transactions, shaping the competitive landscape.
- Innovation Drivers: Internet of Things (IoT) advancements, AI-powered analytics, and 5G connectivity are key drivers of innovation.
- Regulatory Frameworks: Data privacy regulations like GDPR and local equivalents influence data handling practices within the market.
Asia Pacific Container Monitoring Market Dynamics & Trends
The Asia Pacific Container Monitoring Market is experiencing robust growth, driven by several key factors. The increasing demand for enhanced supply chain visibility and efficiency fuels the adoption of container monitoring technologies. Technological disruptions, such as the widespread adoption of IoT devices and the development of advanced analytics platforms, are transforming the market landscape. Consumer preferences towards faster and more reliable delivery services are also contributing to market growth. Competitive dynamics are characterized by intense competition among established players and the emergence of new entrants, prompting innovation and price competition. The Compound Annual Growth Rate (CAGR) for the market is projected to be xx% during the forecast period. Market penetration is expected to reach xx% by 2033, driven by increasing adoption across various industries.
Dominant Regions & Segments in Asia Pacific Container Monitoring Market
China and India are currently the dominant markets within the Asia Pacific region, followed by other countries such as Japan, South Korea and Singapore, accounting for the majority of market revenue and demonstrating the strongest growth trajectories. The growth trajectory of these countries is influenced by numerous factors:
- China: Robust economic growth, extensive port infrastructure, and government initiatives supporting logistics modernization.
- India: Rapid industrialization, a growing e-commerce sector, and increasing focus on supply chain optimization.
- Japan: Well-established logistics infrastructure and the presence of major shipping companies.
- Other Countries: Each country within the Asia Pacific region presents specific growth opportunities shaped by diverse macroeconomic factors, levels of infrastructure development and individual trade profiles.
This regional dominance is further segmented by industry verticals, with the logistics and transportation sectors showing the highest adoption rates and driving the most significant segment revenue growth.
Asia Pacific Container Monitoring Market Product Innovations
Recent innovations focus on enhanced data analytics capabilities, integration with existing supply chain management systems, and the development of more robust and cost-effective devices. Miniaturization of sensors, integration with AI-powered platforms, and the use of blockchain technology for enhanced security are key technological trends. These advancements cater to the increasing demand for real-time visibility, predictive maintenance, and improved security within the container monitoring market, creating a significant competitive advantage for businesses capable of quickly adapting to these innovations.
Report Scope & Segmentation Analysis
This report segments the Asia Pacific Container Monitoring Market based on several key factors:
By Technology: This includes GPS tracking, RFID, sensors, and other emerging technologies. Each technology segment exhibits unique growth trajectories, driven by factors such as cost, accuracy, and application suitability.
By Application: This covers various industries like logistics, shipping, manufacturing, and retail. Each application segment has unique needs and preferences shaping the demand for different features and functionalities in container monitoring solutions.
By End-User: This segment analyzes the diverse needs and adoption patterns of different types of users, including large multinational corporations, small and medium-sized enterprises (SMEs), and individual users. The competitive dynamics within each segment vary significantly according to user needs and preferences.
Growth projections for each segment are detailed in the complete report, offering a detailed outlook for each sub-sector.
Key Drivers of Asia Pacific Container Monitoring Market Growth
Several factors contribute to the growth of this market. Firstly, the increasing need for enhanced supply chain visibility and efficiency among businesses in the region is a major driving force. Secondly, technological advancements such as the Internet of Things (IoT), artificial intelligence (AI), and big data analytics are enabling the development of more sophisticated container monitoring solutions. Lastly, government regulations and initiatives promoting supply chain security and optimization are providing additional support.
Challenges in the Asia Pacific Container Monitoring Market Sector
Despite the significant growth potential, the market faces challenges such as high implementation costs, the need for robust data infrastructure, and concerns related to data security and privacy. These issues can influence the rate of market penetration and adoption across industries. Competitive pressures from both established players and new market entrants also present significant challenges for companies seeking to secure a significant market share.
Emerging Opportunities in Asia Pacific Container Monitoring Market
Emerging opportunities lie in the integration of container monitoring solutions with other supply chain technologies such as blockchain and AI, enabling advanced analytics and predictive maintenance. The expansion into new markets with growing demand for improved supply chain management, such as e-commerce and cross-border trade, represents a significant opportunity. Furthermore, the development of innovative value-added services around container monitoring data can unlock further revenue streams.
Leading Players in the Asia Pacific Container Monitoring Market Market
- ORBCOMM Inc
- Geoforce Inc
- Globe Tracker ApS
- Phillips Connect Technologies (Phillips Industries Inc)
- Emerson Electric Co
- Hapag-Lloyd AG
- TRAXENS
- Roambee Corporation
- OnAsset Intelligence Inc
- Zabbix LLC
- List Not Exhaustive
Key Developments in Asia Pacific Container Monitoring Market Industry
- September 2024: ZIM Integrated Shipping Services Ltd. announced a long-term operational cooperation with Mediterranean Shipping Company (MSC) on Asia-US East Coast and Asia-US Gulf trades, launching new services in February 2025. This enhances ZIM's competitive position, particularly on the Asia-US East Coast trade.
- September 2024: Kalmar signed an agreement with ContainerCo in New Zealand to supply six empty container handlers, reflecting the growth of container depot operations and demand for efficient container handling equipment.
Future Outlook for Asia Pacific Container Monitoring Market Market
The Asia Pacific Container Monitoring Market is poised for continued growth, driven by increasing investments in digitalization within the logistics and supply chain sectors. The convergence of technologies, such as IoT, AI, and blockchain, will further enhance the capabilities of container monitoring solutions, creating new opportunities for innovation and market expansion. The focus on enhancing supply chain resilience and visibility in response to global disruptions will also contribute to sustained market growth.
Asia Pacific Container Monitoring Market Segmentation
- 1. Overall
-
2. Key Components
- 2.1. Hardware
- 2.2. Software
- 2.3. Services
-
3. Key Applications
- 3.1. Asset Condition Monitoring
- 3.2. Logistics & Supply Chain Management
- 3.3. Location Tracking
- 3.4. Security
- 3.5. Others
-
4. Geography
- 4.1. China
- 4.2. Japan
- 4.3. South Korea
- 4.4. Middle East
- 4.5. Australia and New Zealand
Asia Pacific Container Monitoring Market Segmentation By Geography
- 1. China
- 2. Japan
- 3. South Korea
- 4. Middle East
- 5. Australia and New Zealand
Asia Pacific Container Monitoring Market REPORT HIGHLIGHTS
| Aspects | Details |
|---|---|
| Study Period | 2019-2033 |
| Base Year | 2024 |
| Estimated Year | 2025 |
| Forecast Period | 2025-2033 |
| Historical Period | 2019-2024 |
| Growth Rate | CAGR of 16.38% from 2019-2033 |
| Segmentation |
|
Table of Contents
- 1. Introduction
- 1.1. Research Scope
- 1.2. Market Segmentation
- 1.3. Research Methodology
- 1.4. Definitions and Assumptions
- 2. Executive Summary
- 2.1. Introduction
- 3. Market Dynamics
- 3.1. Introduction
- 3.2. Market Drivers
- 3.2.1. Surge in Advanced Containment Materials and Structural Innovations; Increase in Seaborne Trade; Increase in Demand to Enhanced Supply Chain Efficiency
- 3.3. Market Restrains
- 3.3.1. Surge in Advanced Containment Materials and Structural Innovations; Increase in Seaborne Trade; Increase in Demand to Enhanced Supply Chain Efficiency
- 3.4. Market Trends
- 3.4.1. Container Monitoring to be a Key Driver for Growth in Logistics and Supply Chain Management
- 4. Market Factor Analysis
- 4.1. Porters Five Forces
- 4.2. Supply/Value Chain
- 4.3. PESTEL analysis
- 4.4. Market Entropy
- 4.5. Patent/Trademark Analysis
- 5. Global Asia Pacific Container Monitoring Market Analysis, Insights and Forecast, 2019-2031
- 5.1. Market Analysis, Insights and Forecast - by Overall
- 5.2. Market Analysis, Insights and Forecast - by Key Components
- 5.2.1. Hardware
- 5.2.2. Software
- 5.2.3. Services
- 5.3. Market Analysis, Insights and Forecast - by Key Applications
- 5.3.1. Asset Condition Monitoring
- 5.3.2. Logistics & Supply Chain Management
- 5.3.3. Location Tracking
- 5.3.4. Security
- 5.3.5. Others
- 5.4. Market Analysis, Insights and Forecast - by Geography
- 5.4.1. China
- 5.4.2. Japan
- 5.4.3. South Korea
- 5.4.4. Middle East
- 5.4.5. Australia and New Zealand
- 5.5. Market Analysis, Insights and Forecast - by Region
- 5.5.1. China
- 5.5.2. Japan
- 5.5.3. South Korea
- 5.5.4. Middle East
- 5.5.5. Australia and New Zealand
- 5.1. Market Analysis, Insights and Forecast - by Overall
- 6. China Asia Pacific Container Monitoring Market Analysis, Insights and Forecast, 2019-2031
- 6.1. Market Analysis, Insights and Forecast - by Overall
- 6.2. Market Analysis, Insights and Forecast - by Key Components
- 6.2.1. Hardware
- 6.2.2. Software
- 6.2.3. Services
- 6.3. Market Analysis, Insights and Forecast - by Key Applications
- 6.3.1. Asset Condition Monitoring
- 6.3.2. Logistics & Supply Chain Management
- 6.3.3. Location Tracking
- 6.3.4. Security
- 6.3.5. Others
- 6.4. Market Analysis, Insights and Forecast - by Geography
- 6.4.1. China
- 6.4.2. Japan
- 6.4.3. South Korea
- 6.4.4. Middle East
- 6.4.5. Australia and New Zealand
- 6.1. Market Analysis, Insights and Forecast - by Overall
- 7. Japan Asia Pacific Container Monitoring Market Analysis, Insights and Forecast, 2019-2031
- 7.1. Market Analysis, Insights and Forecast - by Overall
- 7.2. Market Analysis, Insights and Forecast - by Key Components
- 7.2.1. Hardware
- 7.2.2. Software
- 7.2.3. Services
- 7.3. Market Analysis, Insights and Forecast - by Key Applications
- 7.3.1. Asset Condition Monitoring
- 7.3.2. Logistics & Supply Chain Management
- 7.3.3. Location Tracking
- 7.3.4. Security
- 7.3.5. Others
- 7.4. Market Analysis, Insights and Forecast - by Geography
- 7.4.1. China
- 7.4.2. Japan
- 7.4.3. South Korea
- 7.4.4. Middle East
- 7.4.5. Australia and New Zealand
- 7.1. Market Analysis, Insights and Forecast - by Overall
- 8. South Korea Asia Pacific Container Monitoring Market Analysis, Insights and Forecast, 2019-2031
- 8.1. Market Analysis, Insights and Forecast - by Overall
- 8.2. Market Analysis, Insights and Forecast - by Key Components
- 8.2.1. Hardware
- 8.2.2. Software
- 8.2.3. Services
- 8.3. Market Analysis, Insights and Forecast - by Key Applications
- 8.3.1. Asset Condition Monitoring
- 8.3.2. Logistics & Supply Chain Management
- 8.3.3. Location Tracking
- 8.3.4. Security
- 8.3.5. Others
- 8.4. Market Analysis, Insights and Forecast - by Geography
- 8.4.1. China
- 8.4.2. Japan
- 8.4.3. South Korea
- 8.4.4. Middle East
- 8.4.5. Australia and New Zealand
- 8.1. Market Analysis, Insights and Forecast - by Overall
- 9. Middle East Asia Pacific Container Monitoring Market Analysis, Insights and Forecast, 2019-2031
- 9.1. Market Analysis, Insights and Forecast - by Overall
- 9.2. Market Analysis, Insights and Forecast - by Key Components
- 9.2.1. Hardware
- 9.2.2. Software
- 9.2.3. Services
- 9.3. Market Analysis, Insights and Forecast - by Key Applications
- 9.3.1. Asset Condition Monitoring
- 9.3.2. Logistics & Supply Chain Management
- 9.3.3. Location Tracking
- 9.3.4. Security
- 9.3.5. Others
- 9.4. Market Analysis, Insights and Forecast - by Geography
- 9.4.1. China
- 9.4.2. Japan
- 9.4.3. South Korea
- 9.4.4. Middle East
- 9.4.5. Australia and New Zealand
- 9.1. Market Analysis, Insights and Forecast - by Overall
- 10. Australia and New Zealand Asia Pacific Container Monitoring Market Analysis, Insights and Forecast, 2019-2031
- 10.1. Market Analysis, Insights and Forecast - by Overall
- 10.2. Market Analysis, Insights and Forecast - by Key Components
- 10.2.1. Hardware
- 10.2.2. Software
- 10.2.3. Services
- 10.3. Market Analysis, Insights and Forecast - by Key Applications
- 10.3.1. Asset Condition Monitoring
- 10.3.2. Logistics & Supply Chain Management
- 10.3.3. Location Tracking
- 10.3.4. Security
- 10.3.5. Others
- 10.4. Market Analysis, Insights and Forecast - by Geography
- 10.4.1. China
- 10.4.2. Japan
- 10.4.3. South Korea
- 10.4.4. Middle East
- 10.4.5. Australia and New Zealand
- 10.1. Market Analysis, Insights and Forecast - by Overall
- 11. Competitive Analysis
- 11.1. Global Market Share Analysis 2024
- 11.2. Company Profiles
- 11.2.1 ORBCOMM Inc
- 11.2.1.1. Overview
- 11.2.1.2. Products
- 11.2.1.3. SWOT Analysis
- 11.2.1.4. Recent Developments
- 11.2.1.5. Financials (Based on Availability)
- 11.2.2 Geoforce Inc
- 11.2.2.1. Overview
- 11.2.2.2. Products
- 11.2.2.3. SWOT Analysis
- 11.2.2.4. Recent Developments
- 11.2.2.5. Financials (Based on Availability)
- 11.2.3 Globe Tracker ApS
- 11.2.3.1. Overview
- 11.2.3.2. Products
- 11.2.3.3. SWOT Analysis
- 11.2.3.4. Recent Developments
- 11.2.3.5. Financials (Based on Availability)
- 11.2.4 Phillips Connect Technologies (Phillips Industries Inc )
- 11.2.4.1. Overview
- 11.2.4.2. Products
- 11.2.4.3. SWOT Analysis
- 11.2.4.4. Recent Developments
- 11.2.4.5. Financials (Based on Availability)
- 11.2.5 Emerson Electric Co
- 11.2.5.1. Overview
- 11.2.5.2. Products
- 11.2.5.3. SWOT Analysis
- 11.2.5.4. Recent Developments
- 11.2.5.5. Financials (Based on Availability)
- 11.2.6 Hapag-Lloyd AG
- 11.2.6.1. Overview
- 11.2.6.2. Products
- 11.2.6.3. SWOT Analysis
- 11.2.6.4. Recent Developments
- 11.2.6.5. Financials (Based on Availability)
- 11.2.7 TRAXENS
- 11.2.7.1. Overview
- 11.2.7.2. Products
- 11.2.7.3. SWOT Analysis
- 11.2.7.4. Recent Developments
- 11.2.7.5. Financials (Based on Availability)
- 11.2.8 Roambee Corporation
- 11.2.8.1. Overview
- 11.2.8.2. Products
- 11.2.8.3. SWOT Analysis
- 11.2.8.4. Recent Developments
- 11.2.8.5. Financials (Based on Availability)
- 11.2.9 OnAsset Intelligence Inc
- 11.2.9.1. Overview
- 11.2.9.2. Products
- 11.2.9.3. SWOT Analysis
- 11.2.9.4. Recent Developments
- 11.2.9.5. Financials (Based on Availability)
- 11.2.10 Zabbix LLC *List Not Exhaustive
- 11.2.10.1. Overview
- 11.2.10.2. Products
- 11.2.10.3. SWOT Analysis
- 11.2.10.4. Recent Developments
- 11.2.10.5. Financials (Based on Availability)
- 11.2.1 ORBCOMM Inc
List of Figures
- Figure 1: Global Asia Pacific Container Monitoring Market Revenue Breakdown (Million, %) by Region 2024 & 2032
- Figure 2: Global Asia Pacific Container Monitoring Market Volume Breakdown (Billion, %) by Region 2024 & 2032
- Figure 3: China Asia Pacific Container Monitoring Market Revenue (Million), by Overall 2024 & 2032
- Figure 4: China Asia Pacific Container Monitoring Market Volume (Billion), by Overall 2024 & 2032
- Figure 5: China Asia Pacific Container Monitoring Market Revenue Share (%), by Overall 2024 & 2032
- Figure 6: China Asia Pacific Container Monitoring Market Volume Share (%), by Overall 2024 & 2032
- Figure 7: China Asia Pacific Container Monitoring Market Revenue (Million), by Key Components 2024 & 2032
- Figure 8: China Asia Pacific Container Monitoring Market Volume (Billion), by Key Components 2024 & 2032
- Figure 9: China Asia Pacific Container Monitoring Market Revenue Share (%), by Key Components 2024 & 2032
- Figure 10: China Asia Pacific Container Monitoring Market Volume Share (%), by Key Components 2024 & 2032
- Figure 11: China Asia Pacific Container Monitoring Market Revenue (Million), by Key Applications 2024 & 2032
- Figure 12: China Asia Pacific Container Monitoring Market Volume (Billion), by Key Applications 2024 & 2032
- Figure 13: China Asia Pacific Container Monitoring Market Revenue Share (%), by Key Applications 2024 & 2032
- Figure 14: China Asia Pacific Container Monitoring Market Volume Share (%), by Key Applications 2024 & 2032
- Figure 15: China Asia Pacific Container Monitoring Market Revenue (Million), by Geography 2024 & 2032
- Figure 16: China Asia Pacific Container Monitoring Market Volume (Billion), by Geography 2024 & 2032
- Figure 17: China Asia Pacific Container Monitoring Market Revenue Share (%), by Geography 2024 & 2032
- Figure 18: China Asia Pacific Container Monitoring Market Volume Share (%), by Geography 2024 & 2032
- Figure 19: China Asia Pacific Container Monitoring Market Revenue (Million), by Country 2024 & 2032
- Figure 20: China Asia Pacific Container Monitoring Market Volume (Billion), by Country 2024 & 2032
- Figure 21: China Asia Pacific Container Monitoring Market Revenue Share (%), by Country 2024 & 2032
- Figure 22: China Asia Pacific Container Monitoring Market Volume Share (%), by Country 2024 & 2032
- Figure 23: Japan Asia Pacific Container Monitoring Market Revenue (Million), by Overall 2024 & 2032
- Figure 24: Japan Asia Pacific Container Monitoring Market Volume (Billion), by Overall 2024 & 2032
- Figure 25: Japan Asia Pacific Container Monitoring Market Revenue Share (%), by Overall 2024 & 2032
- Figure 26: Japan Asia Pacific Container Monitoring Market Volume Share (%), by Overall 2024 & 2032
- Figure 27: Japan Asia Pacific Container Monitoring Market Revenue (Million), by Key Components 2024 & 2032
- Figure 28: Japan Asia Pacific Container Monitoring Market Volume (Billion), by Key Components 2024 & 2032
- Figure 29: Japan Asia Pacific Container Monitoring Market Revenue Share (%), by Key Components 2024 & 2032
- Figure 30: Japan Asia Pacific Container Monitoring Market Volume Share (%), by Key Components 2024 & 2032
- Figure 31: Japan Asia Pacific Container Monitoring Market Revenue (Million), by Key Applications 2024 & 2032
- Figure 32: Japan Asia Pacific Container Monitoring Market Volume (Billion), by Key Applications 2024 & 2032
- Figure 33: Japan Asia Pacific Container Monitoring Market Revenue Share (%), by Key Applications 2024 & 2032
- Figure 34: Japan Asia Pacific Container Monitoring Market Volume Share (%), by Key Applications 2024 & 2032
- Figure 35: Japan Asia Pacific Container Monitoring Market Revenue (Million), by Geography 2024 & 2032
- Figure 36: Japan Asia Pacific Container Monitoring Market Volume (Billion), by Geography 2024 & 2032
- Figure 37: Japan Asia Pacific Container Monitoring Market Revenue Share (%), by Geography 2024 & 2032
- Figure 38: Japan Asia Pacific Container Monitoring Market Volume Share (%), by Geography 2024 & 2032
- Figure 39: Japan Asia Pacific Container Monitoring Market Revenue (Million), by Country 2024 & 2032
- Figure 40: Japan Asia Pacific Container Monitoring Market Volume (Billion), by Country 2024 & 2032
- Figure 41: Japan Asia Pacific Container Monitoring Market Revenue Share (%), by Country 2024 & 2032
- Figure 42: Japan Asia Pacific Container Monitoring Market Volume Share (%), by Country 2024 & 2032
- Figure 43: South Korea Asia Pacific Container Monitoring Market Revenue (Million), by Overall 2024 & 2032
- Figure 44: South Korea Asia Pacific Container Monitoring Market Volume (Billion), by Overall 2024 & 2032
- Figure 45: South Korea Asia Pacific Container Monitoring Market Revenue Share (%), by Overall 2024 & 2032
- Figure 46: South Korea Asia Pacific Container Monitoring Market Volume Share (%), by Overall 2024 & 2032
- Figure 47: South Korea Asia Pacific Container Monitoring Market Revenue (Million), by Key Components 2024 & 2032
- Figure 48: South Korea Asia Pacific Container Monitoring Market Volume (Billion), by Key Components 2024 & 2032
- Figure 49: South Korea Asia Pacific Container Monitoring Market Revenue Share (%), by Key Components 2024 & 2032
- Figure 50: South Korea Asia Pacific Container Monitoring Market Volume Share (%), by Key Components 2024 & 2032
- Figure 51: South Korea Asia Pacific Container Monitoring Market Revenue (Million), by Key Applications 2024 & 2032
- Figure 52: South Korea Asia Pacific Container Monitoring Market Volume (Billion), by Key Applications 2024 & 2032
- Figure 53: South Korea Asia Pacific Container Monitoring Market Revenue Share (%), by Key Applications 2024 & 2032
- Figure 54: South Korea Asia Pacific Container Monitoring Market Volume Share (%), by Key Applications 2024 & 2032
- Figure 55: South Korea Asia Pacific Container Monitoring Market Revenue (Million), by Geography 2024 & 2032
- Figure 56: South Korea Asia Pacific Container Monitoring Market Volume (Billion), by Geography 2024 & 2032
- Figure 57: South Korea Asia Pacific Container Monitoring Market Revenue Share (%), by Geography 2024 & 2032
- Figure 58: South Korea Asia Pacific Container Monitoring Market Volume Share (%), by Geography 2024 & 2032
- Figure 59: South Korea Asia Pacific Container Monitoring Market Revenue (Million), by Country 2024 & 2032
- Figure 60: South Korea Asia Pacific Container Monitoring Market Volume (Billion), by Country 2024 & 2032
- Figure 61: South Korea Asia Pacific Container Monitoring Market Revenue Share (%), by Country 2024 & 2032
- Figure 62: South Korea Asia Pacific Container Monitoring Market Volume Share (%), by Country 2024 & 2032
- Figure 63: Middle East Asia Pacific Container Monitoring Market Revenue (Million), by Overall 2024 & 2032
- Figure 64: Middle East Asia Pacific Container Monitoring Market Volume (Billion), by Overall 2024 & 2032
- Figure 65: Middle East Asia Pacific Container Monitoring Market Revenue Share (%), by Overall 2024 & 2032
- Figure 66: Middle East Asia Pacific Container Monitoring Market Volume Share (%), by Overall 2024 & 2032
- Figure 67: Middle East Asia Pacific Container Monitoring Market Revenue (Million), by Key Components 2024 & 2032
- Figure 68: Middle East Asia Pacific Container Monitoring Market Volume (Billion), by Key Components 2024 & 2032
- Figure 69: Middle East Asia Pacific Container Monitoring Market Revenue Share (%), by Key Components 2024 & 2032
- Figure 70: Middle East Asia Pacific Container Monitoring Market Volume Share (%), by Key Components 2024 & 2032
- Figure 71: Middle East Asia Pacific Container Monitoring Market Revenue (Million), by Key Applications 2024 & 2032
- Figure 72: Middle East Asia Pacific Container Monitoring Market Volume (Billion), by Key Applications 2024 & 2032
- Figure 73: Middle East Asia Pacific Container Monitoring Market Revenue Share (%), by Key Applications 2024 & 2032
- Figure 74: Middle East Asia Pacific Container Monitoring Market Volume Share (%), by Key Applications 2024 & 2032
- Figure 75: Middle East Asia Pacific Container Monitoring Market Revenue (Million), by Geography 2024 & 2032
- Figure 76: Middle East Asia Pacific Container Monitoring Market Volume (Billion), by Geography 2024 & 2032
- Figure 77: Middle East Asia Pacific Container Monitoring Market Revenue Share (%), by Geography 2024 & 2032
- Figure 78: Middle East Asia Pacific Container Monitoring Market Volume Share (%), by Geography 2024 & 2032
- Figure 79: Middle East Asia Pacific Container Monitoring Market Revenue (Million), by Country 2024 & 2032
- Figure 80: Middle East Asia Pacific Container Monitoring Market Volume (Billion), by Country 2024 & 2032
- Figure 81: Middle East Asia Pacific Container Monitoring Market Revenue Share (%), by Country 2024 & 2032
- Figure 82: Middle East Asia Pacific Container Monitoring Market Volume Share (%), by Country 2024 & 2032
- Figure 83: Australia and New Zealand Asia Pacific Container Monitoring Market Revenue (Million), by Overall 2024 & 2032
- Figure 84: Australia and New Zealand Asia Pacific Container Monitoring Market Volume (Billion), by Overall 2024 & 2032
- Figure 85: Australia and New Zealand Asia Pacific Container Monitoring Market Revenue Share (%), by Overall 2024 & 2032
- Figure 86: Australia and New Zealand Asia Pacific Container Monitoring Market Volume Share (%), by Overall 2024 & 2032
- Figure 87: Australia and New Zealand Asia Pacific Container Monitoring Market Revenue (Million), by Key Components 2024 & 2032
- Figure 88: Australia and New Zealand Asia Pacific Container Monitoring Market Volume (Billion), by Key Components 2024 & 2032
- Figure 89: Australia and New Zealand Asia Pacific Container Monitoring Market Revenue Share (%), by Key Components 2024 & 2032
- Figure 90: Australia and New Zealand Asia Pacific Container Monitoring Market Volume Share (%), by Key Components 2024 & 2032
- Figure 91: Australia and New Zealand Asia Pacific Container Monitoring Market Revenue (Million), by Key Applications 2024 & 2032
- Figure 92: Australia and New Zealand Asia Pacific Container Monitoring Market Volume (Billion), by Key Applications 2024 & 2032
- Figure 93: Australia and New Zealand Asia Pacific Container Monitoring Market Revenue Share (%), by Key Applications 2024 & 2032
- Figure 94: Australia and New Zealand Asia Pacific Container Monitoring Market Volume Share (%), by Key Applications 2024 & 2032
- Figure 95: Australia and New Zealand Asia Pacific Container Monitoring Market Revenue (Million), by Geography 2024 & 2032
- Figure 96: Australia and New Zealand Asia Pacific Container Monitoring Market Volume (Billion), by Geography 2024 & 2032
- Figure 97: Australia and New Zealand Asia Pacific Container Monitoring Market Revenue Share (%), by Geography 2024 & 2032
- Figure 98: Australia and New Zealand Asia Pacific Container Monitoring Market Volume Share (%), by Geography 2024 & 2032
- Figure 99: Australia and New Zealand Asia Pacific Container Monitoring Market Revenue (Million), by Country 2024 & 2032
- Figure 100: Australia and New Zealand Asia Pacific Container Monitoring Market Volume (Billion), by Country 2024 & 2032
- Figure 101: Australia and New Zealand Asia Pacific Container Monitoring Market Revenue Share (%), by Country 2024 & 2032
- Figure 102: Australia and New Zealand Asia Pacific Container Monitoring Market Volume Share (%), by Country 2024 & 2032
List of Tables
- Table 1: Global Asia Pacific Container Monitoring Market Revenue Million Forecast, by Region 2019 & 2032
- Table 2: Global Asia Pacific Container Monitoring Market Volume Billion Forecast, by Region 2019 & 2032
- Table 3: Global Asia Pacific Container Monitoring Market Revenue Million Forecast, by Overall 2019 & 2032
- Table 4: Global Asia Pacific Container Monitoring Market Volume Billion Forecast, by Overall 2019 & 2032
- Table 5: Global Asia Pacific Container Monitoring Market Revenue Million Forecast, by Key Components 2019 & 2032
- Table 6: Global Asia Pacific Container Monitoring Market Volume Billion Forecast, by Key Components 2019 & 2032
- Table 7: Global Asia Pacific Container Monitoring Market Revenue Million Forecast, by Key Applications 2019 & 2032
- Table 8: Global Asia Pacific Container Monitoring Market Volume Billion Forecast, by Key Applications 2019 & 2032
- Table 9: Global Asia Pacific Container Monitoring Market Revenue Million Forecast, by Geography 2019 & 2032
- Table 10: Global Asia Pacific Container Monitoring Market Volume Billion Forecast, by Geography 2019 & 2032
- Table 11: Global Asia Pacific Container Monitoring Market Revenue Million Forecast, by Region 2019 & 2032
- Table 12: Global Asia Pacific Container Monitoring Market Volume Billion Forecast, by Region 2019 & 2032
- Table 13: Global Asia Pacific Container Monitoring Market Revenue Million Forecast, by Overall 2019 & 2032
- Table 14: Global Asia Pacific Container Monitoring Market Volume Billion Forecast, by Overall 2019 & 2032
- Table 15: Global Asia Pacific Container Monitoring Market Revenue Million Forecast, by Key Components 2019 & 2032
- Table 16: Global Asia Pacific Container Monitoring Market Volume Billion Forecast, by Key Components 2019 & 2032
- Table 17: Global Asia Pacific Container Monitoring Market Revenue Million Forecast, by Key Applications 2019 & 2032
- Table 18: Global Asia Pacific Container Monitoring Market Volume Billion Forecast, by Key Applications 2019 & 2032
- Table 19: Global Asia Pacific Container Monitoring Market Revenue Million Forecast, by Geography 2019 & 2032
- Table 20: Global Asia Pacific Container Monitoring Market Volume Billion Forecast, by Geography 2019 & 2032
- Table 21: Global Asia Pacific Container Monitoring Market Revenue Million Forecast, by Country 2019 & 2032
- Table 22: Global Asia Pacific Container Monitoring Market Volume Billion Forecast, by Country 2019 & 2032
- Table 23: Global Asia Pacific Container Monitoring Market Revenue Million Forecast, by Overall 2019 & 2032
- Table 24: Global Asia Pacific Container Monitoring Market Volume Billion Forecast, by Overall 2019 & 2032
- Table 25: Global Asia Pacific Container Monitoring Market Revenue Million Forecast, by Key Components 2019 & 2032
- Table 26: Global Asia Pacific Container Monitoring Market Volume Billion Forecast, by Key Components 2019 & 2032
- Table 27: Global Asia Pacific Container Monitoring Market Revenue Million Forecast, by Key Applications 2019 & 2032
- Table 28: Global Asia Pacific Container Monitoring Market Volume Billion Forecast, by Key Applications 2019 & 2032
- Table 29: Global Asia Pacific Container Monitoring Market Revenue Million Forecast, by Geography 2019 & 2032
- Table 30: Global Asia Pacific Container Monitoring Market Volume Billion Forecast, by Geography 2019 & 2032
- Table 31: Global Asia Pacific Container Monitoring Market Revenue Million Forecast, by Country 2019 & 2032
- Table 32: Global Asia Pacific Container Monitoring Market Volume Billion Forecast, by Country 2019 & 2032
- Table 33: Global Asia Pacific Container Monitoring Market Revenue Million Forecast, by Overall 2019 & 2032
- Table 34: Global Asia Pacific Container Monitoring Market Volume Billion Forecast, by Overall 2019 & 2032
- Table 35: Global Asia Pacific Container Monitoring Market Revenue Million Forecast, by Key Components 2019 & 2032
- Table 36: Global Asia Pacific Container Monitoring Market Volume Billion Forecast, by Key Components 2019 & 2032
- Table 37: Global Asia Pacific Container Monitoring Market Revenue Million Forecast, by Key Applications 2019 & 2032
- Table 38: Global Asia Pacific Container Monitoring Market Volume Billion Forecast, by Key Applications 2019 & 2032
- Table 39: Global Asia Pacific Container Monitoring Market Revenue Million Forecast, by Geography 2019 & 2032
- Table 40: Global Asia Pacific Container Monitoring Market Volume Billion Forecast, by Geography 2019 & 2032
- Table 41: Global Asia Pacific Container Monitoring Market Revenue Million Forecast, by Country 2019 & 2032
- Table 42: Global Asia Pacific Container Monitoring Market Volume Billion Forecast, by Country 2019 & 2032
- Table 43: Global Asia Pacific Container Monitoring Market Revenue Million Forecast, by Overall 2019 & 2032
- Table 44: Global Asia Pacific Container Monitoring Market Volume Billion Forecast, by Overall 2019 & 2032
- Table 45: Global Asia Pacific Container Monitoring Market Revenue Million Forecast, by Key Components 2019 & 2032
- Table 46: Global Asia Pacific Container Monitoring Market Volume Billion Forecast, by Key Components 2019 & 2032
- Table 47: Global Asia Pacific Container Monitoring Market Revenue Million Forecast, by Key Applications 2019 & 2032
- Table 48: Global Asia Pacific Container Monitoring Market Volume Billion Forecast, by Key Applications 2019 & 2032
- Table 49: Global Asia Pacific Container Monitoring Market Revenue Million Forecast, by Geography 2019 & 2032
- Table 50: Global Asia Pacific Container Monitoring Market Volume Billion Forecast, by Geography 2019 & 2032
- Table 51: Global Asia Pacific Container Monitoring Market Revenue Million Forecast, by Country 2019 & 2032
- Table 52: Global Asia Pacific Container Monitoring Market Volume Billion Forecast, by Country 2019 & 2032
- Table 53: Global Asia Pacific Container Monitoring Market Revenue Million Forecast, by Overall 2019 & 2032
- Table 54: Global Asia Pacific Container Monitoring Market Volume Billion Forecast, by Overall 2019 & 2032
- Table 55: Global Asia Pacific Container Monitoring Market Revenue Million Forecast, by Key Components 2019 & 2032
- Table 56: Global Asia Pacific Container Monitoring Market Volume Billion Forecast, by Key Components 2019 & 2032
- Table 57: Global Asia Pacific Container Monitoring Market Revenue Million Forecast, by Key Applications 2019 & 2032
- Table 58: Global Asia Pacific Container Monitoring Market Volume Billion Forecast, by Key Applications 2019 & 2032
- Table 59: Global Asia Pacific Container Monitoring Market Revenue Million Forecast, by Geography 2019 & 2032
- Table 60: Global Asia Pacific Container Monitoring Market Volume Billion Forecast, by Geography 2019 & 2032
- Table 61: Global Asia Pacific Container Monitoring Market Revenue Million Forecast, by Country 2019 & 2032
- Table 62: Global Asia Pacific Container Monitoring Market Volume Billion Forecast, by Country 2019 & 2032
Frequently Asked Questions
1. What is the projected Compound Annual Growth Rate (CAGR) of the Asia Pacific Container Monitoring Market?
The projected CAGR is approximately 16.38%.
2. Which companies are prominent players in the Asia Pacific Container Monitoring Market?
Key companies in the market include ORBCOMM Inc, Geoforce Inc, Globe Tracker ApS, Phillips Connect Technologies (Phillips Industries Inc ), Emerson Electric Co, Hapag-Lloyd AG, TRAXENS, Roambee Corporation, OnAsset Intelligence Inc, Zabbix LLC *List Not Exhaustive.
3. What are the main segments of the Asia Pacific Container Monitoring Market?
The market segments include Overall , Key Components, Key Applications, Geography.
4. Can you provide details about the market size?
The market size is estimated to be USD 2.26 Million as of 2022.
5. What are some drivers contributing to market growth?
Surge in Advanced Containment Materials and Structural Innovations; Increase in Seaborne Trade; Increase in Demand to Enhanced Supply Chain Efficiency.
6. What are the notable trends driving market growth?
Container Monitoring to be a Key Driver for Growth in Logistics and Supply Chain Management.
7. Are there any restraints impacting market growth?
Surge in Advanced Containment Materials and Structural Innovations; Increase in Seaborne Trade; Increase in Demand to Enhanced Supply Chain Efficiency.
8. Can you provide examples of recent developments in the market?
September 2024: ZIM Integrated Shipping Services Ltd., a container liner shipping company, announced that it has entered into a new long-term operational cooperation with Mediterranean Shipping Company (MSC) on the Asia - US East Coast and Asia - US Gulf trades. The new services are scheduled to be launched in February 2025, subject to regulatory approvals and filings. This important collaboration reflects ZIM's commitment to both delivering an outstanding shipping solution to its customers and taking continuous proactive steps to enhance efficiencies in their network. It is the direct outcome of their fleet renewal program which has greatly enhanced ZIM's competitive position, particularly on the Asia to US East Coast tradeSeptember 2024: Kalmar has signed an agreement with ContainerCo, a key independent container depot operator in New Zealand, to supply six Kalmar empty container handlers. ContainerCo has grown to become one of the key independent container depots in New Zealand, offering an extensive range of products and services to countless commercial and private customers. The company’s offering includes shipping container sales and leasing, container modification, depot services and container transportation services. The current ContainerCo fleet includes 12 Kalmar empty container handlers.
9. What pricing options are available for accessing the report?
Pricing options include single-user, multi-user, and enterprise licenses priced at USD 4750, USD 5250, and USD 8750 respectively.
10. Is the market size provided in terms of value or volume?
The market size is provided in terms of value, measured in Million and volume, measured in Billion.
11. Are there any specific market keywords associated with the report?
Yes, the market keyword associated with the report is "Asia Pacific Container Monitoring Market," which aids in identifying and referencing the specific market segment covered.
12. How do I determine which pricing option suits my needs best?
The pricing options vary based on user requirements and access needs. Individual users may opt for single-user licenses, while businesses requiring broader access may choose multi-user or enterprise licenses for cost-effective access to the report.
13. Are there any additional resources or data provided in the Asia Pacific Container Monitoring Market report?
While the report offers comprehensive insights, it's advisable to review the specific contents or supplementary materials provided to ascertain if additional resources or data are available.
14. How can I stay updated on further developments or reports in the Asia Pacific Container Monitoring Market?
To stay informed about further developments, trends, and reports in the Asia Pacific Container Monitoring Market, consider subscribing to industry newsletters, following relevant companies and organizations, or regularly checking reputable industry news sources and publications.
Methodology
Step 1 - Identification of Relevant Samples Size from Population Database


Step 2 - Approaches for Defining Global Market Size (Value, Volume* & Price*)

Note*: In applicable scenarios
Step 3 - Data Sources
Primary Research
- Web Analytics
- Survey Reports
- Research Institute
- Latest Research Reports
- Opinion Leaders
Secondary Research
- Annual Reports
- White Paper
- Latest Press Release
- Industry Association
- Paid Database
- Investor Presentations

Step 4 - Data Triangulation
Involves using different sources of information in order to increase the validity of a study
These sources are likely to be stakeholders in a program - participants, other researchers, program staff, other community members, and so on.
Then we put all data in single framework & apply various statistical tools to find out the dynamic on the market.
During the analysis stage, feedback from the stakeholder groups would be compared to determine areas of agreement as well as areas of divergence


