
Key Insights
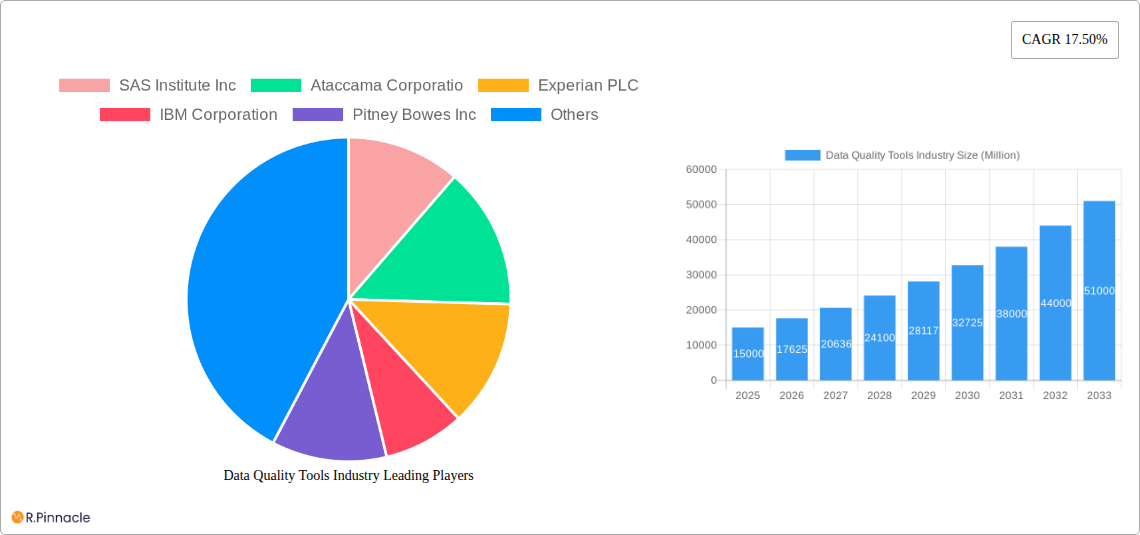
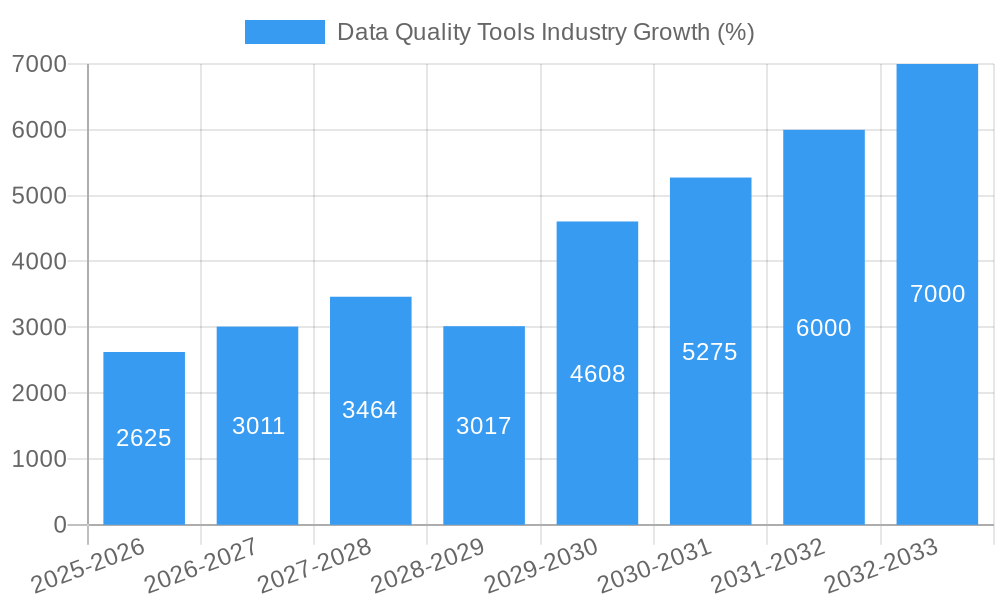
The Data Quality Tools market is experiencing robust growth, projected to reach a substantial size with a Compound Annual Growth Rate (CAGR) of 17.50% from 2025 to 2033. This expansion is fueled by several key drivers. The increasing volume and velocity of data generated across various industries necessitates robust data quality management solutions. Businesses are increasingly recognizing the importance of accurate and reliable data for informed decision-making, improved operational efficiency, and compliance with regulatory requirements. The shift towards cloud-based deployments offers scalability and cost-effectiveness, further accelerating market growth. Furthermore, the rising adoption of advanced analytics and AI/ML techniques, which heavily rely on high-quality data, is significantly contributing to the market's expansion. The market is segmented by deployment type (cloud-based and on-premise), organizational size (SMEs and large enterprises), component (software and services), and end-user vertical (BFSI, government, IT & Telecom, retail and e-commerce, healthcare, and others). While the competitive landscape is populated by established players like SAS Institute, IBM, and Informatica, the market also presents opportunities for innovative startups offering specialized solutions. Geographic expansion, particularly in emerging markets in Asia Pacific, is expected to be a significant growth driver in the coming years. However, challenges such as the complexity of implementing data quality solutions and the need for skilled professionals might act as restraints on market growth.
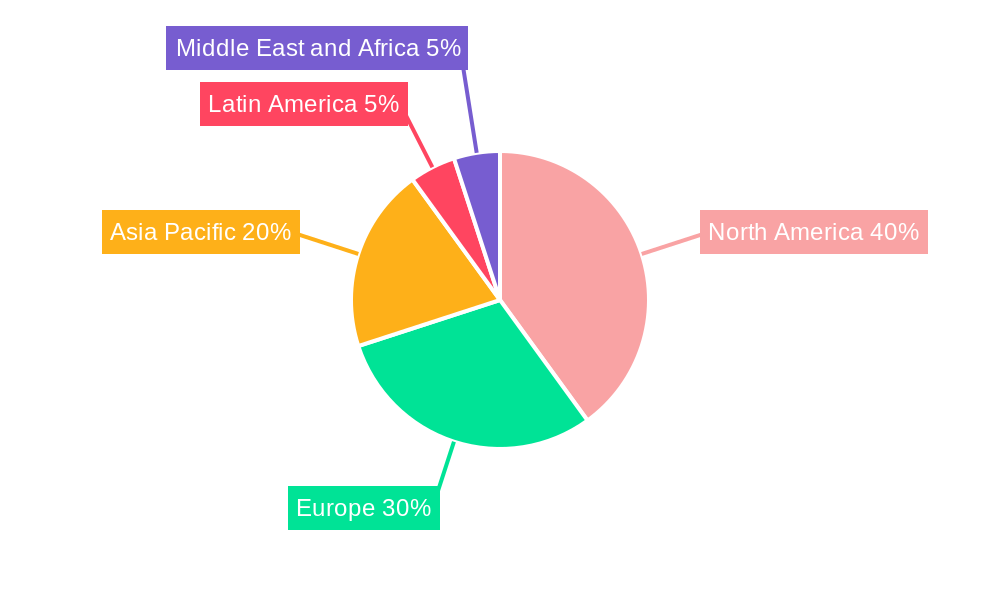
The North American market currently holds a significant share, driven by early adoption of advanced technologies and a strong regulatory environment. However, other regions, especially Asia Pacific, are witnessing rapid growth due to increasing digitalization and expanding data infrastructure. The on-premise deployment model still holds a substantial portion of the market, but the cloud-based segment is experiencing the fastest growth, reflecting the industry-wide trend toward cloud adoption. The software component dominates the market, but the services segment is experiencing significant growth due to the rising demand for professional services related to implementation, integration, and maintenance of data quality tools. The BFSI and government sectors remain key end-user verticals, but the growing adoption of data-driven strategies across retail, healthcare, and other industries is driving market expansion in these sectors as well. The long-term outlook for the Data Quality Tools market remains positive, with continued growth expected throughout the forecast period.
Data Quality Tools Industry Market Report: 2019-2033
This comprehensive report provides a detailed analysis of the Data Quality Tools market, projecting a robust growth trajectory from 2019 to 2033. Leveraging extensive market research, this report offers actionable insights for industry professionals, investors, and businesses seeking to navigate this rapidly evolving landscape. The report covers key market segments, leading players, emerging trends, and future growth potential, providing a 360° view of the Data Quality Tools market. The study period is 2019-2033, with 2025 as the base and estimated year. The forecast period spans 2025-2033 and the historical period covers 2019-2024.
Data Quality Tools Industry Market Structure & Innovation Trends
The Data Quality Tools market is characterized by a moderately concentrated structure, with a few major players holding significant market share. While precise market share figures for individual companies remain proprietary, estimates suggest that the top 10 players likely command over 60% of the global market. This concentration is influenced by factors such as substantial R&D investment and established brand recognition. Innovation in this sector is driven by the increasing volume and complexity of data, necessitating more sophisticated tools for data cleansing, validation, and monitoring. Regulatory frameworks like GDPR and CCPA are also significant drivers, pushing for improved data quality and compliance. Product substitutes are limited, primarily other data management tools, but often lack the specialized focus of data quality tools. Mergers and acquisitions (M&A) are frequent, with deal values often exceeding $XX million, reflecting the strategic importance of this sector. For example, recent M&A activities within the industry indicate a consolidation trend, with larger players actively acquiring smaller, specialized firms to expand their product portfolios and market reach.
Data Quality Tools Industry Market Dynamics & Trends
The Data Quality Tools market is experiencing significant growth, driven by the exponential increase in data volume across various industries. The compound annual growth rate (CAGR) is projected to be approximately XX% during the forecast period (2025-2033), indicating strong market expansion. Key growth drivers include increasing demand for data-driven decision-making, rising awareness of data quality’s importance for business operations, and the growing adoption of cloud-based solutions. Technological disruptions, such as the rise of artificial intelligence (AI) and machine learning (ML) in data quality management, are revolutionizing the industry, offering enhanced automation and accuracy. Consumer preferences are shifting towards user-friendly, scalable, and cost-effective solutions, further influencing market dynamics. Market penetration is steadily increasing across various sectors, indicating wide-scale adoption. Competitive dynamics are characterized by both innovation and consolidation, with leading players constantly developing new features and functionalities to maintain their edge. The market size is estimated to reach $XX million by 2025.
Dominant Regions & Segments in Data Quality Tools Industry
The North American region currently holds a dominant position in the Data Quality Tools market, driven by high technological advancements and early adoption of data-driven strategies. However, the Asia-Pacific region is expected to witness significant growth in the coming years.
- Deployment Type: The cloud-based segment holds the largest share, driven by cost-effectiveness, scalability, and accessibility.
- Size of Organization: Large enterprises dominate the market due to their greater investment capacity and complex data management needs. However, SMEs are showing increasing adoption of data quality tools.
- Component: The software segment contributes significantly, followed by the services segment providing support, implementation, and consulting.
- End-user Verticals: The BFSI (Banking, Financial Services, and Insurance), Government, and IT & Telecom sectors are major consumers of data quality tools, due to stringent regulatory compliance and vast data volumes. Retail and e-commerce are experiencing increasing adoption as well.
Key drivers for regional dominance include robust economic growth, favorable regulatory frameworks, and well-developed IT infrastructure.
Data Quality Tools Industry Product Innovations
Recent product innovations focus on AI-powered automation, enhanced data profiling capabilities, improved data cleansing techniques, and seamless integration with existing data management systems. These advancements aim to streamline data quality processes, reduce manual intervention, and improve data accuracy. The market is seeing increased emphasis on user-friendly interfaces and self-service capabilities, catering to the needs of businesses with limited data science expertise.
Report Scope & Segmentation Analysis
This report segments the Data Quality Tools market based on deployment type (cloud-based, on-premise), size of organization (SMEs, large enterprises), component (software, services), and end-user vertical (BFSI, government, IT & telecom, retail & e-commerce, healthcare, others). Each segment's growth projections, market size estimates, and competitive dynamics are analyzed in detail, offering a granular understanding of the market landscape. For example, the cloud-based segment is projected to exhibit higher growth compared to on-premise due to increasing cloud adoption. Similarly, the large enterprise segment holds a significant share, but the SME segment is anticipated to grow at a faster rate.
Key Drivers of Data Quality Tools Industry Growth
Several factors drive the growth of the data quality tools industry. These include the increasing volume and complexity of data, stringent regulatory requirements for data privacy and security (e.g., GDPR, CCPA), and the rising demand for data-driven decision-making across all industries. Technological advancements like AI and ML are enhancing data quality tools’ efficiency and accuracy, furthering market growth. Businesses are increasingly realizing the value of accurate, reliable data for optimizing operations, improving customer experience, and gaining a competitive edge.
Challenges in the Data Quality Tools Industry Sector
Challenges facing the data quality tools industry include high implementation costs, the need for specialized skills to operate and maintain these tools, and the potential integration complexities with existing systems. Furthermore, the ever-evolving regulatory landscape adds another layer of complexity and necessitates constant adaptation. Competitive pressures, especially from established players with extensive resources, are another challenge.
Emerging Opportunities in Data Quality Tools Industry
Emerging opportunities include the expansion into new geographical markets, especially in developing economies. The integration of advanced analytics and AI capabilities presents significant opportunities for enhanced data quality management. The growing focus on data governance and compliance further fuels market growth by creating a demand for robust data quality solutions. The development of specialized tools for specific industry verticals also represents a key opportunity.
Leading Players in the Data Quality Tools Industry Market
- SAS Institute Inc
- Ataccama Corporatio
- Experian PLC
- IBM Corporation
- Pitney Bowes Inc
- Information Builders Inc
- Syncsort Inc
- Oracle Corporation
- Informatica LLC
- Talend Inc
- SAP SE
Key Developments in Data Quality Tools Industry
- September 2022: DataCebo launched Synthetic Data (SD) Metrics, a tool for comparing the quality of synthetic data against real datasets. This innovation significantly impacts the market by addressing a crucial challenge in synthetic data utilization.
- May 2022: Pyramid Analytics secured USD 120 million in Series E funding, boosting its development and market expansion efforts for its AI-guided data analytics platform. This signifies investor confidence in the market’s growth potential and the platform's capability.
Future Outlook for Data Quality Tools Industry Market
The future outlook for the Data Quality Tools market remains positive, fueled by continued digital transformation across industries, increasing data volumes, and stricter data regulations. Strategic partnerships, technological advancements, and the development of innovative solutions will shape the industry's future growth. The market is poised for significant expansion, with opportunities for both established players and new entrants. The focus will be on AI-driven solutions, enhanced data governance, and tailored solutions for specific industry needs.
Data Quality Tools Industry Segmentation
-
1. Deployment Type
- 1.1. Cloud-based
- 1.2. On Premise
-
2. Size of the Organization
- 2.1. Small and Medium Enterprises
- 2.2. Large Enterprises
-
3. Component
- 3.1. Software
- 3.2. Services
-
4. End-user Vertical
- 4.1. BFSI
- 4.2. Government
- 4.3. IT & Telecom
- 4.4. Retail and E-commerce
- 4.5. Healthcare
- 4.6. Other End-user Industries
Data Quality Tools Industry Segmentation By Geography
- 1. North America
- 2. Europe
- 3. Asia Pacific
- 4. Latin America
- 5. Middle East and Africa
Data Quality Tools Industry REPORT HIGHLIGHTS
| Aspects | Details |
|---|---|
| Study Period | 2019-2033 |
| Base Year | 2024 |
| Estimated Year | 2025 |
| Forecast Period | 2025-2033 |
| Historical Period | 2019-2024 |
| Growth Rate | CAGR of 17.50% from 2019-2033 |
| Segmentation |
|
Table of Contents
- 1. Introduction
- 1.1. Research Scope
- 1.2. Market Segmentation
- 1.3. Research Methodology
- 1.4. Definitions and Assumptions
- 2. Executive Summary
- 2.1. Introduction
- 3. Market Dynamics
- 3.1. Introduction
- 3.2. Market Drivers
- 3.2.1. Increasing Use of External Data Sources Owing to Mobile Connectivity Growth
- 3.3. Market Restrains
- 3.3.1. Lack of information and Awareness about the Solutions Among Potential Users
- 3.4. Market Trends
- 3.4.1. Healthcare is Expected to Witness Significant Growth
- 4. Market Factor Analysis
- 4.1. Porters Five Forces
- 4.2. Supply/Value Chain
- 4.3. PESTEL analysis
- 4.4. Market Entropy
- 4.5. Patent/Trademark Analysis
- 5. Global Data Quality Tools Industry Analysis, Insights and Forecast, 2019-2031
- 5.1. Market Analysis, Insights and Forecast - by Deployment Type
- 5.1.1. Cloud-based
- 5.1.2. On Premise
- 5.2. Market Analysis, Insights and Forecast - by Size of the Organization
- 5.2.1. Small and Medium Enterprises
- 5.2.2. Large Enterprises
- 5.3. Market Analysis, Insights and Forecast - by Component
- 5.3.1. Software
- 5.3.2. Services
- 5.4. Market Analysis, Insights and Forecast - by End-user Vertical
- 5.4.1. BFSI
- 5.4.2. Government
- 5.4.3. IT & Telecom
- 5.4.4. Retail and E-commerce
- 5.4.5. Healthcare
- 5.4.6. Other End-user Industries
- 5.5. Market Analysis, Insights and Forecast - by Region
- 5.5.1. North America
- 5.5.2. Europe
- 5.5.3. Asia Pacific
- 5.5.4. Latin America
- 5.5.5. Middle East and Africa
- 5.1. Market Analysis, Insights and Forecast - by Deployment Type
- 6. North America Data Quality Tools Industry Analysis, Insights and Forecast, 2019-2031
- 6.1. Market Analysis, Insights and Forecast - by Deployment Type
- 6.1.1. Cloud-based
- 6.1.2. On Premise
- 6.2. Market Analysis, Insights and Forecast - by Size of the Organization
- 6.2.1. Small and Medium Enterprises
- 6.2.2. Large Enterprises
- 6.3. Market Analysis, Insights and Forecast - by Component
- 6.3.1. Software
- 6.3.2. Services
- 6.4. Market Analysis, Insights and Forecast - by End-user Vertical
- 6.4.1. BFSI
- 6.4.2. Government
- 6.4.3. IT & Telecom
- 6.4.4. Retail and E-commerce
- 6.4.5. Healthcare
- 6.4.6. Other End-user Industries
- 6.1. Market Analysis, Insights and Forecast - by Deployment Type
- 7. Europe Data Quality Tools Industry Analysis, Insights and Forecast, 2019-2031
- 7.1. Market Analysis, Insights and Forecast - by Deployment Type
- 7.1.1. Cloud-based
- 7.1.2. On Premise
- 7.2. Market Analysis, Insights and Forecast - by Size of the Organization
- 7.2.1. Small and Medium Enterprises
- 7.2.2. Large Enterprises
- 7.3. Market Analysis, Insights and Forecast - by Component
- 7.3.1. Software
- 7.3.2. Services
- 7.4. Market Analysis, Insights and Forecast - by End-user Vertical
- 7.4.1. BFSI
- 7.4.2. Government
- 7.4.3. IT & Telecom
- 7.4.4. Retail and E-commerce
- 7.4.5. Healthcare
- 7.4.6. Other End-user Industries
- 7.1. Market Analysis, Insights and Forecast - by Deployment Type
- 8. Asia Pacific Data Quality Tools Industry Analysis, Insights and Forecast, 2019-2031
- 8.1. Market Analysis, Insights and Forecast - by Deployment Type
- 8.1.1. Cloud-based
- 8.1.2. On Premise
- 8.2. Market Analysis, Insights and Forecast - by Size of the Organization
- 8.2.1. Small and Medium Enterprises
- 8.2.2. Large Enterprises
- 8.3. Market Analysis, Insights and Forecast - by Component
- 8.3.1. Software
- 8.3.2. Services
- 8.4. Market Analysis, Insights and Forecast - by End-user Vertical
- 8.4.1. BFSI
- 8.4.2. Government
- 8.4.3. IT & Telecom
- 8.4.4. Retail and E-commerce
- 8.4.5. Healthcare
- 8.4.6. Other End-user Industries
- 8.1. Market Analysis, Insights and Forecast - by Deployment Type
- 9. Latin America Data Quality Tools Industry Analysis, Insights and Forecast, 2019-2031
- 9.1. Market Analysis, Insights and Forecast - by Deployment Type
- 9.1.1. Cloud-based
- 9.1.2. On Premise
- 9.2. Market Analysis, Insights and Forecast - by Size of the Organization
- 9.2.1. Small and Medium Enterprises
- 9.2.2. Large Enterprises
- 9.3. Market Analysis, Insights and Forecast - by Component
- 9.3.1. Software
- 9.3.2. Services
- 9.4. Market Analysis, Insights and Forecast - by End-user Vertical
- 9.4.1. BFSI
- 9.4.2. Government
- 9.4.3. IT & Telecom
- 9.4.4. Retail and E-commerce
- 9.4.5. Healthcare
- 9.4.6. Other End-user Industries
- 9.1. Market Analysis, Insights and Forecast - by Deployment Type
- 10. Middle East and Africa Data Quality Tools Industry Analysis, Insights and Forecast, 2019-2031
- 10.1. Market Analysis, Insights and Forecast - by Deployment Type
- 10.1.1. Cloud-based
- 10.1.2. On Premise
- 10.2. Market Analysis, Insights and Forecast - by Size of the Organization
- 10.2.1. Small and Medium Enterprises
- 10.2.2. Large Enterprises
- 10.3. Market Analysis, Insights and Forecast - by Component
- 10.3.1. Software
- 10.3.2. Services
- 10.4. Market Analysis, Insights and Forecast - by End-user Vertical
- 10.4.1. BFSI
- 10.4.2. Government
- 10.4.3. IT & Telecom
- 10.4.4. Retail and E-commerce
- 10.4.5. Healthcare
- 10.4.6. Other End-user Industries
- 10.1. Market Analysis, Insights and Forecast - by Deployment Type
- 11. North America Data Quality Tools Industry Analysis, Insights and Forecast, 2019-2031
- 11.1. Market Analysis, Insights and Forecast - By Country/Sub-region
- 11.1.1 United States
- 11.1.2 Canada
- 11.1.3 Mexico
- 12. Europe Data Quality Tools Industry Analysis, Insights and Forecast, 2019-2031
- 12.1. Market Analysis, Insights and Forecast - By Country/Sub-region
- 12.1.1 Germany
- 12.1.2 United Kingdom
- 12.1.3 France
- 12.1.4 Spain
- 12.1.5 Italy
- 12.1.6 Spain
- 12.1.7 Belgium
- 12.1.8 Netherland
- 12.1.9 Nordics
- 12.1.10 Rest of Europe
- 13. Asia Pacific Data Quality Tools Industry Analysis, Insights and Forecast, 2019-2031
- 13.1. Market Analysis, Insights and Forecast - By Country/Sub-region
- 13.1.1 China
- 13.1.2 Japan
- 13.1.3 India
- 13.1.4 South Korea
- 13.1.5 Southeast Asia
- 13.1.6 Australia
- 13.1.7 Indonesia
- 13.1.8 Phillipes
- 13.1.9 Singapore
- 13.1.10 Thailandc
- 13.1.11 Rest of Asia Pacific
- 14. South America Data Quality Tools Industry Analysis, Insights and Forecast, 2019-2031
- 14.1. Market Analysis, Insights and Forecast - By Country/Sub-region
- 14.1.1 Brazil
- 14.1.2 Argentina
- 14.1.3 Peru
- 14.1.4 Chile
- 14.1.5 Colombia
- 14.1.6 Ecuador
- 14.1.7 Venezuela
- 14.1.8 Rest of South America
- 15. North America Data Quality Tools Industry Analysis, Insights and Forecast, 2019-2031
- 15.1. Market Analysis, Insights and Forecast - By Country/Sub-region
- 15.1.1 United States
- 15.1.2 Canada
- 15.1.3 Mexico
- 16. MEA Data Quality Tools Industry Analysis, Insights and Forecast, 2019-2031
- 16.1. Market Analysis, Insights and Forecast - By Country/Sub-region
- 16.1.1 United Arab Emirates
- 16.1.2 Saudi Arabia
- 16.1.3 South Africa
- 16.1.4 Rest of Middle East and Africa
- 17. Competitive Analysis
- 17.1. Global Market Share Analysis 2024
- 17.2. Company Profiles
- 17.2.1 SAS Institute Inc
- 17.2.1.1. Overview
- 17.2.1.2. Products
- 17.2.1.3. SWOT Analysis
- 17.2.1.4. Recent Developments
- 17.2.1.5. Financials (Based on Availability)
- 17.2.2 Ataccama Corporatio
- 17.2.2.1. Overview
- 17.2.2.2. Products
- 17.2.2.3. SWOT Analysis
- 17.2.2.4. Recent Developments
- 17.2.2.5. Financials (Based on Availability)
- 17.2.3 Experian PLC
- 17.2.3.1. Overview
- 17.2.3.2. Products
- 17.2.3.3. SWOT Analysis
- 17.2.3.4. Recent Developments
- 17.2.3.5. Financials (Based on Availability)
- 17.2.4 IBM Corporation
- 17.2.4.1. Overview
- 17.2.4.2. Products
- 17.2.4.3. SWOT Analysis
- 17.2.4.4. Recent Developments
- 17.2.4.5. Financials (Based on Availability)
- 17.2.5 Pitney Bowes Inc
- 17.2.5.1. Overview
- 17.2.5.2. Products
- 17.2.5.3. SWOT Analysis
- 17.2.5.4. Recent Developments
- 17.2.5.5. Financials (Based on Availability)
- 17.2.6 Information Builders Inc
- 17.2.6.1. Overview
- 17.2.6.2. Products
- 17.2.6.3. SWOT Analysis
- 17.2.6.4. Recent Developments
- 17.2.6.5. Financials (Based on Availability)
- 17.2.7 Syncsort Inc
- 17.2.7.1. Overview
- 17.2.7.2. Products
- 17.2.7.3. SWOT Analysis
- 17.2.7.4. Recent Developments
- 17.2.7.5. Financials (Based on Availability)
- 17.2.8 Oracle Corporation
- 17.2.8.1. Overview
- 17.2.8.2. Products
- 17.2.8.3. SWOT Analysis
- 17.2.8.4. Recent Developments
- 17.2.8.5. Financials (Based on Availability)
- 17.2.9 Informatica LLC
- 17.2.9.1. Overview
- 17.2.9.2. Products
- 17.2.9.3. SWOT Analysis
- 17.2.9.4. Recent Developments
- 17.2.9.5. Financials (Based on Availability)
- 17.2.10 Talend Inc
- 17.2.10.1. Overview
- 17.2.10.2. Products
- 17.2.10.3. SWOT Analysis
- 17.2.10.4. Recent Developments
- 17.2.10.5. Financials (Based on Availability)
- 17.2.11 SAP SE
- 17.2.11.1. Overview
- 17.2.11.2. Products
- 17.2.11.3. SWOT Analysis
- 17.2.11.4. Recent Developments
- 17.2.11.5. Financials (Based on Availability)
- 17.2.1 SAS Institute Inc
List of Figures
- Figure 1: Global Data Quality Tools Industry Revenue Breakdown (Million, %) by Region 2024 & 2032
- Figure 2: North America Data Quality Tools Industry Revenue (Million), by Country 2024 & 2032
- Figure 3: North America Data Quality Tools Industry Revenue Share (%), by Country 2024 & 2032
- Figure 4: Europe Data Quality Tools Industry Revenue (Million), by Country 2024 & 2032
- Figure 5: Europe Data Quality Tools Industry Revenue Share (%), by Country 2024 & 2032
- Figure 6: Asia Pacific Data Quality Tools Industry Revenue (Million), by Country 2024 & 2032
- Figure 7: Asia Pacific Data Quality Tools Industry Revenue Share (%), by Country 2024 & 2032
- Figure 8: South America Data Quality Tools Industry Revenue (Million), by Country 2024 & 2032
- Figure 9: South America Data Quality Tools Industry Revenue Share (%), by Country 2024 & 2032
- Figure 10: North America Data Quality Tools Industry Revenue (Million), by Country 2024 & 2032
- Figure 11: North America Data Quality Tools Industry Revenue Share (%), by Country 2024 & 2032
- Figure 12: MEA Data Quality Tools Industry Revenue (Million), by Country 2024 & 2032
- Figure 13: MEA Data Quality Tools Industry Revenue Share (%), by Country 2024 & 2032
- Figure 14: North America Data Quality Tools Industry Revenue (Million), by Deployment Type 2024 & 2032
- Figure 15: North America Data Quality Tools Industry Revenue Share (%), by Deployment Type 2024 & 2032
- Figure 16: North America Data Quality Tools Industry Revenue (Million), by Size of the Organization 2024 & 2032
- Figure 17: North America Data Quality Tools Industry Revenue Share (%), by Size of the Organization 2024 & 2032
- Figure 18: North America Data Quality Tools Industry Revenue (Million), by Component 2024 & 2032
- Figure 19: North America Data Quality Tools Industry Revenue Share (%), by Component 2024 & 2032
- Figure 20: North America Data Quality Tools Industry Revenue (Million), by End-user Vertical 2024 & 2032
- Figure 21: North America Data Quality Tools Industry Revenue Share (%), by End-user Vertical 2024 & 2032
- Figure 22: North America Data Quality Tools Industry Revenue (Million), by Country 2024 & 2032
- Figure 23: North America Data Quality Tools Industry Revenue Share (%), by Country 2024 & 2032
- Figure 24: Europe Data Quality Tools Industry Revenue (Million), by Deployment Type 2024 & 2032
- Figure 25: Europe Data Quality Tools Industry Revenue Share (%), by Deployment Type 2024 & 2032
- Figure 26: Europe Data Quality Tools Industry Revenue (Million), by Size of the Organization 2024 & 2032
- Figure 27: Europe Data Quality Tools Industry Revenue Share (%), by Size of the Organization 2024 & 2032
- Figure 28: Europe Data Quality Tools Industry Revenue (Million), by Component 2024 & 2032
- Figure 29: Europe Data Quality Tools Industry Revenue Share (%), by Component 2024 & 2032
- Figure 30: Europe Data Quality Tools Industry Revenue (Million), by End-user Vertical 2024 & 2032
- Figure 31: Europe Data Quality Tools Industry Revenue Share (%), by End-user Vertical 2024 & 2032
- Figure 32: Europe Data Quality Tools Industry Revenue (Million), by Country 2024 & 2032
- Figure 33: Europe Data Quality Tools Industry Revenue Share (%), by Country 2024 & 2032
- Figure 34: Asia Pacific Data Quality Tools Industry Revenue (Million), by Deployment Type 2024 & 2032
- Figure 35: Asia Pacific Data Quality Tools Industry Revenue Share (%), by Deployment Type 2024 & 2032
- Figure 36: Asia Pacific Data Quality Tools Industry Revenue (Million), by Size of the Organization 2024 & 2032
- Figure 37: Asia Pacific Data Quality Tools Industry Revenue Share (%), by Size of the Organization 2024 & 2032
- Figure 38: Asia Pacific Data Quality Tools Industry Revenue (Million), by Component 2024 & 2032
- Figure 39: Asia Pacific Data Quality Tools Industry Revenue Share (%), by Component 2024 & 2032
- Figure 40: Asia Pacific Data Quality Tools Industry Revenue (Million), by End-user Vertical 2024 & 2032
- Figure 41: Asia Pacific Data Quality Tools Industry Revenue Share (%), by End-user Vertical 2024 & 2032
- Figure 42: Asia Pacific Data Quality Tools Industry Revenue (Million), by Country 2024 & 2032
- Figure 43: Asia Pacific Data Quality Tools Industry Revenue Share (%), by Country 2024 & 2032
- Figure 44: Latin America Data Quality Tools Industry Revenue (Million), by Deployment Type 2024 & 2032
- Figure 45: Latin America Data Quality Tools Industry Revenue Share (%), by Deployment Type 2024 & 2032
- Figure 46: Latin America Data Quality Tools Industry Revenue (Million), by Size of the Organization 2024 & 2032
- Figure 47: Latin America Data Quality Tools Industry Revenue Share (%), by Size of the Organization 2024 & 2032
- Figure 48: Latin America Data Quality Tools Industry Revenue (Million), by Component 2024 & 2032
- Figure 49: Latin America Data Quality Tools Industry Revenue Share (%), by Component 2024 & 2032
- Figure 50: Latin America Data Quality Tools Industry Revenue (Million), by End-user Vertical 2024 & 2032
- Figure 51: Latin America Data Quality Tools Industry Revenue Share (%), by End-user Vertical 2024 & 2032
- Figure 52: Latin America Data Quality Tools Industry Revenue (Million), by Country 2024 & 2032
- Figure 53: Latin America Data Quality Tools Industry Revenue Share (%), by Country 2024 & 2032
- Figure 54: Middle East and Africa Data Quality Tools Industry Revenue (Million), by Deployment Type 2024 & 2032
- Figure 55: Middle East and Africa Data Quality Tools Industry Revenue Share (%), by Deployment Type 2024 & 2032
- Figure 56: Middle East and Africa Data Quality Tools Industry Revenue (Million), by Size of the Organization 2024 & 2032
- Figure 57: Middle East and Africa Data Quality Tools Industry Revenue Share (%), by Size of the Organization 2024 & 2032
- Figure 58: Middle East and Africa Data Quality Tools Industry Revenue (Million), by Component 2024 & 2032
- Figure 59: Middle East and Africa Data Quality Tools Industry Revenue Share (%), by Component 2024 & 2032
- Figure 60: Middle East and Africa Data Quality Tools Industry Revenue (Million), by End-user Vertical 2024 & 2032
- Figure 61: Middle East and Africa Data Quality Tools Industry Revenue Share (%), by End-user Vertical 2024 & 2032
- Figure 62: Middle East and Africa Data Quality Tools Industry Revenue (Million), by Country 2024 & 2032
- Figure 63: Middle East and Africa Data Quality Tools Industry Revenue Share (%), by Country 2024 & 2032
List of Tables
- Table 1: Global Data Quality Tools Industry Revenue Million Forecast, by Region 2019 & 2032
- Table 2: Global Data Quality Tools Industry Revenue Million Forecast, by Deployment Type 2019 & 2032
- Table 3: Global Data Quality Tools Industry Revenue Million Forecast, by Size of the Organization 2019 & 2032
- Table 4: Global Data Quality Tools Industry Revenue Million Forecast, by Component 2019 & 2032
- Table 5: Global Data Quality Tools Industry Revenue Million Forecast, by End-user Vertical 2019 & 2032
- Table 6: Global Data Quality Tools Industry Revenue Million Forecast, by Region 2019 & 2032
- Table 7: Global Data Quality Tools Industry Revenue Million Forecast, by Country 2019 & 2032
- Table 8: United States Data Quality Tools Industry Revenue (Million) Forecast, by Application 2019 & 2032
- Table 9: Canada Data Quality Tools Industry Revenue (Million) Forecast, by Application 2019 & 2032
- Table 10: Mexico Data Quality Tools Industry Revenue (Million) Forecast, by Application 2019 & 2032
- Table 11: Global Data Quality Tools Industry Revenue Million Forecast, by Country 2019 & 2032
- Table 12: Germany Data Quality Tools Industry Revenue (Million) Forecast, by Application 2019 & 2032
- Table 13: United Kingdom Data Quality Tools Industry Revenue (Million) Forecast, by Application 2019 & 2032
- Table 14: France Data Quality Tools Industry Revenue (Million) Forecast, by Application 2019 & 2032
- Table 15: Spain Data Quality Tools Industry Revenue (Million) Forecast, by Application 2019 & 2032
- Table 16: Italy Data Quality Tools Industry Revenue (Million) Forecast, by Application 2019 & 2032
- Table 17: Spain Data Quality Tools Industry Revenue (Million) Forecast, by Application 2019 & 2032
- Table 18: Belgium Data Quality Tools Industry Revenue (Million) Forecast, by Application 2019 & 2032
- Table 19: Netherland Data Quality Tools Industry Revenue (Million) Forecast, by Application 2019 & 2032
- Table 20: Nordics Data Quality Tools Industry Revenue (Million) Forecast, by Application 2019 & 2032
- Table 21: Rest of Europe Data Quality Tools Industry Revenue (Million) Forecast, by Application 2019 & 2032
- Table 22: Global Data Quality Tools Industry Revenue Million Forecast, by Country 2019 & 2032
- Table 23: China Data Quality Tools Industry Revenue (Million) Forecast, by Application 2019 & 2032
- Table 24: Japan Data Quality Tools Industry Revenue (Million) Forecast, by Application 2019 & 2032
- Table 25: India Data Quality Tools Industry Revenue (Million) Forecast, by Application 2019 & 2032
- Table 26: South Korea Data Quality Tools Industry Revenue (Million) Forecast, by Application 2019 & 2032
- Table 27: Southeast Asia Data Quality Tools Industry Revenue (Million) Forecast, by Application 2019 & 2032
- Table 28: Australia Data Quality Tools Industry Revenue (Million) Forecast, by Application 2019 & 2032
- Table 29: Indonesia Data Quality Tools Industry Revenue (Million) Forecast, by Application 2019 & 2032
- Table 30: Phillipes Data Quality Tools Industry Revenue (Million) Forecast, by Application 2019 & 2032
- Table 31: Singapore Data Quality Tools Industry Revenue (Million) Forecast, by Application 2019 & 2032
- Table 32: Thailandc Data Quality Tools Industry Revenue (Million) Forecast, by Application 2019 & 2032
- Table 33: Rest of Asia Pacific Data Quality Tools Industry Revenue (Million) Forecast, by Application 2019 & 2032
- Table 34: Global Data Quality Tools Industry Revenue Million Forecast, by Country 2019 & 2032
- Table 35: Brazil Data Quality Tools Industry Revenue (Million) Forecast, by Application 2019 & 2032
- Table 36: Argentina Data Quality Tools Industry Revenue (Million) Forecast, by Application 2019 & 2032
- Table 37: Peru Data Quality Tools Industry Revenue (Million) Forecast, by Application 2019 & 2032
- Table 38: Chile Data Quality Tools Industry Revenue (Million) Forecast, by Application 2019 & 2032
- Table 39: Colombia Data Quality Tools Industry Revenue (Million) Forecast, by Application 2019 & 2032
- Table 40: Ecuador Data Quality Tools Industry Revenue (Million) Forecast, by Application 2019 & 2032
- Table 41: Venezuela Data Quality Tools Industry Revenue (Million) Forecast, by Application 2019 & 2032
- Table 42: Rest of South America Data Quality Tools Industry Revenue (Million) Forecast, by Application 2019 & 2032
- Table 43: Global Data Quality Tools Industry Revenue Million Forecast, by Country 2019 & 2032
- Table 44: United States Data Quality Tools Industry Revenue (Million) Forecast, by Application 2019 & 2032
- Table 45: Canada Data Quality Tools Industry Revenue (Million) Forecast, by Application 2019 & 2032
- Table 46: Mexico Data Quality Tools Industry Revenue (Million) Forecast, by Application 2019 & 2032
- Table 47: Global Data Quality Tools Industry Revenue Million Forecast, by Country 2019 & 2032
- Table 48: United Arab Emirates Data Quality Tools Industry Revenue (Million) Forecast, by Application 2019 & 2032
- Table 49: Saudi Arabia Data Quality Tools Industry Revenue (Million) Forecast, by Application 2019 & 2032
- Table 50: South Africa Data Quality Tools Industry Revenue (Million) Forecast, by Application 2019 & 2032
- Table 51: Rest of Middle East and Africa Data Quality Tools Industry Revenue (Million) Forecast, by Application 2019 & 2032
- Table 52: Global Data Quality Tools Industry Revenue Million Forecast, by Deployment Type 2019 & 2032
- Table 53: Global Data Quality Tools Industry Revenue Million Forecast, by Size of the Organization 2019 & 2032
- Table 54: Global Data Quality Tools Industry Revenue Million Forecast, by Component 2019 & 2032
- Table 55: Global Data Quality Tools Industry Revenue Million Forecast, by End-user Vertical 2019 & 2032
- Table 56: Global Data Quality Tools Industry Revenue Million Forecast, by Country 2019 & 2032
- Table 57: Global Data Quality Tools Industry Revenue Million Forecast, by Deployment Type 2019 & 2032
- Table 58: Global Data Quality Tools Industry Revenue Million Forecast, by Size of the Organization 2019 & 2032
- Table 59: Global Data Quality Tools Industry Revenue Million Forecast, by Component 2019 & 2032
- Table 60: Global Data Quality Tools Industry Revenue Million Forecast, by End-user Vertical 2019 & 2032
- Table 61: Global Data Quality Tools Industry Revenue Million Forecast, by Country 2019 & 2032
- Table 62: Global Data Quality Tools Industry Revenue Million Forecast, by Deployment Type 2019 & 2032
- Table 63: Global Data Quality Tools Industry Revenue Million Forecast, by Size of the Organization 2019 & 2032
- Table 64: Global Data Quality Tools Industry Revenue Million Forecast, by Component 2019 & 2032
- Table 65: Global Data Quality Tools Industry Revenue Million Forecast, by End-user Vertical 2019 & 2032
- Table 66: Global Data Quality Tools Industry Revenue Million Forecast, by Country 2019 & 2032
- Table 67: Global Data Quality Tools Industry Revenue Million Forecast, by Deployment Type 2019 & 2032
- Table 68: Global Data Quality Tools Industry Revenue Million Forecast, by Size of the Organization 2019 & 2032
- Table 69: Global Data Quality Tools Industry Revenue Million Forecast, by Component 2019 & 2032
- Table 70: Global Data Quality Tools Industry Revenue Million Forecast, by End-user Vertical 2019 & 2032
- Table 71: Global Data Quality Tools Industry Revenue Million Forecast, by Country 2019 & 2032
- Table 72: Global Data Quality Tools Industry Revenue Million Forecast, by Deployment Type 2019 & 2032
- Table 73: Global Data Quality Tools Industry Revenue Million Forecast, by Size of the Organization 2019 & 2032
- Table 74: Global Data Quality Tools Industry Revenue Million Forecast, by Component 2019 & 2032
- Table 75: Global Data Quality Tools Industry Revenue Million Forecast, by End-user Vertical 2019 & 2032
- Table 76: Global Data Quality Tools Industry Revenue Million Forecast, by Country 2019 & 2032
Frequently Asked Questions
1. What is the projected Compound Annual Growth Rate (CAGR) of the Data Quality Tools Industry?
The projected CAGR is approximately 17.50%.
2. Which companies are prominent players in the Data Quality Tools Industry?
Key companies in the market include SAS Institute Inc, Ataccama Corporatio, Experian PLC, IBM Corporation, Pitney Bowes Inc, Information Builders Inc, Syncsort Inc, Oracle Corporation, Informatica LLC, Talend Inc, SAP SE.
3. What are the main segments of the Data Quality Tools Industry?
The market segments include Deployment Type, Size of the Organization, Component, End-user Vertical.
4. Can you provide details about the market size?
The market size is estimated to be USD XX Million as of 2022.
5. What are some drivers contributing to market growth?
Increasing Use of External Data Sources Owing to Mobile Connectivity Growth.
6. What are the notable trends driving market growth?
Healthcare is Expected to Witness Significant Growth.
7. Are there any restraints impacting market growth?
Lack of information and Awareness about the Solutions Among Potential Users.
8. Can you provide examples of recent developments in the market?
September 2022: MIT Computer Science and Artificial Intelligence Laboratory (CSAIL) spin-off DataCebo announced the launch of a new tool, dubbed Synthetic Data (SD) Metrics, to help enterprises compare the quality of machine-generated synthetic data by pitching it against real data sets.
9. What pricing options are available for accessing the report?
Pricing options include single-user, multi-user, and enterprise licenses priced at USD 4750, USD 5250, and USD 8750 respectively.
10. Is the market size provided in terms of value or volume?
The market size is provided in terms of value, measured in Million.
11. Are there any specific market keywords associated with the report?
Yes, the market keyword associated with the report is "Data Quality Tools Industry," which aids in identifying and referencing the specific market segment covered.
12. How do I determine which pricing option suits my needs best?
The pricing options vary based on user requirements and access needs. Individual users may opt for single-user licenses, while businesses requiring broader access may choose multi-user or enterprise licenses for cost-effective access to the report.
13. Are there any additional resources or data provided in the Data Quality Tools Industry report?
While the report offers comprehensive insights, it's advisable to review the specific contents or supplementary materials provided to ascertain if additional resources or data are available.
14. How can I stay updated on further developments or reports in the Data Quality Tools Industry?
To stay informed about further developments, trends, and reports in the Data Quality Tools Industry, consider subscribing to industry newsletters, following relevant companies and organizations, or regularly checking reputable industry news sources and publications.
Methodology
Step 1 - Identification of Relevant Samples Size from Population Database


Step 2 - Approaches for Defining Global Market Size (Value, Volume* & Price*)

Note*: In applicable scenarios
Step 3 - Data Sources
Primary Research
- Web Analytics
- Survey Reports
- Research Institute
- Latest Research Reports
- Opinion Leaders
Secondary Research
- Annual Reports
- White Paper
- Latest Press Release
- Industry Association
- Paid Database
- Investor Presentations

Step 4 - Data Triangulation
Involves using different sources of information in order to increase the validity of a study
These sources are likely to be stakeholders in a program - participants, other researchers, program staff, other community members, and so on.
Then we put all data in single framework & apply various statistical tools to find out the dynamic on the market.
During the analysis stage, feedback from the stakeholder groups would be compared to determine areas of agreement as well as areas of divergence


