


Key Insights
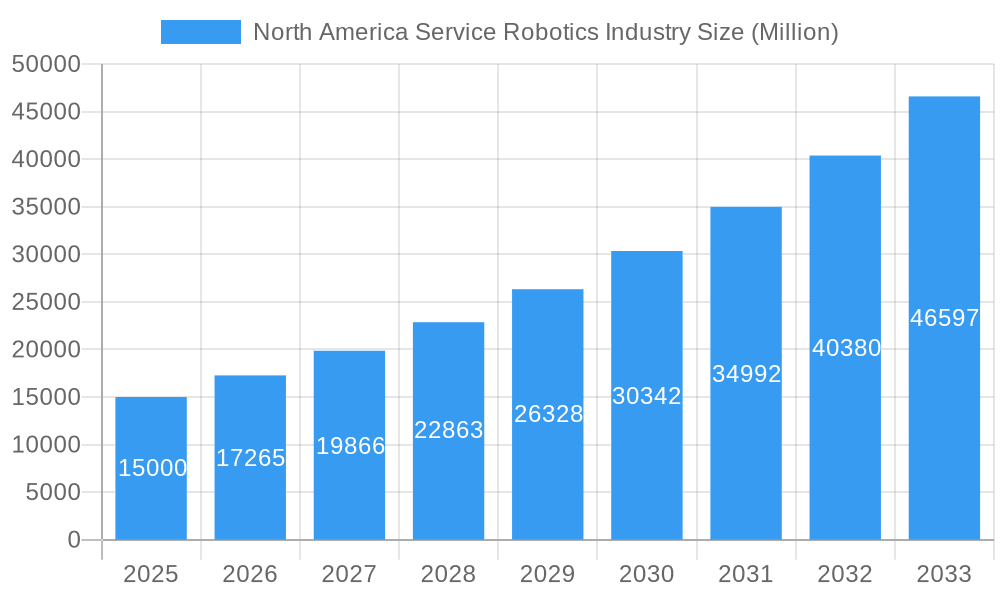
The North American service robotics industry is experiencing robust growth, projected to maintain a Compound Annual Growth Rate (CAGR) of 15.10% from 2025 to 2033. This expansion is driven by several key factors. Increased automation needs across sectors like healthcare (particularly in elderly care and surgical assistance), logistics (warehouse automation and delivery robots), and agriculture (precision farming and crop monitoring) are significantly boosting demand. Furthermore, advancements in artificial intelligence (AI), machine learning (ML), and sensor technologies are enabling the development of more sophisticated and versatile robots capable of performing complex tasks with greater autonomy. The rising labor costs and the need for improved efficiency in various industries are also contributing to the market's growth. Within North America, the United States is the dominant market, owing to significant investments in R&D, a robust technological infrastructure, and a high concentration of major robotics companies. Canada, while smaller in market size, is experiencing consistent growth fueled by government initiatives promoting technological advancement and automation. The market segmentation reveals a strong preference for personal robots in the consumer sector, driven by increasing adoption of smart home devices and companion robots. Professional robots, however, dominate the market in terms of value due to high deployment costs and application in large-scale operations across diverse industries. Specific growth areas within professional segments include aerial robots for surveillance and inspection and underwater robots for exploration and maintenance.
North America Service Robotics Industry Market Size (In Billion)

The competitive landscape is marked by a mix of established players like iRobot, KUKA, and Northrop Grumman alongside emerging innovative companies focusing on niche applications. While the market faces restraints like high initial investment costs and concerns regarding job displacement, the long-term benefits of improved efficiency, increased productivity, and enhanced safety outweigh these challenges. The ongoing technological advancements and increasing government support for robotics research and development are expected to further accelerate market growth throughout the forecast period. The future growth trajectory hinges on continued innovation, particularly in areas like AI-powered decision-making, improved human-robot interaction, and enhanced safety features. Further development of supportive regulatory frameworks can further unlock the full potential of service robotics in North America.
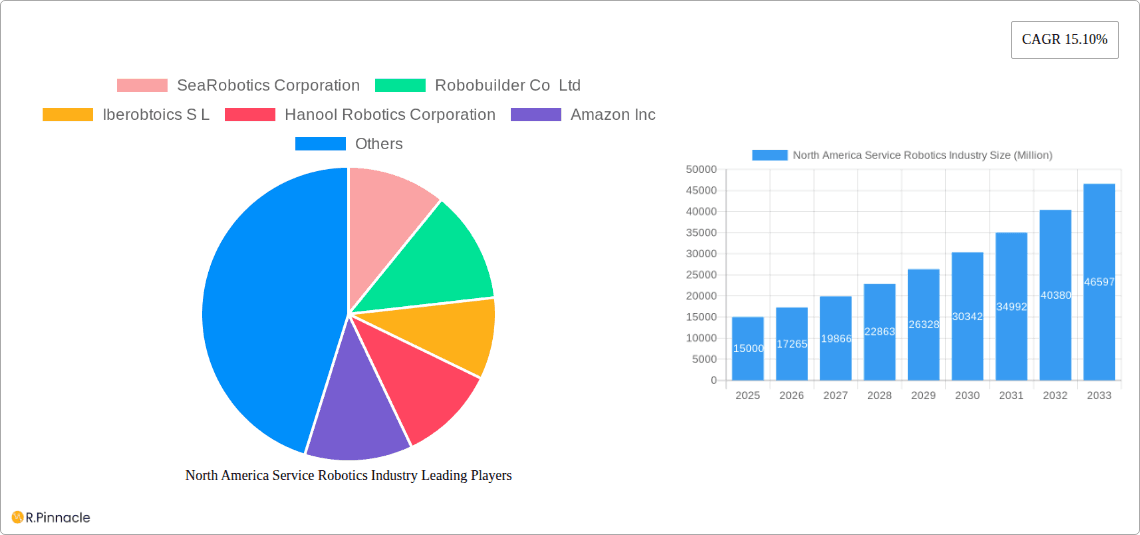
North America Service Robotics Industry Company Market Share
North America Service Robotics Industry: 2019-2033 Market Report
This comprehensive report provides an in-depth analysis of the North American service robotics industry, offering valuable insights for industry professionals, investors, and strategic decision-makers. The study period covers 2019-2033, with 2025 as the base and estimated year, and a forecast period of 2025-2033. Historical data from 2019-2024 is also included. The report segments the market by robot type (Personal and Professional), area of operation (Aerial, Land, Underwater), components (Sensors, Actuators, Control Systems, Software, Others), end-user industries (Military & Defense, Agriculture, Construction & Mining, Transportation & Logistics, Healthcare, Government, Others), and country (United States, Canada). Key players like SeaRobotics Corporation, Robobuilder Co Ltd, Iberobtoics S L, Hanool Robotics Corporation, Amazon Inc, RedZone Robotics, KUKA AG, Gecko Systems Corporation, iRobot Corporation, Honda Motors Co Ltd, and Northrop Grumman Corporation are analyzed. The report projects a market value of xx Million by 2033.
North America Service Robotics Industry Market Structure & Innovation Trends
The North American service robotics market is characterized by a moderate level of concentration, with a few large players dominating specific segments. Market share data for 2025 suggests that Amazon Inc and iRobot Corporation hold significant positions in the personal robotics segment, while KUKA AG and Northrop Grumman Corporation are prominent in the professional robotics sector. Innovation is driven by advancements in AI, machine learning, and sensor technologies, leading to the development of more sophisticated and autonomous robots. Regulatory frameworks, while still evolving, are increasingly focused on safety and data privacy. Product substitutes include traditional labor and specialized equipment, but robotic solutions often offer increased efficiency and cost savings. The market has seen a moderate level of M&A activity in recent years, with deal values ranging from xx Million to xx Million. End-user demographics are diverse, with increasing adoption across various sectors.
- Market Concentration: Moderately concentrated, with some large players dominating specific segments.
- Innovation Drivers: AI, machine learning, sensor technologies.
- Regulatory Frameworks: Evolving, focusing on safety and data privacy.
- M&A Activity: Moderate, with deal values ranging from xx Million to xx Million.
North America Service Robotics Industry Market Dynamics & Trends
The North American service robotics market is experiencing robust growth, driven by increasing demand for automation across various sectors. The Compound Annual Growth Rate (CAGR) is projected to be xx% from 2025 to 2033. Technological advancements, particularly in AI and robotics, are fueling innovation and expanding the capabilities of service robots. Consumer preferences are shifting towards more convenient, efficient, and user-friendly robotic solutions. Competitive dynamics are intense, with established players and emerging startups vying for market share. Market penetration varies significantly across segments and end-user industries. The healthcare and logistics sectors are showing particularly strong growth.
Dominant Regions & Segments in North America Service Robotics Industry
The United States dominates the North American service robotics market, driven by a larger market size, robust technological infrastructure, and a higher level of automation adoption across various industries.
- United States: Strong technological infrastructure, high adoption of automation.
- Canada: Growing market, driven by government initiatives and technological advancements.
- Dominant Segments:
- Professional Robots: High demand in healthcare and logistics.
- Land-based Robots: Wide range of applications across various industries.
- Sensors and Actuators: Core components driving innovation and improvements.
The significant market size and growth potential are due to factors like increasing labor costs, growing demand for efficiency, and advancements in artificial intelligence. Government initiatives promoting automation and technological investments are also strong drivers.
North America Service Robotics Industry Product Innovations
Recent innovations include robots equipped with advanced AI capabilities, enabling greater autonomy and task adaptability. The market is seeing a rise in collaborative robots (cobots) designed to work alongside humans. New applications are emerging constantly, expanding the range of tasks robots can perform. These innovations offer significant competitive advantages, driving efficiency gains and reducing operational costs. Emphasis is placed on user-friendly interfaces and intuitive control systems, driving wider adoption.
Report Scope & Segmentation Analysis
This report covers the entire North American service robotics market, segmented by robot type (Personal and Professional), area of operation (Aerial, Land, Underwater), components (Sensors, Actuators, Control Systems, Software, Others), end-user industries (Military & Defense, Agriculture, Construction & Mining, Transportation & Logistics, Healthcare, Government, Others), and country (United States, Canada). Each segment's growth projections, market sizes, and competitive dynamics are analyzed in detail, offering a comprehensive view of the market landscape. For instance, the professional robotics segment is projected to experience higher growth than the personal robotics segment due to increased demand in logistics and healthcare.
Key Drivers of North America Service Robotics Industry Growth
Technological advancements, particularly in AI, machine learning, and sensor technologies, are key drivers. Economic factors, such as increasing labor costs and the need for efficiency gains, are also propelling growth. Government support through funding initiatives and regulatory frameworks that promote innovation and automation contribute significantly. The increasing adoption of robots in sectors like healthcare and logistics, due to improved efficiency and cost reduction, further fuels growth.
Challenges in the North America Service Robotics Industry Sector
High initial investment costs can be a barrier to entry for some companies. Supply chain disruptions can impact the availability of crucial components. Intense competition among established players and emerging startups poses a challenge. Regulatory hurdles related to safety and data privacy can hinder growth. Skilled labor shortages in robotics engineering and maintenance present another limitation.
Emerging Opportunities in North America Service Robotics Industry
The integration of robotics with other technologies, like IoT and cloud computing, presents new opportunities. Expansion into underserved markets, like agriculture and construction, is gaining momentum. The increasing demand for specialized robots tailored to specific industry needs creates opportunities for niche players. Growing consumer awareness and acceptance of service robots open up new markets.
Leading Players in the North America Service Robotics Industry Market
- SeaRobotics Corporation
- Robobuilder Co Ltd
- Iberobtoics S L
- Hanool Robotics Corporation
- Amazon Inc
- RedZone Robotics
- KUKA AG
- Gecko Systems Corporation
- iRobot Corporation
- Honda Motors Co Ltd
- Northrop Grumman Corporation
Key Developments in North America Service Robotics Industry Industry
- August 2021: Canadian AI tech start-up Tiny Mile leverages Bell 5G for food delivery robots in Toronto. This highlights the role of 5G infrastructure in enabling wider adoption of service robots.
- December 2020: LG Electronics launches UV disinfection robot, expanding the application of autonomous mobile robots in healthcare settings. This signifies a growing trend towards automation in sanitation and hygiene.
Future Outlook for North America Service Robotics Industry Market
The North American service robotics market is poised for continued growth, driven by technological advancements and increasing demand across various sectors. Strategic partnerships and collaborations are expected to play a significant role in driving innovation and expansion. The focus on developing more intelligent, adaptable, and user-friendly robots will further fuel market growth, creating lucrative opportunities for established players and new entrants.
North America Service Robotics Industry Segmentation
-
1. Type
- 1.1. Personal Robots
- 1.2. Professional Robots
-
2. Areas
- 2.1. Aerial
- 2.2. Land
- 2.3. Underwater
-
3. Components
- 3.1. Sensors
- 3.2. Actuators
- 3.3. Control Systems
- 3.4. Software
- 3.5. Others
-
4. End-User industries
- 4.1. Military and Defense
- 4.2. Agriculture, Construction and Mining
- 4.3. Transportation & Logistics
- 4.4. Healthcare
- 4.5. Government
- 4.6. Others
-
5. Countries
- 5.1. United States
- 5.2. Canada
North America Service Robotics Industry Segmentation By Geography
-
1. North America
- 1.1. United States
- 1.2. Canada
- 1.3. Mexico
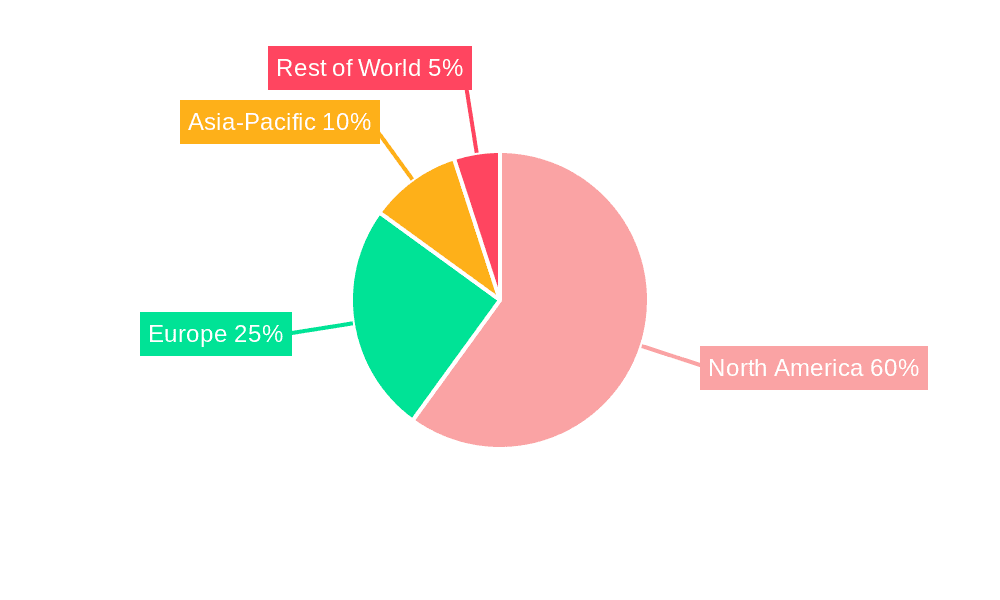
North America Service Robotics Industry Regional Market Share
Geographic Coverage of North America Service Robotics Industry
North America Service Robotics Industry REPORT HIGHLIGHTS
| Aspects | Details |
|---|---|
| Study Period | 2020-2034 |
| Base Year | 2025 |
| Estimated Year | 2026 |
| Forecast Period | 2026-2034 |
| Historical Period | 2020-2025 |
| Growth Rate | CAGR of 8.91% from 2020-2034 |
| Segmentation |
|
Table of Contents
- 1. Introduction
- 1.1. Research Scope
- 1.2. Market Segmentation
- 1.3. Research Methodology
- 1.4. Definitions and Assumptions
- 2. Executive Summary
- 2.1. Introduction
- 3. Market Dynamics
- 3.1. Introduction
- 3.2. Market Drivers
- 3.2.1. Increasing demand for these robots in defense sector; Focus towards research and development is leading to robots with more user-friendly features
- 3.3. Market Restrains
- 3.3.1. Interaction with robot is hindrance for some users; Initial high costs associated with development
- 3.4. Market Trends
- 3.4.1. The Growing Demand of Service Robots in Healthcare Sector Aids in Market Growth
- 4. Market Factor Analysis
- 4.1. Porters Five Forces
- 4.2. Supply/Value Chain
- 4.3. PESTEL analysis
- 4.4. Market Entropy
- 4.5. Patent/Trademark Analysis
- 5. North America Service Robotics Industry Analysis, Insights and Forecast, 2020-2032
- 5.1. Market Analysis, Insights and Forecast - by Type
- 5.1.1. Personal Robots
- 5.1.2. Professional Robots
- 5.2. Market Analysis, Insights and Forecast - by Areas
- 5.2.1. Aerial
- 5.2.2. Land
- 5.2.3. Underwater
- 5.3. Market Analysis, Insights and Forecast - by Components
- 5.3.1. Sensors
- 5.3.2. Actuators
- 5.3.3. Control Systems
- 5.3.4. Software
- 5.3.5. Others
- 5.4. Market Analysis, Insights and Forecast - by End-User industries
- 5.4.1. Military and Defense
- 5.4.2. Agriculture, Construction and Mining
- 5.4.3. Transportation & Logistics
- 5.4.4. Healthcare
- 5.4.5. Government
- 5.4.6. Others
- 5.5. Market Analysis, Insights and Forecast - by Countries
- 5.5.1. United States
- 5.5.2. Canada
- 5.6. Market Analysis, Insights and Forecast - by Region
- 5.6.1. North America
- 5.1. Market Analysis, Insights and Forecast - by Type
- 6. Competitive Analysis
- 6.1. Market Share Analysis 2025
- 6.2. Company Profiles
- 6.2.1 SeaRobotics Corporation
- 6.2.1.1. Overview
- 6.2.1.2. Products
- 6.2.1.3. SWOT Analysis
- 6.2.1.4. Recent Developments
- 6.2.1.5. Financials (Based on Availability)
- 6.2.2 Robobuilder Co Ltd
- 6.2.2.1. Overview
- 6.2.2.2. Products
- 6.2.2.3. SWOT Analysis
- 6.2.2.4. Recent Developments
- 6.2.2.5. Financials (Based on Availability)
- 6.2.3 Iberobtoics S L
- 6.2.3.1. Overview
- 6.2.3.2. Products
- 6.2.3.3. SWOT Analysis
- 6.2.3.4. Recent Developments
- 6.2.3.5. Financials (Based on Availability)
- 6.2.4 Hanool Robotics Corporation
- 6.2.4.1. Overview
- 6.2.4.2. Products
- 6.2.4.3. SWOT Analysis
- 6.2.4.4. Recent Developments
- 6.2.4.5. Financials (Based on Availability)
- 6.2.5 Amazon Inc
- 6.2.5.1. Overview
- 6.2.5.2. Products
- 6.2.5.3. SWOT Analysis
- 6.2.5.4. Recent Developments
- 6.2.5.5. Financials (Based on Availability)
- 6.2.6 RedZone Robotics
- 6.2.6.1. Overview
- 6.2.6.2. Products
- 6.2.6.3. SWOT Analysis
- 6.2.6.4. Recent Developments
- 6.2.6.5. Financials (Based on Availability)
- 6.2.7 KUKA AG
- 6.2.7.1. Overview
- 6.2.7.2. Products
- 6.2.7.3. SWOT Analysis
- 6.2.7.4. Recent Developments
- 6.2.7.5. Financials (Based on Availability)
- 6.2.8 Gecko Systems Corporation
- 6.2.8.1. Overview
- 6.2.8.2. Products
- 6.2.8.3. SWOT Analysis
- 6.2.8.4. Recent Developments
- 6.2.8.5. Financials (Based on Availability)
- 6.2.9 iRobot Corporation
- 6.2.9.1. Overview
- 6.2.9.2. Products
- 6.2.9.3. SWOT Analysis
- 6.2.9.4. Recent Developments
- 6.2.9.5. Financials (Based on Availability)
- 6.2.10 Honda Motors Co Ltd
- 6.2.10.1. Overview
- 6.2.10.2. Products
- 6.2.10.3. SWOT Analysis
- 6.2.10.4. Recent Developments
- 6.2.10.5. Financials (Based on Availability)
- 6.2.11 Northrop Grumman Corporation
- 6.2.11.1. Overview
- 6.2.11.2. Products
- 6.2.11.3. SWOT Analysis
- 6.2.11.4. Recent Developments
- 6.2.11.5. Financials (Based on Availability)
- 6.2.1 SeaRobotics Corporation
List of Figures
- Figure 1: North America Service Robotics Industry Revenue Breakdown (undefined, %) by Product 2025 & 2033
- Figure 2: North America Service Robotics Industry Share (%) by Company 2025
List of Tables
- Table 1: North America Service Robotics Industry Revenue undefined Forecast, by Type 2020 & 2033
- Table 2: North America Service Robotics Industry Volume K Unit Forecast, by Type 2020 & 2033
- Table 3: North America Service Robotics Industry Revenue undefined Forecast, by Areas 2020 & 2033
- Table 4: North America Service Robotics Industry Volume K Unit Forecast, by Areas 2020 & 2033
- Table 5: North America Service Robotics Industry Revenue undefined Forecast, by Components 2020 & 2033
- Table 6: North America Service Robotics Industry Volume K Unit Forecast, by Components 2020 & 2033
- Table 7: North America Service Robotics Industry Revenue undefined Forecast, by End-User industries 2020 & 2033
- Table 8: North America Service Robotics Industry Volume K Unit Forecast, by End-User industries 2020 & 2033
- Table 9: North America Service Robotics Industry Revenue undefined Forecast, by Countries 2020 & 2033
- Table 10: North America Service Robotics Industry Volume K Unit Forecast, by Countries 2020 & 2033
- Table 11: North America Service Robotics Industry Revenue undefined Forecast, by Region 2020 & 2033
- Table 12: North America Service Robotics Industry Volume K Unit Forecast, by Region 2020 & 2033
- Table 13: North America Service Robotics Industry Revenue undefined Forecast, by Type 2020 & 2033
- Table 14: North America Service Robotics Industry Volume K Unit Forecast, by Type 2020 & 2033
- Table 15: North America Service Robotics Industry Revenue undefined Forecast, by Areas 2020 & 2033
- Table 16: North America Service Robotics Industry Volume K Unit Forecast, by Areas 2020 & 2033
- Table 17: North America Service Robotics Industry Revenue undefined Forecast, by Components 2020 & 2033
- Table 18: North America Service Robotics Industry Volume K Unit Forecast, by Components 2020 & 2033
- Table 19: North America Service Robotics Industry Revenue undefined Forecast, by End-User industries 2020 & 2033
- Table 20: North America Service Robotics Industry Volume K Unit Forecast, by End-User industries 2020 & 2033
- Table 21: North America Service Robotics Industry Revenue undefined Forecast, by Countries 2020 & 2033
- Table 22: North America Service Robotics Industry Volume K Unit Forecast, by Countries 2020 & 2033
- Table 23: North America Service Robotics Industry Revenue undefined Forecast, by Country 2020 & 2033
- Table 24: North America Service Robotics Industry Volume K Unit Forecast, by Country 2020 & 2033
- Table 25: United States North America Service Robotics Industry Revenue (undefined) Forecast, by Application 2020 & 2033
- Table 26: United States North America Service Robotics Industry Volume (K Unit) Forecast, by Application 2020 & 2033
- Table 27: Canada North America Service Robotics Industry Revenue (undefined) Forecast, by Application 2020 & 2033
- Table 28: Canada North America Service Robotics Industry Volume (K Unit) Forecast, by Application 2020 & 2033
- Table 29: Mexico North America Service Robotics Industry Revenue (undefined) Forecast, by Application 2020 & 2033
- Table 30: Mexico North America Service Robotics Industry Volume (K Unit) Forecast, by Application 2020 & 2033
Frequently Asked Questions
1. What is the projected Compound Annual Growth Rate (CAGR) of the North America Service Robotics Industry?
The projected CAGR is approximately 8.91%.
2. Which companies are prominent players in the North America Service Robotics Industry?
Key companies in the market include SeaRobotics Corporation, Robobuilder Co Ltd, Iberobtoics S L, Hanool Robotics Corporation, Amazon Inc, RedZone Robotics, KUKA AG, Gecko Systems Corporation, iRobot Corporation, Honda Motors Co Ltd, Northrop Grumman Corporation.
3. What are the main segments of the North America Service Robotics Industry?
The market segments include Type, Areas, Components, End-User industries, Countries.
4. Can you provide details about the market size?
The market size is estimated to be USD XXX N/A as of 2022.
5. What are some drivers contributing to market growth?
Increasing demand for these robots in defense sector; Focus towards research and development is leading to robots with more user-friendly features.
6. What are the notable trends driving market growth?
The Growing Demand of Service Robots in Healthcare Sector Aids in Market Growth.
7. Are there any restraints impacting market growth?
Interaction with robot is hindrance for some users; Initial high costs associated with development.
8. Can you provide examples of recent developments in the market?
August 2021: Canadian AI tech start-up leveraging Bell 5G to deliver food to downtown residents. Bell announced a collaboration with Tiny Mile to provide 5G connectivity for the Canadian AI start-up's growing fleet of food delivery robots in downtown Toronto.
9. What pricing options are available for accessing the report?
Pricing options include single-user, multi-user, and enterprise licenses priced at USD 4750, USD 5250, and USD 8750 respectively.
10. Is the market size provided in terms of value or volume?
The market size is provided in terms of value, measured in N/A and volume, measured in K Unit.
11. Are there any specific market keywords associated with the report?
Yes, the market keyword associated with the report is "North America Service Robotics Industry," which aids in identifying and referencing the specific market segment covered.
12. How do I determine which pricing option suits my needs best?
The pricing options vary based on user requirements and access needs. Individual users may opt for single-user licenses, while businesses requiring broader access may choose multi-user or enterprise licenses for cost-effective access to the report.
13. Are there any additional resources or data provided in the North America Service Robotics Industry report?
While the report offers comprehensive insights, it's advisable to review the specific contents or supplementary materials provided to ascertain if additional resources or data are available.
14. How can I stay updated on further developments or reports in the North America Service Robotics Industry?
To stay informed about further developments, trends, and reports in the North America Service Robotics Industry, consider subscribing to industry newsletters, following relevant companies and organizations, or regularly checking reputable industry news sources and publications.
Methodology
Step 1 - Identification of Relevant Samples Size from Population Database


Step 2 - Approaches for Defining Global Market Size (Value, Volume* & Price*)

Note*: In applicable scenarios
Step 3 - Data Sources
Primary Research
- Web Analytics
- Survey Reports
- Research Institute
- Latest Research Reports
- Opinion Leaders
Secondary Research
- Annual Reports
- White Paper
- Latest Press Release
- Industry Association
- Paid Database
- Investor Presentations

Step 4 - Data Triangulation
Involves using different sources of information in order to increase the validity of a study
These sources are likely to be stakeholders in a program - participants, other researchers, program staff, other community members, and so on.
Then we put all data in single framework & apply various statistical tools to find out the dynamic on the market.
During the analysis stage, feedback from the stakeholder groups would be compared to determine areas of agreement as well as areas of divergence