
Key Insights
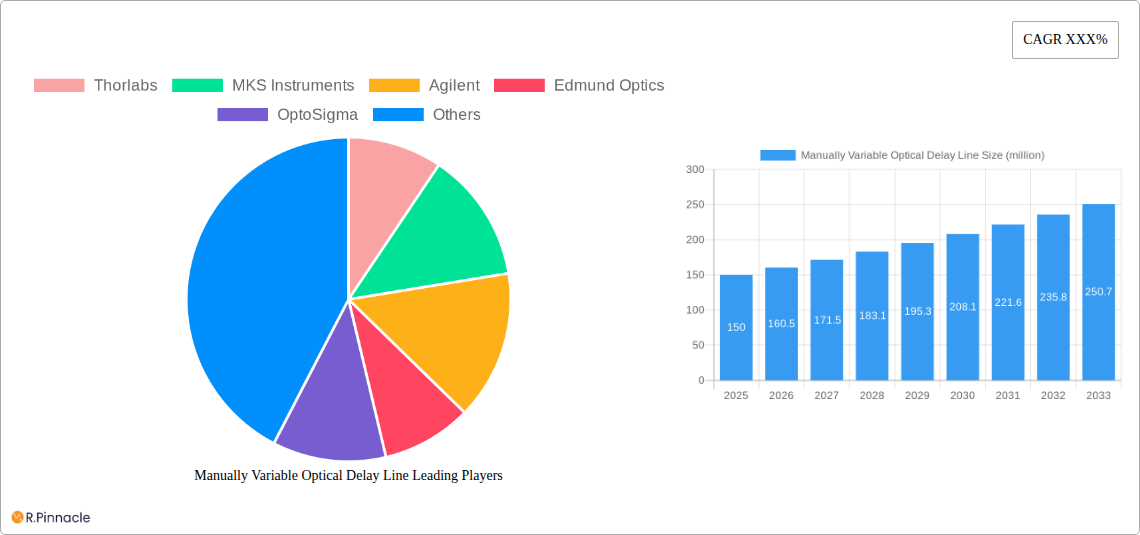
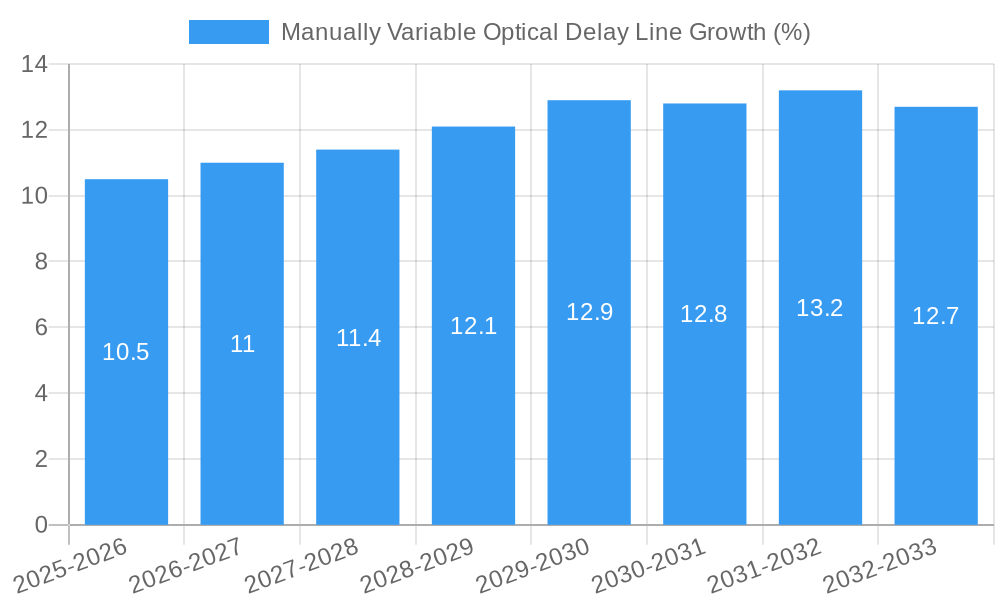
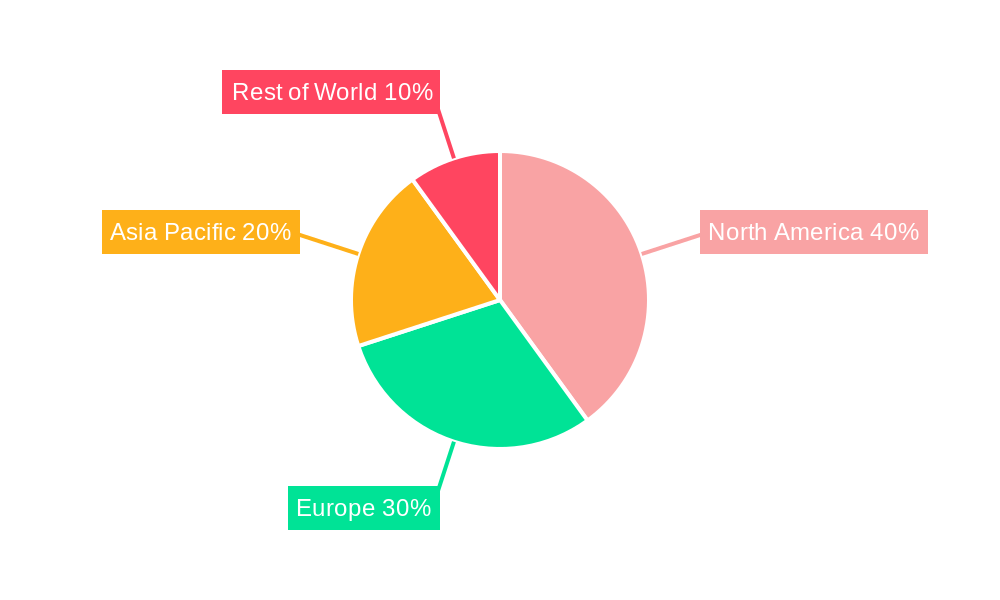
The manually variable optical delay line market is experiencing robust growth, driven by increasing demand across diverse applications, primarily in optical communication, sensing, and measurement. The market, estimated at $150 million in 2025, is projected to witness a Compound Annual Growth Rate (CAGR) of 7% from 2025 to 2033, reaching approximately $250 million by the end of the forecast period. This growth is fueled by advancements in high-speed data transmission technologies, the proliferation of fiber optic networks, and the rising adoption of optical sensing techniques in various industries, including healthcare and automotive. The segment encompassing femtosecond delay lines is expected to show the highest growth, driven by its crucial role in precision time-resolved measurements. North America currently holds the largest market share, benefiting from a strong technological base and significant investments in research and development. However, Asia-Pacific is anticipated to experience the fastest growth during the forecast period, driven by increasing infrastructure development and technological advancements in countries like China and India. While the market faces challenges such as high initial investment costs and technological complexities associated with certain delay line types, the continuous development of more compact, cost-effective solutions is expected to mitigate these restraints.
Competition within the market is relatively concentrated, with key players including Thorlabs, MKS Instruments, Agilent, Edmund Optics, and others actively investing in R&D and expanding their product portfolios to cater to the evolving needs of diverse applications. The market is segmented by application (optical communication, optical sensing, optical measurement, others) and by type (nanosecond, picosecond, and femtosecond delay lines). The ongoing miniaturization of optical components and the development of integrated optical systems are expected to significantly impact future market trends, creating opportunities for innovative solutions and driving further market expansion. The market is poised for considerable growth, presenting lucrative opportunities for existing players and new entrants alike.
Manually Variable Optical Delay Line Market Report: 2019-2033
This comprehensive report provides an in-depth analysis of the Manually Variable Optical Delay Line market, offering invaluable insights for industry professionals, investors, and strategic decision-makers. The report covers the period 2019-2033, with a focus on the forecast period 2025-2033 and a base year of 2025. The market is segmented by application (Optical Communication, Optical Sensing, Optical Measurement, Others) and type (Nanosecond Delay Line, Picosecond Delay Line, Femtosecond Delay Line). Projected market values reach into the millions.
Manually Variable Optical Delay Line Market Structure & Innovation Trends
This section analyzes the competitive landscape, innovation drivers, and regulatory aspects of the Manually Variable Optical Delay Line market. The market is moderately concentrated, with key players such as Thorlabs, MKS Instruments, Agilent, Edmund Optics, OptoSigma, General Photonics, Ixblue, opticombine, and OPEAK holding a combined market share of approximately xx%. Innovation is driven by the increasing demand for high-precision optical systems in various applications, particularly in optical communication and sensing. Regulatory frameworks, while generally supportive of technological advancements, vary across regions and can impact market growth. Product substitutes, such as digital signal processing techniques, present a competitive challenge. M&A activity has been relatively moderate in recent years, with a total deal value of approximately $xx million during the historical period (2019-2024). End-user demographics are diverse, spanning research institutions, telecommunication companies, and industrial manufacturers.
- Market Concentration: Moderately concentrated, with top players holding xx% market share.
- Innovation Drivers: Demand for high-precision optical systems, advancements in materials science.
- Regulatory Frameworks: Vary across regions, generally supportive of innovation.
- M&A Activity (2019-2024): Total deal value approximately $xx million.
Manually Variable Optical Delay Line Market Dynamics & Trends
The Manually Variable Optical Delay Line market is experiencing significant growth, driven by technological advancements and increasing demand across various applications. The Compound Annual Growth Rate (CAGR) during the forecast period (2025-2033) is projected to be xx%, with market penetration steadily increasing. Key growth drivers include the rising adoption of 5G and other high-speed communication networks, advancements in optical sensing technologies for applications like LiDAR and biomedical imaging, and the increasing need for precise optical measurements in scientific research. Technological disruptions, particularly in the areas of miniaturization and integration, are shaping market trends. Consumer preferences are shifting towards higher precision, smaller form factors, and greater cost-effectiveness. Competitive dynamics are characterized by intense innovation and strategic partnerships among key players. Market size is expected to reach $xx million by 2033.
Dominant Regions & Segments in Manually Variable Optical Delay Line
North America currently dominates the Manually Variable Optical Delay Line market, driven by strong technological advancements and substantial investments in research and development. Europe and Asia Pacific are also exhibiting significant growth. Within application segments, Optical Communication accounts for the largest share, followed by Optical Sensing and Optical Measurement. The Picosecond Delay Line segment is experiencing the fastest growth rate due to its applicability in high-speed optical communication and precision timing applications.
- Key Drivers for North American Dominance:
- Strong R&D investments.
- Established technology base.
- High adoption rates in key applications.
- Key Drivers for Growth in Asia Pacific:
- Expanding telecommunications infrastructure.
- Increasing industrial automation.
- Favorable government policies.
- Dominant Application Segment: Optical Communication
- Fastest Growing Type Segment: Picosecond Delay Line
Manually Variable Optical Delay Line Product Innovations
Recent product innovations focus on miniaturization, improved precision, and enhanced stability. Companies are developing compact, high-performance Manually Variable Optical Delay Lines that meet the demands of increasingly sophisticated applications. The integration of advanced materials and control systems is improving device performance and extending the range of applications. These innovations are driving market penetration and creating new competitive advantages. The trend towards higher frequency operation and better environmental stability are also notable developments.
Report Scope & Segmentation Analysis
This report comprehensively segments the Manually Variable Optical Delay Line market by application (Optical Communication, Optical Sensing, Optical Measurement, Others) and type (Nanosecond Delay Line, Picosecond Delay Line, Femtosecond Delay Line). Each segment is analyzed based on historical data, current market size, growth projections, and competitive dynamics. The report provides detailed insights into market size, growth drivers, and competitive landscapes for each segment. Growth projections indicate a significant increase in market size for all segments over the forecast period.
Key Drivers of Manually Variable Optical Delay Line Growth
Growth in the Manually Variable Optical Delay Line market is driven by several key factors. The rising demand for high-speed optical communication systems, particularly with the deployment of 5G networks, is a major driver. Advancements in optical sensing technologies and their increasing adoption across diverse applications like LiDAR and biomedical imaging fuel market expansion. Furthermore, the need for precise timing and synchronization in various scientific and industrial processes further contributes to market growth. Government initiatives promoting technological advancements in these areas also positively influence market expansion.
Challenges in the Manually Variable Optical Delay Line Sector
The Manually Variable Optical Delay Line market faces challenges such as high manufacturing costs, the availability of skilled labor and supply chain disruptions, which can impact production and delivery timelines. Stringent regulatory requirements in some regions add complexity to market entry and operation. Intense competition among existing and emerging players also puts pressure on pricing and margins. These factors can collectively affect market growth and profitability.
Emerging Opportunities in Manually Variable Optical Delay Line
Emerging opportunities exist in the development of compact and cost-effective devices for consumer electronics, the integration of Manually Variable Optical Delay Lines into advanced photonic systems, and expansion into new applications such as augmented and virtual reality technologies. Exploring new materials and fabrication techniques can lead to improvements in performance and reduction of costs. The expanding adoption of optical technologies across various sectors offers further growth potential.
Leading Players in the Manually Variable Optical Delay Line Market
- Thorlabs
- MKS Instruments
- Agilent
- Edmund Optics
- OptoSigma
- General Photonics
- Ixblue
- opticombine
- OPEAK
Key Developments in Manually Variable Optical Delay Line Industry
- 2022-10: Thorlabs launched a new series of high-precision Manually Variable Optical Delay Lines.
- 2023-03: MKS Instruments acquired a smaller competitor specializing in femtosecond delay lines.
- 2024-06: Agilent released a new software package enhancing the control and precision of its delay lines.
- (Further developments will be added in the final report)
Future Outlook for Manually Variable Optical Delay Line Market
The Manually Variable Optical Delay Line market is poised for continued growth, driven by the increasing demand for high-precision optical systems and ongoing technological advancements. The development of new applications and the integration of these devices into advanced photonic systems will create lucrative opportunities for market players. Strategic partnerships, focused R&D efforts, and aggressive product innovation will be critical for success in this dynamic market. The market's expansion into new sectors such as augmented reality and advanced imaging will likely further propel growth.
Manually Variable Optical Delay Line Segmentation
-
1. Application
- 1.1. Optical Communication
- 1.2. Optical Sensing
- 1.3. Optical Measurement
- 1.4. Others
-
2. Type
- 2.1. Nanosecond Delay Line
- 2.2. Picosecond Delay Line
- 2.3. Femtosecond Delay Line
Manually Variable Optical Delay Line Segmentation By Geography
-
1. North America
- 1.1. United States
- 1.2. Canada
- 1.3. Mexico
-
2. South America
- 2.1. Brazil
- 2.2. Argentina
- 2.3. Rest of South America
-
3. Europe
- 3.1. United Kingdom
- 3.2. Germany
- 3.3. France
- 3.4. Italy
- 3.5. Spain
- 3.6. Russia
- 3.7. Benelux
- 3.8. Nordics
- 3.9. Rest of Europe
-
4. Middle East & Africa
- 4.1. Turkey
- 4.2. Israel
- 4.3. GCC
- 4.4. North Africa
- 4.5. South Africa
- 4.6. Rest of Middle East & Africa
-
5. Asia Pacific
- 5.1. China
- 5.2. India
- 5.3. Japan
- 5.4. South Korea
- 5.5. ASEAN
- 5.6. Oceania
- 5.7. Rest of Asia Pacific
Manually Variable Optical Delay Line REPORT HIGHLIGHTS
| Aspects | Details |
|---|---|
| Study Period | 2019-2033 |
| Base Year | 2024 |
| Estimated Year | 2025 |
| Forecast Period | 2025-2033 |
| Historical Period | 2019-2024 |
| Growth Rate | CAGR of XXX% from 2019-2033 |
| Segmentation |
|
Table of Contents
- 1. Introduction
- 1.1. Research Scope
- 1.2. Market Segmentation
- 1.3. Research Methodology
- 1.4. Definitions and Assumptions
- 2. Executive Summary
- 2.1. Introduction
- 3. Market Dynamics
- 3.1. Introduction
- 3.2. Market Drivers
- 3.3. Market Restrains
- 3.4. Market Trends
- 4. Market Factor Analysis
- 4.1. Porters Five Forces
- 4.2. Supply/Value Chain
- 4.3. PESTEL analysis
- 4.4. Market Entropy
- 4.5. Patent/Trademark Analysis
- 5. Global Manually Variable Optical Delay Line Analysis, Insights and Forecast, 2019-2031
- 5.1. Market Analysis, Insights and Forecast - by Application
- 5.1.1. Optical Communication
- 5.1.2. Optical Sensing
- 5.1.3. Optical Measurement
- 5.1.4. Others
- 5.2. Market Analysis, Insights and Forecast - by Type
- 5.2.1. Nanosecond Delay Line
- 5.2.2. Picosecond Delay Line
- 5.2.3. Femtosecond Delay Line
- 5.3. Market Analysis, Insights and Forecast - by Region
- 5.3.1. North America
- 5.3.2. South America
- 5.3.3. Europe
- 5.3.4. Middle East & Africa
- 5.3.5. Asia Pacific
- 5.1. Market Analysis, Insights and Forecast - by Application
- 6. North America Manually Variable Optical Delay Line Analysis, Insights and Forecast, 2019-2031
- 6.1. Market Analysis, Insights and Forecast - by Application
- 6.1.1. Optical Communication
- 6.1.2. Optical Sensing
- 6.1.3. Optical Measurement
- 6.1.4. Others
- 6.2. Market Analysis, Insights and Forecast - by Type
- 6.2.1. Nanosecond Delay Line
- 6.2.2. Picosecond Delay Line
- 6.2.3. Femtosecond Delay Line
- 6.1. Market Analysis, Insights and Forecast - by Application
- 7. South America Manually Variable Optical Delay Line Analysis, Insights and Forecast, 2019-2031
- 7.1. Market Analysis, Insights and Forecast - by Application
- 7.1.1. Optical Communication
- 7.1.2. Optical Sensing
- 7.1.3. Optical Measurement
- 7.1.4. Others
- 7.2. Market Analysis, Insights and Forecast - by Type
- 7.2.1. Nanosecond Delay Line
- 7.2.2. Picosecond Delay Line
- 7.2.3. Femtosecond Delay Line
- 7.1. Market Analysis, Insights and Forecast - by Application
- 8. Europe Manually Variable Optical Delay Line Analysis, Insights and Forecast, 2019-2031
- 8.1. Market Analysis, Insights and Forecast - by Application
- 8.1.1. Optical Communication
- 8.1.2. Optical Sensing
- 8.1.3. Optical Measurement
- 8.1.4. Others
- 8.2. Market Analysis, Insights and Forecast - by Type
- 8.2.1. Nanosecond Delay Line
- 8.2.2. Picosecond Delay Line
- 8.2.3. Femtosecond Delay Line
- 8.1. Market Analysis, Insights and Forecast - by Application
- 9. Middle East & Africa Manually Variable Optical Delay Line Analysis, Insights and Forecast, 2019-2031
- 9.1. Market Analysis, Insights and Forecast - by Application
- 9.1.1. Optical Communication
- 9.1.2. Optical Sensing
- 9.1.3. Optical Measurement
- 9.1.4. Others
- 9.2. Market Analysis, Insights and Forecast - by Type
- 9.2.1. Nanosecond Delay Line
- 9.2.2. Picosecond Delay Line
- 9.2.3. Femtosecond Delay Line
- 9.1. Market Analysis, Insights and Forecast - by Application
- 10. Asia Pacific Manually Variable Optical Delay Line Analysis, Insights and Forecast, 2019-2031
- 10.1. Market Analysis, Insights and Forecast - by Application
- 10.1.1. Optical Communication
- 10.1.2. Optical Sensing
- 10.1.3. Optical Measurement
- 10.1.4. Others
- 10.2. Market Analysis, Insights and Forecast - by Type
- 10.2.1. Nanosecond Delay Line
- 10.2.2. Picosecond Delay Line
- 10.2.3. Femtosecond Delay Line
- 10.1. Market Analysis, Insights and Forecast - by Application
- 11. Competitive Analysis
- 11.1. Global Market Share Analysis 2024
- 11.2. Company Profiles
- 11.2.1 Thorlabs
- 11.2.1.1. Overview
- 11.2.1.2. Products
- 11.2.1.3. SWOT Analysis
- 11.2.1.4. Recent Developments
- 11.2.1.5. Financials (Based on Availability)
- 11.2.2 MKS Instruments
- 11.2.2.1. Overview
- 11.2.2.2. Products
- 11.2.2.3. SWOT Analysis
- 11.2.2.4. Recent Developments
- 11.2.2.5. Financials (Based on Availability)
- 11.2.3 Agilent
- 11.2.3.1. Overview
- 11.2.3.2. Products
- 11.2.3.3. SWOT Analysis
- 11.2.3.4. Recent Developments
- 11.2.3.5. Financials (Based on Availability)
- 11.2.4 Edmund Optics
- 11.2.4.1. Overview
- 11.2.4.2. Products
- 11.2.4.3. SWOT Analysis
- 11.2.4.4. Recent Developments
- 11.2.4.5. Financials (Based on Availability)
- 11.2.5 OptoSigma
- 11.2.5.1. Overview
- 11.2.5.2. Products
- 11.2.5.3. SWOT Analysis
- 11.2.5.4. Recent Developments
- 11.2.5.5. Financials (Based on Availability)
- 11.2.6 General Photonics
- 11.2.6.1. Overview
- 11.2.6.2. Products
- 11.2.6.3. SWOT Analysis
- 11.2.6.4. Recent Developments
- 11.2.6.5. Financials (Based on Availability)
- 11.2.7 Ixblue
- 11.2.7.1. Overview
- 11.2.7.2. Products
- 11.2.7.3. SWOT Analysis
- 11.2.7.4. Recent Developments
- 11.2.7.5. Financials (Based on Availability)
- 11.2.8 opticombine
- 11.2.8.1. Overview
- 11.2.8.2. Products
- 11.2.8.3. SWOT Analysis
- 11.2.8.4. Recent Developments
- 11.2.8.5. Financials (Based on Availability)
- 11.2.9 OPEAK
- 11.2.9.1. Overview
- 11.2.9.2. Products
- 11.2.9.3. SWOT Analysis
- 11.2.9.4. Recent Developments
- 11.2.9.5. Financials (Based on Availability)
- 11.2.1 Thorlabs
List of Figures
- Figure 1: Global Manually Variable Optical Delay Line Revenue Breakdown (million, %) by Region 2024 & 2032
- Figure 2: Global Manually Variable Optical Delay Line Volume Breakdown (K, %) by Region 2024 & 2032
- Figure 3: North America Manually Variable Optical Delay Line Revenue (million), by Application 2024 & 2032
- Figure 4: North America Manually Variable Optical Delay Line Volume (K), by Application 2024 & 2032
- Figure 5: North America Manually Variable Optical Delay Line Revenue Share (%), by Application 2024 & 2032
- Figure 6: North America Manually Variable Optical Delay Line Volume Share (%), by Application 2024 & 2032
- Figure 7: North America Manually Variable Optical Delay Line Revenue (million), by Type 2024 & 2032
- Figure 8: North America Manually Variable Optical Delay Line Volume (K), by Type 2024 & 2032
- Figure 9: North America Manually Variable Optical Delay Line Revenue Share (%), by Type 2024 & 2032
- Figure 10: North America Manually Variable Optical Delay Line Volume Share (%), by Type 2024 & 2032
- Figure 11: North America Manually Variable Optical Delay Line Revenue (million), by Country 2024 & 2032
- Figure 12: North America Manually Variable Optical Delay Line Volume (K), by Country 2024 & 2032
- Figure 13: North America Manually Variable Optical Delay Line Revenue Share (%), by Country 2024 & 2032
- Figure 14: North America Manually Variable Optical Delay Line Volume Share (%), by Country 2024 & 2032
- Figure 15: South America Manually Variable Optical Delay Line Revenue (million), by Application 2024 & 2032
- Figure 16: South America Manually Variable Optical Delay Line Volume (K), by Application 2024 & 2032
- Figure 17: South America Manually Variable Optical Delay Line Revenue Share (%), by Application 2024 & 2032
- Figure 18: South America Manually Variable Optical Delay Line Volume Share (%), by Application 2024 & 2032
- Figure 19: South America Manually Variable Optical Delay Line Revenue (million), by Type 2024 & 2032
- Figure 20: South America Manually Variable Optical Delay Line Volume (K), by Type 2024 & 2032
- Figure 21: South America Manually Variable Optical Delay Line Revenue Share (%), by Type 2024 & 2032
- Figure 22: South America Manually Variable Optical Delay Line Volume Share (%), by Type 2024 & 2032
- Figure 23: South America Manually Variable Optical Delay Line Revenue (million), by Country 2024 & 2032
- Figure 24: South America Manually Variable Optical Delay Line Volume (K), by Country 2024 & 2032
- Figure 25: South America Manually Variable Optical Delay Line Revenue Share (%), by Country 2024 & 2032
- Figure 26: South America Manually Variable Optical Delay Line Volume Share (%), by Country 2024 & 2032
- Figure 27: Europe Manually Variable Optical Delay Line Revenue (million), by Application 2024 & 2032
- Figure 28: Europe Manually Variable Optical Delay Line Volume (K), by Application 2024 & 2032
- Figure 29: Europe Manually Variable Optical Delay Line Revenue Share (%), by Application 2024 & 2032
- Figure 30: Europe Manually Variable Optical Delay Line Volume Share (%), by Application 2024 & 2032
- Figure 31: Europe Manually Variable Optical Delay Line Revenue (million), by Type 2024 & 2032
- Figure 32: Europe Manually Variable Optical Delay Line Volume (K), by Type 2024 & 2032
- Figure 33: Europe Manually Variable Optical Delay Line Revenue Share (%), by Type 2024 & 2032
- Figure 34: Europe Manually Variable Optical Delay Line Volume Share (%), by Type 2024 & 2032
- Figure 35: Europe Manually Variable Optical Delay Line Revenue (million), by Country 2024 & 2032
- Figure 36: Europe Manually Variable Optical Delay Line Volume (K), by Country 2024 & 2032
- Figure 37: Europe Manually Variable Optical Delay Line Revenue Share (%), by Country 2024 & 2032
- Figure 38: Europe Manually Variable Optical Delay Line Volume Share (%), by Country 2024 & 2032
- Figure 39: Middle East & Africa Manually Variable Optical Delay Line Revenue (million), by Application 2024 & 2032
- Figure 40: Middle East & Africa Manually Variable Optical Delay Line Volume (K), by Application 2024 & 2032
- Figure 41: Middle East & Africa Manually Variable Optical Delay Line Revenue Share (%), by Application 2024 & 2032
- Figure 42: Middle East & Africa Manually Variable Optical Delay Line Volume Share (%), by Application 2024 & 2032
- Figure 43: Middle East & Africa Manually Variable Optical Delay Line Revenue (million), by Type 2024 & 2032
- Figure 44: Middle East & Africa Manually Variable Optical Delay Line Volume (K), by Type 2024 & 2032
- Figure 45: Middle East & Africa Manually Variable Optical Delay Line Revenue Share (%), by Type 2024 & 2032
- Figure 46: Middle East & Africa Manually Variable Optical Delay Line Volume Share (%), by Type 2024 & 2032
- Figure 47: Middle East & Africa Manually Variable Optical Delay Line Revenue (million), by Country 2024 & 2032
- Figure 48: Middle East & Africa Manually Variable Optical Delay Line Volume (K), by Country 2024 & 2032
- Figure 49: Middle East & Africa Manually Variable Optical Delay Line Revenue Share (%), by Country 2024 & 2032
- Figure 50: Middle East & Africa Manually Variable Optical Delay Line Volume Share (%), by Country 2024 & 2032
- Figure 51: Asia Pacific Manually Variable Optical Delay Line Revenue (million), by Application 2024 & 2032
- Figure 52: Asia Pacific Manually Variable Optical Delay Line Volume (K), by Application 2024 & 2032
- Figure 53: Asia Pacific Manually Variable Optical Delay Line Revenue Share (%), by Application 2024 & 2032
- Figure 54: Asia Pacific Manually Variable Optical Delay Line Volume Share (%), by Application 2024 & 2032
- Figure 55: Asia Pacific Manually Variable Optical Delay Line Revenue (million), by Type 2024 & 2032
- Figure 56: Asia Pacific Manually Variable Optical Delay Line Volume (K), by Type 2024 & 2032
- Figure 57: Asia Pacific Manually Variable Optical Delay Line Revenue Share (%), by Type 2024 & 2032
- Figure 58: Asia Pacific Manually Variable Optical Delay Line Volume Share (%), by Type 2024 & 2032
- Figure 59: Asia Pacific Manually Variable Optical Delay Line Revenue (million), by Country 2024 & 2032
- Figure 60: Asia Pacific Manually Variable Optical Delay Line Volume (K), by Country 2024 & 2032
- Figure 61: Asia Pacific Manually Variable Optical Delay Line Revenue Share (%), by Country 2024 & 2032
- Figure 62: Asia Pacific Manually Variable Optical Delay Line Volume Share (%), by Country 2024 & 2032
List of Tables
- Table 1: Global Manually Variable Optical Delay Line Revenue million Forecast, by Region 2019 & 2032
- Table 2: Global Manually Variable Optical Delay Line Volume K Forecast, by Region 2019 & 2032
- Table 3: Global Manually Variable Optical Delay Line Revenue million Forecast, by Application 2019 & 2032
- Table 4: Global Manually Variable Optical Delay Line Volume K Forecast, by Application 2019 & 2032
- Table 5: Global Manually Variable Optical Delay Line Revenue million Forecast, by Type 2019 & 2032
- Table 6: Global Manually Variable Optical Delay Line Volume K Forecast, by Type 2019 & 2032
- Table 7: Global Manually Variable Optical Delay Line Revenue million Forecast, by Region 2019 & 2032
- Table 8: Global Manually Variable Optical Delay Line Volume K Forecast, by Region 2019 & 2032
- Table 9: Global Manually Variable Optical Delay Line Revenue million Forecast, by Application 2019 & 2032
- Table 10: Global Manually Variable Optical Delay Line Volume K Forecast, by Application 2019 & 2032
- Table 11: Global Manually Variable Optical Delay Line Revenue million Forecast, by Type 2019 & 2032
- Table 12: Global Manually Variable Optical Delay Line Volume K Forecast, by Type 2019 & 2032
- Table 13: Global Manually Variable Optical Delay Line Revenue million Forecast, by Country 2019 & 2032
- Table 14: Global Manually Variable Optical Delay Line Volume K Forecast, by Country 2019 & 2032
- Table 15: United States Manually Variable Optical Delay Line Revenue (million) Forecast, by Application 2019 & 2032
- Table 16: United States Manually Variable Optical Delay Line Volume (K) Forecast, by Application 2019 & 2032
- Table 17: Canada Manually Variable Optical Delay Line Revenue (million) Forecast, by Application 2019 & 2032
- Table 18: Canada Manually Variable Optical Delay Line Volume (K) Forecast, by Application 2019 & 2032
- Table 19: Mexico Manually Variable Optical Delay Line Revenue (million) Forecast, by Application 2019 & 2032
- Table 20: Mexico Manually Variable Optical Delay Line Volume (K) Forecast, by Application 2019 & 2032
- Table 21: Global Manually Variable Optical Delay Line Revenue million Forecast, by Application 2019 & 2032
- Table 22: Global Manually Variable Optical Delay Line Volume K Forecast, by Application 2019 & 2032
- Table 23: Global Manually Variable Optical Delay Line Revenue million Forecast, by Type 2019 & 2032
- Table 24: Global Manually Variable Optical Delay Line Volume K Forecast, by Type 2019 & 2032
- Table 25: Global Manually Variable Optical Delay Line Revenue million Forecast, by Country 2019 & 2032
- Table 26: Global Manually Variable Optical Delay Line Volume K Forecast, by Country 2019 & 2032
- Table 27: Brazil Manually Variable Optical Delay Line Revenue (million) Forecast, by Application 2019 & 2032
- Table 28: Brazil Manually Variable Optical Delay Line Volume (K) Forecast, by Application 2019 & 2032
- Table 29: Argentina Manually Variable Optical Delay Line Revenue (million) Forecast, by Application 2019 & 2032
- Table 30: Argentina Manually Variable Optical Delay Line Volume (K) Forecast, by Application 2019 & 2032
- Table 31: Rest of South America Manually Variable Optical Delay Line Revenue (million) Forecast, by Application 2019 & 2032
- Table 32: Rest of South America Manually Variable Optical Delay Line Volume (K) Forecast, by Application 2019 & 2032
- Table 33: Global Manually Variable Optical Delay Line Revenue million Forecast, by Application 2019 & 2032
- Table 34: Global Manually Variable Optical Delay Line Volume K Forecast, by Application 2019 & 2032
- Table 35: Global Manually Variable Optical Delay Line Revenue million Forecast, by Type 2019 & 2032
- Table 36: Global Manually Variable Optical Delay Line Volume K Forecast, by Type 2019 & 2032
- Table 37: Global Manually Variable Optical Delay Line Revenue million Forecast, by Country 2019 & 2032
- Table 38: Global Manually Variable Optical Delay Line Volume K Forecast, by Country 2019 & 2032
- Table 39: United Kingdom Manually Variable Optical Delay Line Revenue (million) Forecast, by Application 2019 & 2032
- Table 40: United Kingdom Manually Variable Optical Delay Line Volume (K) Forecast, by Application 2019 & 2032
- Table 41: Germany Manually Variable Optical Delay Line Revenue (million) Forecast, by Application 2019 & 2032
- Table 42: Germany Manually Variable Optical Delay Line Volume (K) Forecast, by Application 2019 & 2032
- Table 43: France Manually Variable Optical Delay Line Revenue (million) Forecast, by Application 2019 & 2032
- Table 44: France Manually Variable Optical Delay Line Volume (K) Forecast, by Application 2019 & 2032
- Table 45: Italy Manually Variable Optical Delay Line Revenue (million) Forecast, by Application 2019 & 2032
- Table 46: Italy Manually Variable Optical Delay Line Volume (K) Forecast, by Application 2019 & 2032
- Table 47: Spain Manually Variable Optical Delay Line Revenue (million) Forecast, by Application 2019 & 2032
- Table 48: Spain Manually Variable Optical Delay Line Volume (K) Forecast, by Application 2019 & 2032
- Table 49: Russia Manually Variable Optical Delay Line Revenue (million) Forecast, by Application 2019 & 2032
- Table 50: Russia Manually Variable Optical Delay Line Volume (K) Forecast, by Application 2019 & 2032
- Table 51: Benelux Manually Variable Optical Delay Line Revenue (million) Forecast, by Application 2019 & 2032
- Table 52: Benelux Manually Variable Optical Delay Line Volume (K) Forecast, by Application 2019 & 2032
- Table 53: Nordics Manually Variable Optical Delay Line Revenue (million) Forecast, by Application 2019 & 2032
- Table 54: Nordics Manually Variable Optical Delay Line Volume (K) Forecast, by Application 2019 & 2032
- Table 55: Rest of Europe Manually Variable Optical Delay Line Revenue (million) Forecast, by Application 2019 & 2032
- Table 56: Rest of Europe Manually Variable Optical Delay Line Volume (K) Forecast, by Application 2019 & 2032
- Table 57: Global Manually Variable Optical Delay Line Revenue million Forecast, by Application 2019 & 2032
- Table 58: Global Manually Variable Optical Delay Line Volume K Forecast, by Application 2019 & 2032
- Table 59: Global Manually Variable Optical Delay Line Revenue million Forecast, by Type 2019 & 2032
- Table 60: Global Manually Variable Optical Delay Line Volume K Forecast, by Type 2019 & 2032
- Table 61: Global Manually Variable Optical Delay Line Revenue million Forecast, by Country 2019 & 2032
- Table 62: Global Manually Variable Optical Delay Line Volume K Forecast, by Country 2019 & 2032
- Table 63: Turkey Manually Variable Optical Delay Line Revenue (million) Forecast, by Application 2019 & 2032
- Table 64: Turkey Manually Variable Optical Delay Line Volume (K) Forecast, by Application 2019 & 2032
- Table 65: Israel Manually Variable Optical Delay Line Revenue (million) Forecast, by Application 2019 & 2032
- Table 66: Israel Manually Variable Optical Delay Line Volume (K) Forecast, by Application 2019 & 2032
- Table 67: GCC Manually Variable Optical Delay Line Revenue (million) Forecast, by Application 2019 & 2032
- Table 68: GCC Manually Variable Optical Delay Line Volume (K) Forecast, by Application 2019 & 2032
- Table 69: North Africa Manually Variable Optical Delay Line Revenue (million) Forecast, by Application 2019 & 2032
- Table 70: North Africa Manually Variable Optical Delay Line Volume (K) Forecast, by Application 2019 & 2032
- Table 71: South Africa Manually Variable Optical Delay Line Revenue (million) Forecast, by Application 2019 & 2032
- Table 72: South Africa Manually Variable Optical Delay Line Volume (K) Forecast, by Application 2019 & 2032
- Table 73: Rest of Middle East & Africa Manually Variable Optical Delay Line Revenue (million) Forecast, by Application 2019 & 2032
- Table 74: Rest of Middle East & Africa Manually Variable Optical Delay Line Volume (K) Forecast, by Application 2019 & 2032
- Table 75: Global Manually Variable Optical Delay Line Revenue million Forecast, by Application 2019 & 2032
- Table 76: Global Manually Variable Optical Delay Line Volume K Forecast, by Application 2019 & 2032
- Table 77: Global Manually Variable Optical Delay Line Revenue million Forecast, by Type 2019 & 2032
- Table 78: Global Manually Variable Optical Delay Line Volume K Forecast, by Type 2019 & 2032
- Table 79: Global Manually Variable Optical Delay Line Revenue million Forecast, by Country 2019 & 2032
- Table 80: Global Manually Variable Optical Delay Line Volume K Forecast, by Country 2019 & 2032
- Table 81: China Manually Variable Optical Delay Line Revenue (million) Forecast, by Application 2019 & 2032
- Table 82: China Manually Variable Optical Delay Line Volume (K) Forecast, by Application 2019 & 2032
- Table 83: India Manually Variable Optical Delay Line Revenue (million) Forecast, by Application 2019 & 2032
- Table 84: India Manually Variable Optical Delay Line Volume (K) Forecast, by Application 2019 & 2032
- Table 85: Japan Manually Variable Optical Delay Line Revenue (million) Forecast, by Application 2019 & 2032
- Table 86: Japan Manually Variable Optical Delay Line Volume (K) Forecast, by Application 2019 & 2032
- Table 87: South Korea Manually Variable Optical Delay Line Revenue (million) Forecast, by Application 2019 & 2032
- Table 88: South Korea Manually Variable Optical Delay Line Volume (K) Forecast, by Application 2019 & 2032
- Table 89: ASEAN Manually Variable Optical Delay Line Revenue (million) Forecast, by Application 2019 & 2032
- Table 90: ASEAN Manually Variable Optical Delay Line Volume (K) Forecast, by Application 2019 & 2032
- Table 91: Oceania Manually Variable Optical Delay Line Revenue (million) Forecast, by Application 2019 & 2032
- Table 92: Oceania Manually Variable Optical Delay Line Volume (K) Forecast, by Application 2019 & 2032
- Table 93: Rest of Asia Pacific Manually Variable Optical Delay Line Revenue (million) Forecast, by Application 2019 & 2032
- Table 94: Rest of Asia Pacific Manually Variable Optical Delay Line Volume (K) Forecast, by Application 2019 & 2032
Frequently Asked Questions
1. What is the projected Compound Annual Growth Rate (CAGR) of the Manually Variable Optical Delay Line?
The projected CAGR is approximately XXX%.
2. Which companies are prominent players in the Manually Variable Optical Delay Line?
Key companies in the market include Thorlabs, MKS Instruments, Agilent, Edmund Optics, OptoSigma, General Photonics, Ixblue, opticombine, OPEAK.
3. What are the main segments of the Manually Variable Optical Delay Line?
The market segments include Application, Type.
4. Can you provide details about the market size?
The market size is estimated to be USD XXX million as of 2022.
5. What are some drivers contributing to market growth?
N/A
6. What are the notable trends driving market growth?
N/A
7. Are there any restraints impacting market growth?
N/A
8. Can you provide examples of recent developments in the market?
N/A
9. What pricing options are available for accessing the report?
Pricing options include single-user, multi-user, and enterprise licenses priced at USD 3950.00, USD 5925.00, and USD 7900.00 respectively.
10. Is the market size provided in terms of value or volume?
The market size is provided in terms of value, measured in million and volume, measured in K.
11. Are there any specific market keywords associated with the report?
Yes, the market keyword associated with the report is "Manually Variable Optical Delay Line," which aids in identifying and referencing the specific market segment covered.
12. How do I determine which pricing option suits my needs best?
The pricing options vary based on user requirements and access needs. Individual users may opt for single-user licenses, while businesses requiring broader access may choose multi-user or enterprise licenses for cost-effective access to the report.
13. Are there any additional resources or data provided in the Manually Variable Optical Delay Line report?
While the report offers comprehensive insights, it's advisable to review the specific contents or supplementary materials provided to ascertain if additional resources or data are available.
14. How can I stay updated on further developments or reports in the Manually Variable Optical Delay Line?
To stay informed about further developments, trends, and reports in the Manually Variable Optical Delay Line, consider subscribing to industry newsletters, following relevant companies and organizations, or regularly checking reputable industry news sources and publications.
Methodology
Step 1 - Identification of Relevant Samples Size from Population Database


Step 2 - Approaches for Defining Global Market Size (Value, Volume* & Price*)

Note*: In applicable scenarios
Step 3 - Data Sources
Primary Research
- Web Analytics
- Survey Reports
- Research Institute
- Latest Research Reports
- Opinion Leaders
Secondary Research
- Annual Reports
- White Paper
- Latest Press Release
- Industry Association
- Paid Database
- Investor Presentations

Step 4 - Data Triangulation
Involves using different sources of information in order to increase the validity of a study
These sources are likely to be stakeholders in a program - participants, other researchers, program staff, other community members, and so on.
Then we put all data in single framework & apply various statistical tools to find out the dynamic on the market.
During the analysis stage, feedback from the stakeholder groups would be compared to determine areas of agreement as well as areas of divergence


